
Research article · 2019 · Full text
International Journal of Statistics and Applied MathematicsComputational study of natural convection in a rectangular porous enclosure with partially active wall in different heater and cooler positions
Volume 4(6) · Pages 01–13
Research areasNanofluid Flow and Heat TransferHeat and Mass Transfer in Porous MediaHeat Transfer Mechanisms
Abstract
Author-writtenNatural convection heat transfer and fluid flow through a two-dimensional rectangular porous enclosure with partially active thermal walls are investigated numerically in this study. A small part of two sidewalls are partially cooled at a constant temperature θc and a small part of the bottom wall is kept at constant temperature θh (θh > θc), where the top and the remaining part of the bottom wall and the side walls of the enclosure are assumed to be insulated. The physical problems are presented mathematically by different sets of governing equations (such as the mass, momentum and energy balance equations) along with the corresponding initial and boundary conditions by using Brinkman-Forchheimer-extended Darcy flow model and the Boussinesq approximation. Galerkin weighted residual method of finite element analysis is implemented to discretise the governing equations. The analysis has been carried out for the cavity Aspect ratio (Ar = 1, 2, 3), the three positions of heating source: left position (Lp), middle position (Mp), right position (Rp) and the three positions of cooling source: top cold (Tc), middle cold (Mc), and bottom cold (Bc) with various heater length and fixed Darcy number (Da), Porosity (e), Prandtl number (Pr) for two values of Grashof number (Gr = 105, 106) with respect to time (τ). Results are presented in terms of isotherms, streamlines, average Nusselt number along the partially active thermal wall for different combinations of the governing parameters. The results indicate that both the flow and the thermal fields strongly depend on the above-mentioned parameters. The computational results also indicate that the average Nusselt number at the heated part of active wall with respect to time are depending on the aforementioned parameters. The results in terms of average Nusselt number are also shown in tabular form.
Summary
Source-checkedPlain-language reading of the full paper, prepared with AI and checked against the text. Each point links to the authors' own words.
Why it matters
- Natural convection in porous media is critical for various technical applications, including geothermal reservoirs, chemical industry separation, and crude oil production. View evidence ↗
- There is limited existing research regarding the flow structure and heat transfer specifically within porous enclosures that are only partially heated and cooled. View evidence ↗
The question
- The study aims to analyze how various physical parameters of the enclosure structure affect temperature, fluid flow, and the average heat transfer rate. View evidence ↗
What they did
- The model uses a rectangular enclosure where small portions of the two sidewalls are cooled and a small portion of the bottom wall is heated, with all other surfaces insulated. View evidence ↗
- The researchers used the Boussinesq approximation and the Brinkman-Forchheimer-extended Darcy flow model to define the mass, momentum, and energy balance equations. View evidence ↗
- The governing equations were discretized using the Galerkin weighted residual method of finite element analysis. View evidence ↗
What they found
- Increasing the cavity aspect ratio results in a lower heat transfer rate. View evidence ↗
- For aspect ratios of 2 and 3, the average Nusselt number decreases over time at both Grashof numbers, whereas it remains nearly constant for an aspect ratio of 1. View evidence ↗
- Increasing the Grashof number significantly increases the average Nusselt number across all aspect ratios due to enhanced convection. View evidence ↗
- Placing the heater in the middle position (Mp) provides the most effective heat transfer rate compared to other positions. View evidence ↗
- The average Nusselt number is lowest when the cooler is at the top (Tc), higher at the middle (Mc), and highest at the bottom (Bc) for all Grashof numbers. View evidence ↗
- Higher Grashof numbers lead to increased heat transfer and higher fluid temperatures. View evidence ↗
What it means
- The authors conclude that the cavity aspect ratio has a pronounced influence on both the temperature field and fluid flow. View evidence ↗
- The authors state that the position of the thermally active wall is a significant parameter in porous media. View evidence ↗
Visual summary
3 visualsIllustrations explain the paper; charts are replotted from the paper's own table values.
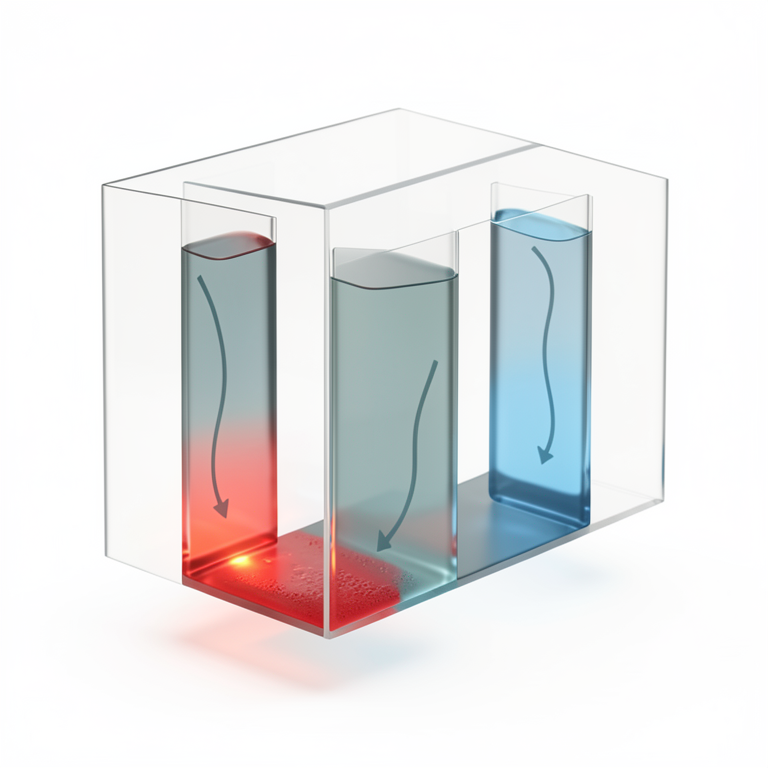
Enclosure Configuration
AI-generated conceptual illustration (A rectangular porous enclosure containing a fluid). It explains the idea and does not show study data.
View source evidence ↗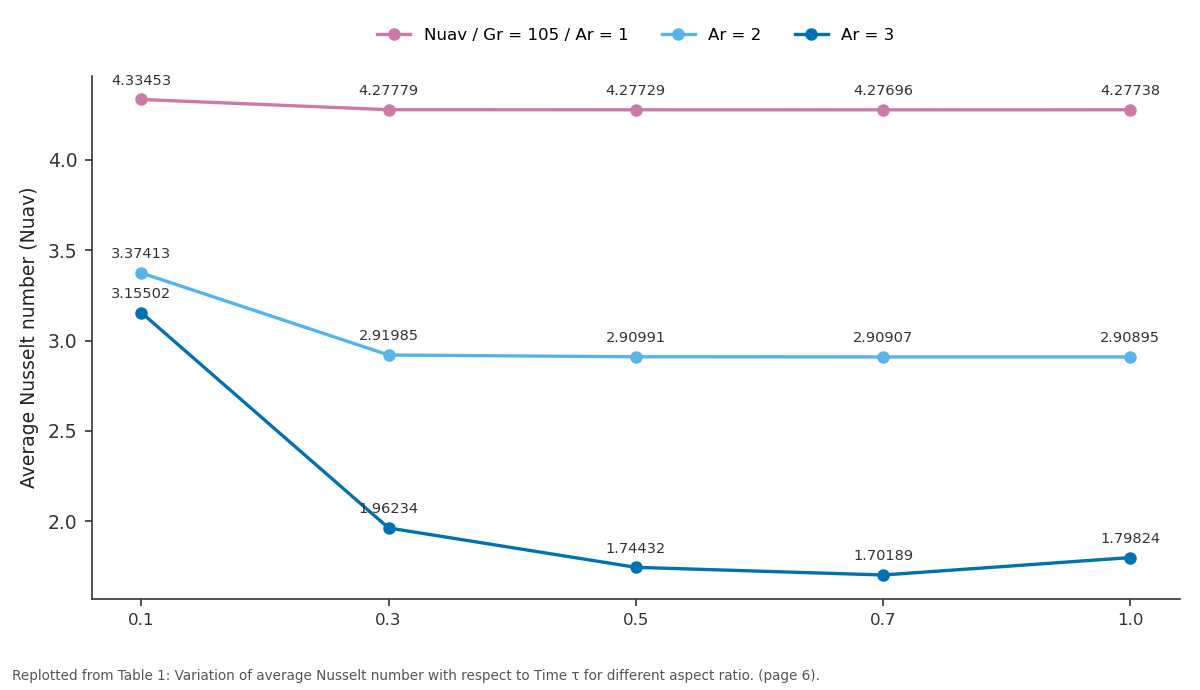
Nuav / Gr = 105 / Ar = 1 and Ar = 2 and more: 0.1 vs 0.3 vs 0.5 vs 0.7 vs 1.0
Replotted from Table 1 (page 6) of the original paper. Every bar is the paper's own table value.
View source evidence ↗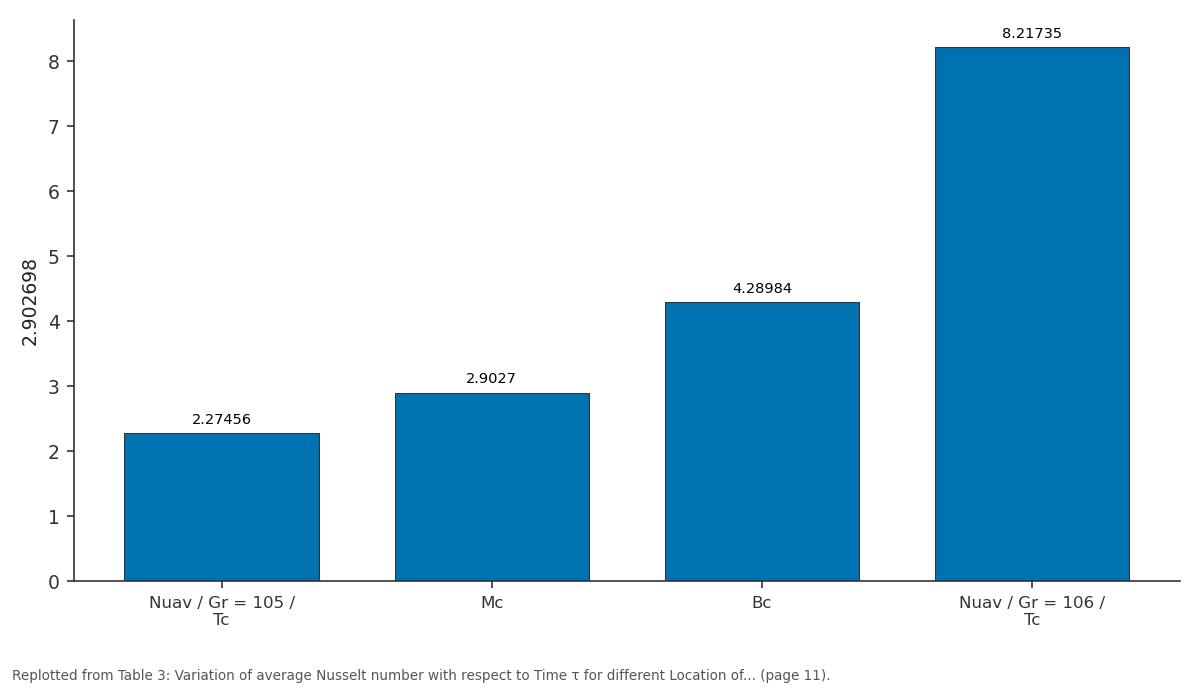
2.902698: Nuav / Gr = 105 / Tc vs Mc vs Bc vs Nuav / Gr = 106 / Tc
Replotted from Table 3 (page 11) of the original paper. Every bar is the paper's own table value.
View source evidence ↗Figures & tables
From the original paper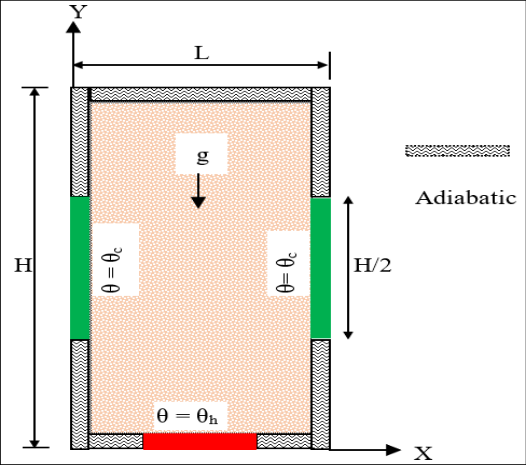 Figure 1
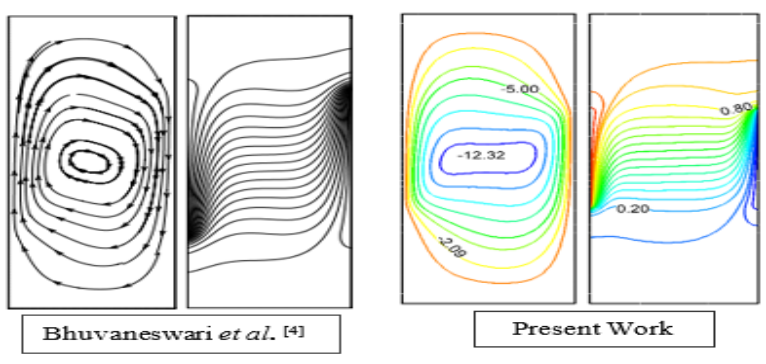 Figure 2
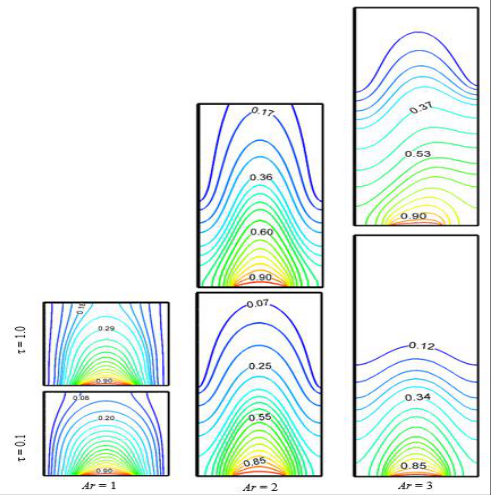 Figure 3
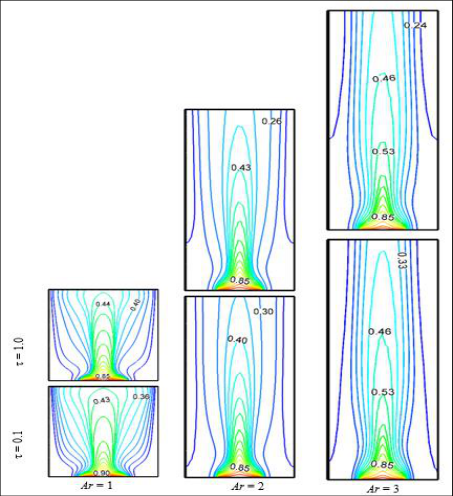 Figure 4
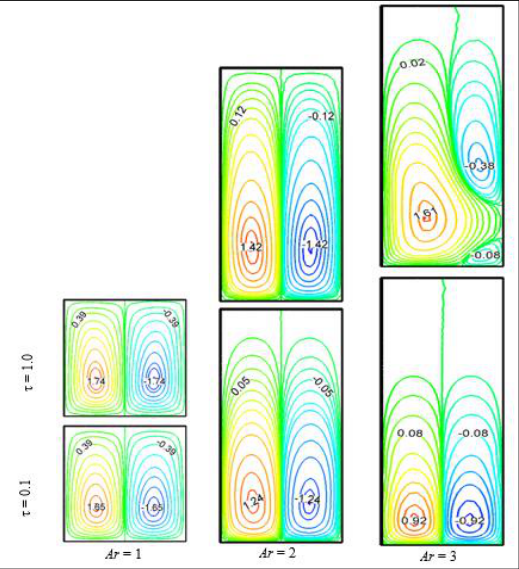 Figure 5
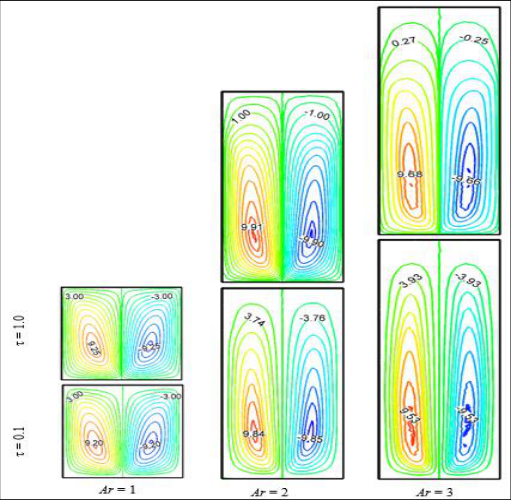 Figure 6
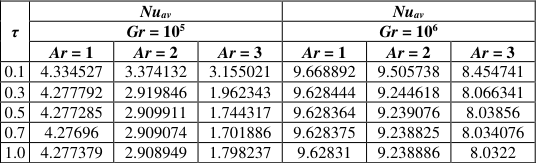 Table 1
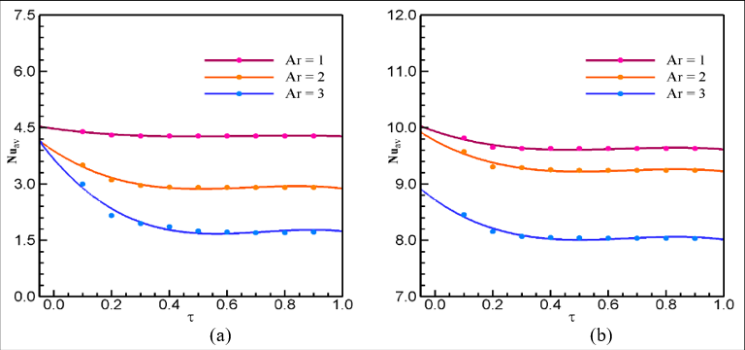 Figure 7
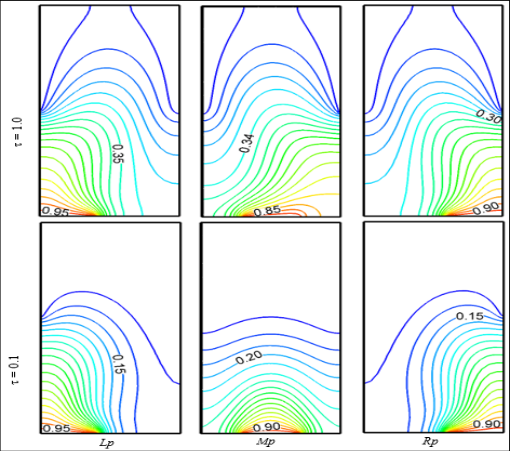 Figure 8
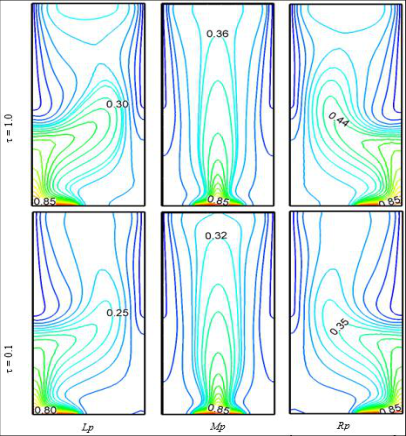 Figure 9
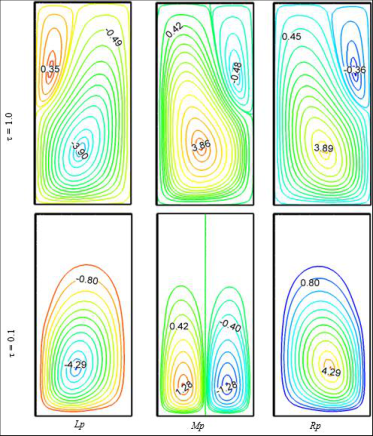 Figure 10
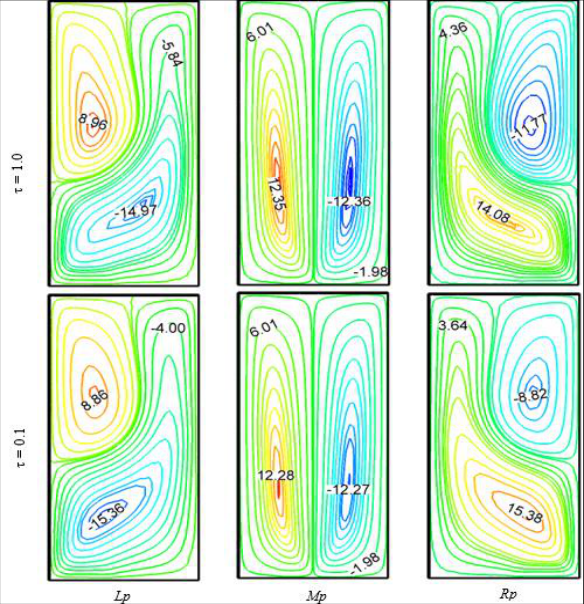 Figure 11
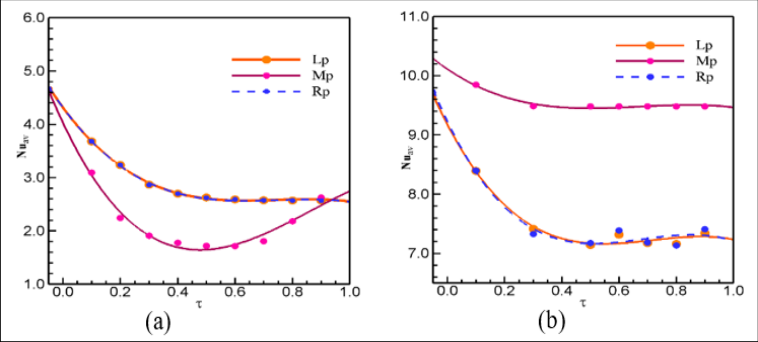 Figure 12
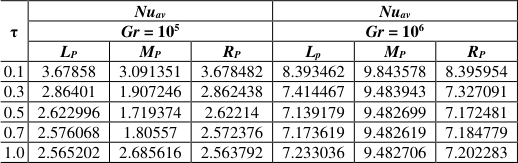 Table 2
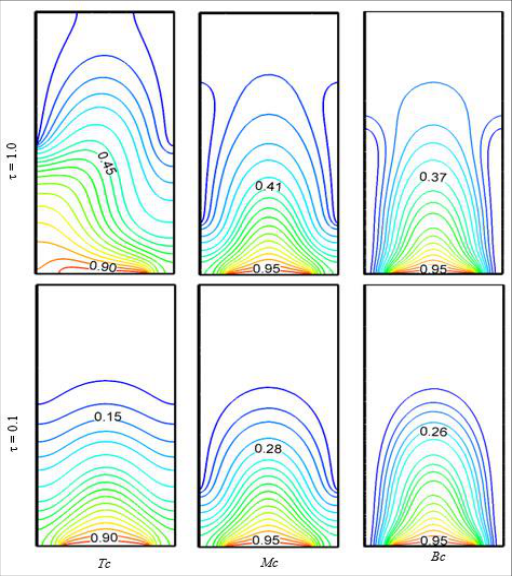 Figure 13
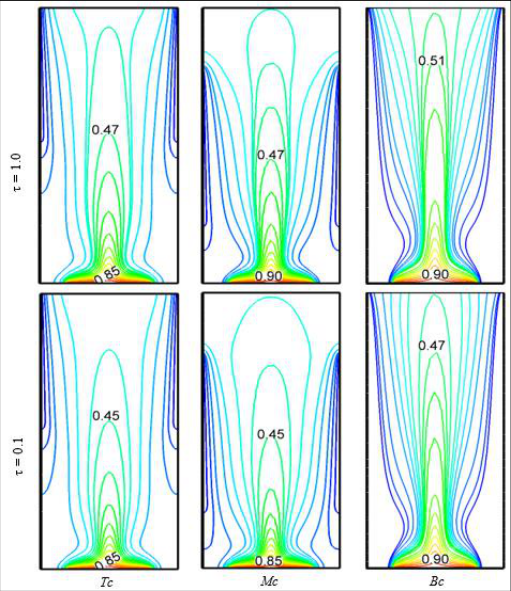 Figure 14
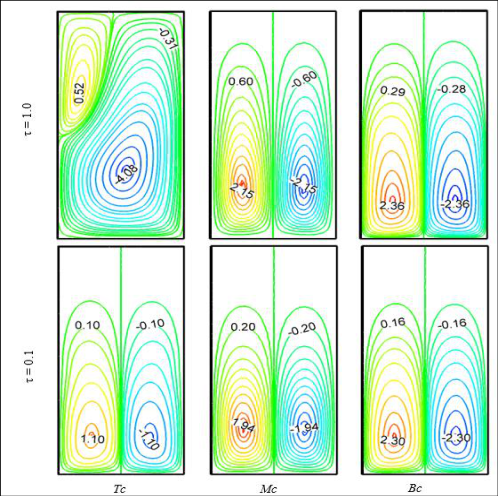 Figure 15
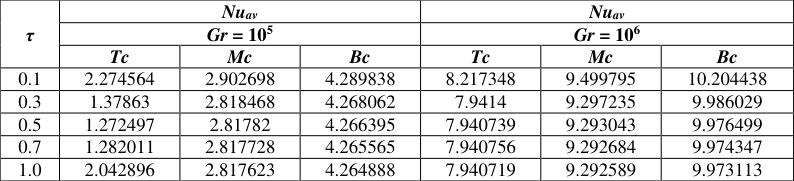 Table 3
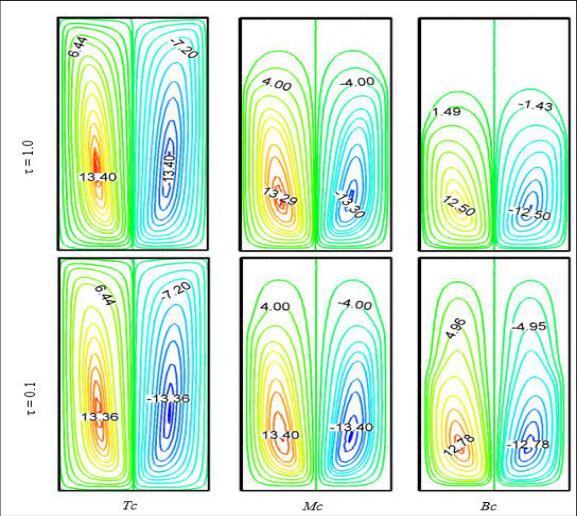 Figure 16
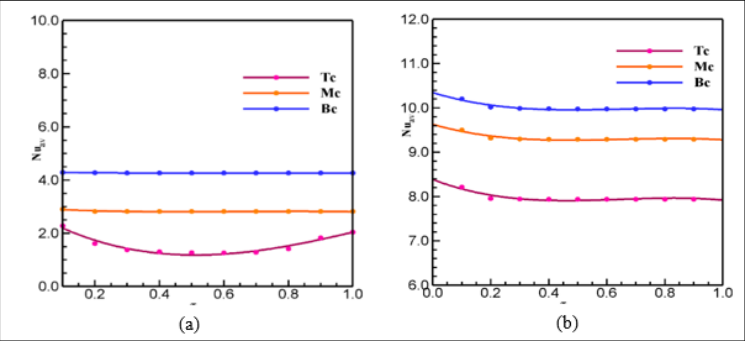 Figure 17
Introduction
Interest in natural convection fluid flow and heat transfer in porous media has been motivated by a large number of technical applications, such as, fluid flow in geothermal reservoirs, separation processes in chemical industries, dispersion of chemical contaminants through water saturated soil, solidification of casting, migration of moisture in grain storage system, crude oil production etc. [1][2][3][4][5][6] . Comprehensive literature survey concerned with this subject is given [1][2][3] . The effects of aspect ratio and different thermal boundary conditions on the natural convection in a rectangular porous cavity have been studied numerically by Bhuvaneswari et al. [4] . Cheikh et al. [5] investigated the natural convection in an air-filled 2D square enclosure heated with a constant source from the bottom and with different configurations of sink on other walls. Mahmud and Faster [6] investigated the magneto hydrodynamic free convection and entropy generation in a square porous cavity. They found that the fluid velocity is reduced with the increase of the value of Hartmann number. Xu and Saha [7] studied the transition to an unsteady flow due to an adiabatic fin on the sidewall of a square cavity. Prasad and Kulacki [8] numerically studied the convection of heat transfer in a rectangular porous enclosure. It is observed from their results that the heat transfer rate increases with the increasing of aspect ratio. Varol et al. [9] numerically studied natural convection flow in a porous rectangular enclosure with a sinusoidaly varying temperature profile on the bottom wall.
They found that the heat transfer increases with the increase of amplitude of the sinusoidal function and decreases with the increase of Aspect ratio. Natural convection of heat transfer in a partially cooled and inclined rectangular porous enclosure have been investigated numerically by Öztop [10] . Author found that the heat transfer increases with the increase of Rayleigh number and this number is the dominant parameter on heat transfer and fluid flow as well as Aspect ratio. The authors Chamkha and Ismael [11] , Khatun et al. [17] investigated the natural convection in differentially heated partially porous layered cavities for nano fluid. Saeid and Pop [12] investigated the natural convection in a square porous cavity with differential isothermal vertical walls and adiabatic horizontal walls. The results show that the effect of the inertia parameter on the fluid circulation in the porous cavity for different values of Rayleigh number. Nithiarasu et al. [13] described computationally the effect of natural convection on heat transfer in a porous cavity of same dimensions of Saeid [1 2]. Rathish and Kumar [14] analyzed numerically the natural convection in a fluid saturated porous trapezoidal enclosure of side wall heating under Darcian / Non-Darcian assumptions. The limitation of the Darcy-Brinkman-Forchheimer extended model are studied in [15] . Based on the above literature review, it appears that a very little work reported on the flow structure and the corresponding heat transfer in a partially heated and cooled porous enclosures. The objective of this present study is to analyse the effects of physical parameter of the structure in the temperature, fluid flow and average heat transfer rate.
Physical Configuration and Mathematical Formulation
Consider a two-dimensional rectangular enclosure of height H and width L filled with fluid saturated porous medium (as shown in Fig. 1). A little portion of the left and right walls of length H/2 of the enclosure is partially cold at a constant low temperature. A little portion of the bottom wall is kept at a constant high temperature. The top wall and the remaining part of the enclosure are assumed to be perfectly insulated. The fluid in the enclosure is incompressible and Newtonian. The gravity acts in the negative ydirection. The porous medium is assumed to be isotropic, homogeneous and in thermodynamic equilibrium with the fluid. In this study, the thermal properties of the fluid are kept constant except the density in the buoyancy term. The density varies linearly with temperature as ρ = ρ 0 [1 -β (θθ 0 )], where β being the coefficient of thermal expansion and subscript 0 denoting the reference state. The Forcheimmer-Brinkman extended Darcy Model has been used to solve the governing equations. According to above-mentioned assumptions, the governing equations for unsteady two-dimensional natural convection flow in a porous enclosure using conservation of mass, momentum and energy can be written with the following dimensionless forms:
where C f = 1.75 √150𝜀 3 2 ⁄ . The parameters C p , g, K, p, t, α, ν, ε and σ are the specific heat, acceleration due to gravity, permeability of the porous medium, pressure, time, thermal diffusivity, kinematic viscosity, porosity of the medium and specific heat ratio, respectively. The transformed initial and boundary conditions for the problem can be written as follows: when τ = 0, for the entire domain: U = V = 0, T = 0; when τ > 0, at the top wall: U = V = 0, ∂T/∂N = 0; At left and right walls: U = V = 0, T = 0 (on the cooling part); and U = V = 0, ∂T/∂N = 0 (on the uncooling part); At the bottom wall: U = V = 0, T = 1 (on the heater); and U = V = 0, ∂T/∂N= 0 (on the unheated part); where N is the non-dimensional distances either along X or Y direction acting normal to the surface. The dimensional quantities appeared in the equations are simplified by the non-dimensional numbers. The nondimensional parameters appeared in the study are the Aspect ratio Ar = H/L, the Grash of number The heat transfer rate across the enclosure is an important parameter in the thermal engineering applications. It is defined by the Nusselt number along the hot wall of the cavity. The average Nusselt numbers at the heating portion of the left wall of the cavity are expressed as
where ℓ ℎ is the length of the heating portion and the non-dimensional stream function is defined as:
Numerical Implementation
The nonlinear governing partial differential equations, i. e, mass, momentum and energy equations are transferred into a system of integral equations by using the Galerkin weighted residual finite element method. Details of the method are described in Zienkiewicz & Taylor [16] . The integration involved in each term of these equations is performed by using Gauss's quadrature method. Newton's method is used to modify the non-linear algebraic equations into linear equations with the help of the boundary conditions. Then finally we use Triangular Factorization method to solve these linear equations.
Code Validation
A comparison of streamlines and isotherms between Bhuvaneswari et al. [4] and present study for Gr = 10 6 , Ar = 3, ε = 0.2 and Da = 10 is presented in Fig. 2. This figure shows that agreement between them is good. In this configuration at both the time τ = 0.1 and 1.0, for aspect ratios (Ar = 1, 2) smooth, symmetrical, parabolic temperature patterns are observed and for Ar = 3, it remains no longer parabolic. For Ar = 1, isothermal line starts to turn back towards horizontal active wall and at τ = 0.1, there was just two thermal lines are not parabolic, which almost parallel to vertical wall and also few more parallel lines exist for τ = 1.0. But this type of thermal line does not exist for other higher aspect ratios. It is seen that for higher value of Ar, most of the isothermal lines turn back towards vertical cold walls at τ = 0.1 and 1.0. On increasing the aspect ratio, the fluid in the upper parts of the enclosure is stagnant due to increasing the space of the enclosure. It may be noted that the heat lines are smooth and symmetric for all Ar and these heat lines disperse near the thermal active wall. The isotherms indicate that the heat is distributed well in the enclosure for all aspect ratios. Figure 4 shows the isotherm contour for different aspect ratios with respect to time τ = 0.1 and τ = 1.0 for Gr = 10 6 . The isothermal lines move from bottom to top along cold boundary confined in the side wall indicating a vigorous convection at τ = 0.1 and at τ = 1.0, the changes of flow patterns are negligible. It is seen from the corresponding isotherms that the large temperature gradient characterizes the region immediately adjacent to the thermally active wall locations while negligible gradients (upper part of the hot/cold wall location) prevail in the rest of the cavity. Almost same pattern is observed for all aspect ratios at Gr = 10 6 . A single thermal line exists which is almost parallel to the vertical wall for higher (Ar = 2,3) at both the time τ = 0.1 to 1.0. On increasing with time, the parallel line moves to upper side of vertical wall. But the line does not exist for low aspect ratio, Ar = 1. Hence, this is clearly seen from the corresponding isotherms that the heat distributions show the different patterns on the shallow cavity and the vertical cavity. Figure 6 displays the streamlines for different values of aspect ratio for Gr = 10 6 . Multiple primary and secondary vortices rotating in opposite directions to each other are formed within the rectangular cavity at τ = 0.1 and 1.0. Clockwise and anti-clockwise flows are shown via negative and positive signs of stream functions is observed for all aspect ratios. On increasing the aspect ratio, the fluid in the upper parts of the enclosure is stationary due to inactive upper zone and flow strength is enlarged at both the time τ = 0.1 and 1.0 due to strong buoyancy effect for higher Gr. It can be realized from figure that the contour value of core region is increased by increasing of Ar with respect to time and also may be seen that contour value of core region is higher at Ar =2 than Ar = 3 due to increasing the height of the cavity. Also, it may be observed from Figures 3 to 6 that the effect of Gr for fixed value of the aspect ratio Ar, with the increase of Gr the heated floor exerts more influence in the flow field along the cavity height and isotherm lines tend to be compressed from the heated wall. When the cavity height increases, higher values of Gr are necessary for the establishment of a thermal line near the cold vertical wall. In the range of lower values of Gr and higher values of Ar, the thermal line is not maintained. As the Grashof number increases, the intensity of convection intensifies within the cavity due to the increase in buoyancy effect which generated by temperature difference. This is evident from the substantial increase in the flow circulation within the cavity at different times. In addition, the heat transfer rate gives minimum value for higher Aspect ratio, Ar = 3 and in particular, it is also observed that the value of average Nusselt number is significantly higher with the increasing the value of Gr due to the enhanced convection for all the cases of Ar. Hence the higher heat transfer rate is obtained at the homogeneous porous medium.
Effect of Heater Position
In many situations, a heat transfer designer prefers to avoid the use of mechanical fans or other active equipment's for fluid circulation, due to power consumption, excessive operating noise or reliability concerns. Hence, the placement of these heaters within the enclosure requires to be optimized so as to maximize the heat removal from the heater to the adjacent fluid. Consequently, in this section, the location of the heater was considered as a parameter and results are exposed in Figures 8-12 Figure 9 illustrates the isotherm contours for different locations of the heater at time τ = 0.1 and 1.0, while ℓ h = 0.4 and Gr = 10 6. It can be seen from the figure that as Gr increases to 10 6 , the nonlinearity in the isotherms become higher and plume-like temperature distribution is observed for all different position with respect to time. Fluid rises from the heater on the bottom wall due to strong buoyancy forces, for the higher value of Gr at both the time τ = 0.1 and 1.0. This is clearly seen from the corresponding isotherms that Lp is a mirror image of Rp at both the time and two or more thermal lines start to develop near the cold walls which are almost parallel to the vertical walls for all positions. The physical reason behind this is that, at the highest Grashof number, natural convection is more effective than that of conduction wall. The isotherms indicate that the heat is distributed well in the enclosure for all different positions.
Effect of Cooling Segment Position
One of the fundamental problems in cooling of electronic devices is the optimal positioning of a distinct heat source in finite modular enclosures. Consequently, in this section, the location of the cooler segment was considered as a parameter and results are exposed in figures 13-17. The isotherms, streamlines and average heat transfer rate inside a partially heated rectangular tall cavity filled with in a porous medium are shown in these figures. Three different Location of cooler segment are chosen as Tc (top-cold), Mc (middle-cold) and Bc (bottom-cold) positions in the vertical walls. In this case, the values of Ar, Pr, ε, Da and ℓ h are fixed at 2, 0.7, 0.5, 10 -3 and 0.6 respectively. While heater is located at the middle position of the bottom wall. Figure 13 shows the isotherm contours for different locations of the cooling portion to the vertical walls at time τ = 0.1 and 1.0, while ℓ h = 0. Figure 14 illustrates the isotherm contours for different locations of cooling portion at time τ = 0.1 and 1.0, while ℓ h = 0.6 and Gr =10 6 . It can be seen from the figure that as Gr increases to 10 6 , the nonlinearity in the isotherms becomes higher and plume-like temperature distribution is observed for all different positions with respect to time. Fluid rises from the heater on the bottom wall due to strong buoyancy forces, for higher values of Gr. This is clearly seen from the corresponding isotherms that two or more thermal lines are starts to develop near the cold for position Tc and Mc at both time τ = 0.1 and 1.0. But in the position Bc, no line remains along cold bottom walls with time due to inactive upper part of the domain at both time τ = 0.1 and 1.0. The physical reason behind this is that, at the highest Grashof number, natural convection is more effective than that of conduction wall. The isotherms specify that the heat is dispersed well in the enclosure for all different cooler positions. Figure 16 describes the streamline contours for different locations of cooling portion at time τ = 0.1 and 1.0, while ℓ h = 0.6 and Gr = 10 6 . It can be seen from the figure that for the higher Gr, two counter rotating cells are detected for all different positions at both time τ = 0.1 and 1.0. The pattern of the circulation cells is almost similar for all different locations of cooling portion as stated earlier. In the position Tc flow circulation is higher at both time τ = 0.1 and 1.0. When cooling section moves from top to bottom of the side walls, it is observed that flow circulation reduces and the contour value of the core region is also decrease. However, with the increasing of Grashof number, Gr natural convection becomes dominant; as a result, flow velocity increases and the circle shaped circulation cell becomes an elliptic shape for the different locations of cooling portion as considered. Finally, for the higher values of Gr to 10 6 there is a strong effect of buoyancy force in the flow field with respect to time.
Conclusions
A computational work has been done using finite element method to investigate the unsteady natural convection flow and heat transfer in a rectangular porous enclosure with partially active thermal walls.
The following main concluding remarks are drawn from the present study: a) The results of the numerical study carried out using the mathematical model and solution procedure proposed in this paper is fairly well when compared to the results of the benchmark case given in the literature. b) The influence of cavity aspect ratio on fluid flow and temperature field is found to be pronounced. The heat transfer rate for higher cavity aspect ratio is lower than for lower aspect ratio. c) The position of thermally active wall is a significant parameter of porous medium. The heat transfer rate for middle-position (Mp) is the best combination than other positions. d) The value of average Nusselt number increases steadily with time for the position of cooler section is from Tc to Bc respectively for all considered Gr. e) Heat transfer is increased with the increasing the Grashof number and higher fluid temperature is found for the highest value of the Grashof number.
Acknowledgement
AcknowledgementsThe authors wish to acknowledge the technical support provided by the Department of Mathematics, Bangladesh University of Engineering and Technology (BUET), Dhaka-1000, Bangladesh.
Figures and tables from the paper
| τ | Nuav | — | — | Nuav | — | — |
|---|---|---|---|---|---|---|
| Gr = 105 | Gr = 106 | |||||
| Ar = 1 | Ar = 2 | Ar = 3 | Ar = 1 | Ar = 2 | Ar = 3 | |
| 0.1 | 4.334527 | 3.374132 | 3.155021 | 9.668892 | 9.505738 | 8.454741 |
| 0.3 | 4.277792 | 2.919846 | 1.962343 | 9.628444 | 9.244618 | 8.066341 |
| 0.5 | 4.277285 | 2.909911 | 1.744317 | 9.628364 | 9.239076 | 8.03856 |
| 0.7 | 4.27696 | 2.909074 | 1.701886 | 9.628375 | 9.238825 | 8.034076 |
| 1.0 | 4.277379 | 2.908949 | 1.798237 | 9.62831 | 9.238886 | 8.0322 |
Table text extracted from the original PDF; superscript letters are shown inline. The original table image is below.
View original table image
| τ | Nuav | — | — | Nuav | — | — |
|---|---|---|---|---|---|---|
| Gr = 105 | Gr = 106 | |||||
| LP | MP | RP | Lp | MP | RP | |
| 0.1 | 3.67858 | 3.091351 | 3.678482 | 8.393462 | 9.843578 | 8.395954 |
| 0.3 | 2.86401 | 1.907246 | 2.862438 | 7.414467 | 9.483943 | 7.327091 |
| 0.5 | 2.622996 | 1.719374 | 2.62214 | 7.139179 | 9.482699 | 7.172481 |
| 0.7 | 2.576068 | 1.80557 | 2.572376 | 7.173619 | 9.482619 | 7.184779 |
| 1.0 | 2.565202 | 2.685616 | 2.563792 | 7.233036 | 9.482706 | 7.202283 |
Table text extracted from the original PDF; superscript letters are shown inline. The original table image is below.
View original table image
| τ | Nuav | — | — | Nuav | — | — |
|---|---|---|---|---|---|---|
| Gr = 105 | Gr = 106 | |||||
| Tc | Mc | Bc | Tc | Mc | Bc | |
| 0.1 | 2.274564 | 2.902698 | 4.289838 | 8.217348 | 9.499795 | 10.204438 |
| 0.3 | 1.37863 | 2.818468 | 4.268062 | 7.9414 | 9.297235 | 9.986029 |
| 0.5 | 1.272497 | 2.81782 | 4.266395 | 7.940739 | 9.293043 | 9.976499 |
| 0.7 | 1.282011 | 2.817728 | 4.265565 | 7.940756 | 9.292684 | 9.974347 |
| 1.0 | 2.042896 | 2.817623 | 4.264888 | 7.940719 | 9.292589 | 9.973113 |
Table text extracted from the original PDF; superscript letters are shown inline. The original table image is below.
View original table image
References
17 in the original paper- Nield DA, Bejan A. Convection in porous media, 4 th Edition, Springer Science and Business Media, New York, 2013, 778,
- Vafai K. Handbook of porous media, 2 nd Edition, Taylor & Francis, New York, 2005.
- Md. Fayz-Al-Asad, Jahirul Haque Munshi M, Rajib Kumar Bhowmik, Sarker MMA. MHD free convection heat transfer having vertical fin in a square wavy cavity, Int. J. Stat. Appl. Math, 2019; 4(3):32-38,
- Bhuvaneswari M, Sivasankaran S, Kim YJ. Effect of aspect ratio on convection in a porous enclosure with partially active thermal walls, Computers and Mathematics with Applications. 2011; 62:3844-3856.
- Cheikh NB, Beya BB, Lili T. Influence of thermal boundary conditions on natural convection in a square enclosure partially heated from below, Int. Comm. Heat Mass Transfer, 2007; 34:369-379,
- Mahmud S, Fraser RA. Magneto hydrodynamic free convection and entropy generation in a square porous cavity, Int. J Heat and Mass Transfer, 2004; 47:3245-3256,
- Xu F, Saha SC. Transition to an unsteady flow induced by a fin on the sidewall of a differentially heated air-filled square cavity and heat transfer, Int. J. Heat and Mass Transfer, 2014; 71:236-244,
- Prasad V, Kulacki FA. Connective heat transfer in a rectangular porous cavity -Effect of aspect ratio on flow structure and heat transfer, J. Heat Transfer, 1984; 106:158-165,
- Varol Y, Öztop HF, Pop I. Numerical analysis of natural convection for a porous rectangular enclosure with sinusoidal, varying temperature profile on the bottom wall, Int. Comm. Heat Mass Transfer, 2008; 35:56-64,
- Öztop HF. Natural convection in partially cooled and inclined porous rectangular enclosures, Int. J. Therm. Sci. 2007; 46:149-156,
- Chamkha J, Ismael MA. Natural convection in differentially heated partially porous layered cavities filled with a nanofluid, Numer. Heat Transf. A Appl. vol. 2014; 65(11):113-1089,
- Saied NH, Pop I. Non-Darcy natural convection in a square cavity filled with a porous media, Fluid Dynamics Research. 2005; 36:35-43,
- Nithiarasu P, Seetharamu KN, Sundararajan T. Numerical investigation of buoyancy driven flow in a fluid saturated nonDarcian porous medium, Int. J. Heat and Mass Transfer, 1999; 42:1205-1215,
- Rathish Kumar BV, Kumar B. Parallel computation of natural convection in trapezoidal porous enclosures, Mathematics and Computers in Simulation. 2004; 65:221-229,
- Vafai K, Kim SJ. On the limitations of Brinkman-Forchheimer-extended Darcy equation, Int. J. Heat Fluid Flow. 1995; 16:11-15.
- Zienkiewicz OC, Taylor RL. The finite element method Solid and Structural Mechanics, Sixth Ed., McGraw-Hill, 2005.
- Khatun A, Rahman M, Alam S. Heat Transfer Characteristics of Nanofluid Due to a Permeable Rotating Disk with Slip Effect and Thermophoresis, Science & Technology Asia. 2019; 24(1):1-13,