
Research article · 2018 · Full text
International Journal of Statistics and Applied MathematicsForecasting of mobile phone services subscription in a saturating market
Volume 3(4) · Pages 184–189
Research areasInnovation Diffusion and ForecastingCOVID-19 Pandemic ImpactsEconomic Growth and Development
Abstract
Author-writtenThe aim of this paper is to make a short-term forecast for the growth of mobile phone subscribers in India. Using data of mobile phone subscribers from the year 1995 to 2016, a forecast was performed for four years (2020). Gompertz distribution function was used in this forecasting. The Gompertz distribution function is a type of mathematical model for a time series, where growth is slowest at the start and end of a time period. In case of mobile phone subscription, the assumption is made that the growth is slow at the beginning and it becomes saturated towards the end when most of the population has already subscribed to the services. The result of this study suggests that by the year 2020, India will reach a density of 94 subscribers per 100 population.
Summary
Source-checkedPlain-language reading of the full paper, prepared with AI and checked against the text. Each point links to the authors' own words.
Why it matters
- Mobile phone services in India transitioned from being a luxury in the mid-1990s to becoming widely accessible and inexpensive. View evidence ↗
- By 2016, the mobile phone subscriber base in India had exceeded 1 billion users. View evidence ↗
- The Diffusion of Innovation Theory suggests that technological adoption occurs gradually across a social system rather than all at once. View evidence ↗
The question
- The study aims to analyze the density of mobile subscribers in India and forecast their future growth. View evidence ↗
What they did
- The researchers used mobile subscriber data from 1995 to 2016 to create a forecast extending to the year 2020. View evidence ↗
- The Gompertz distribution function was selected as the mathematical model for the time series forecasting. View evidence ↗
- The parameters for the model were estimated using the ordinary least square method. View evidence ↗
- Statistical analysis was performed using R version 3.4.0 with the 'drc' and 'ggplot2' packages. View evidence ↗
What they found
- The Gompertz model demonstrated a better fit for the subscriber data compared to a standard regression model. View evidence ↗
- The study forecasts that by 2020, India will reach a mobile subscriber density of 94 per 100 people. View evidence ↗
- For the year 2020, the actual forecast for total mobile phone subscribers is 1,310,202,003, with a pessimistic lower bound of 1,287,520,683 and an optimistic upper bound of 1,331,763,253. View evidence ↗
What it means
- The authors conclude that the Gompertz model is a reliable tool for forecasting mobile phone subscribers in the near future due to its high R² and low MSE. View evidence ↗
- The authors recommend that telecom companies and hardware manufacturers use these forecasts to redesign their operational and growth strategies in India. View evidence ↗
- The authors state that future research could be extended to analyze growth across different segments, such as rural versus urban or different income levels. View evidence ↗
Visual summary
2 visualsIllustrations explain the paper; charts are replotted from the paper's own table values.

S-Curve Growth Concept
AI-generated conceptual illustration (mobile phone handsets). It explains the idea and does not show study data.
View source evidence ↗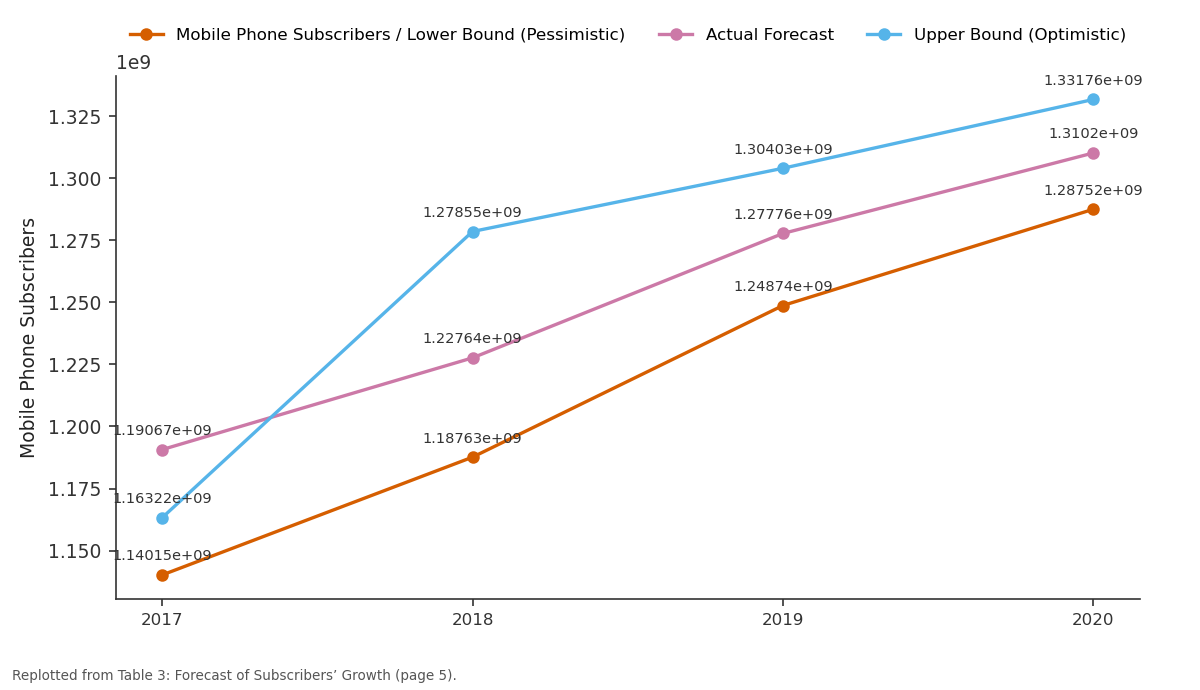
Mobile Phone Subscribers / Lower Bound... and Actual Forecast and more: 2017 vs 2018 vs 2019 vs 2020
Replotted from Table 3 (page 5) of the original paper. Every bar is the paper's own table value.
View source evidence ↗Figures & tables
From the original paper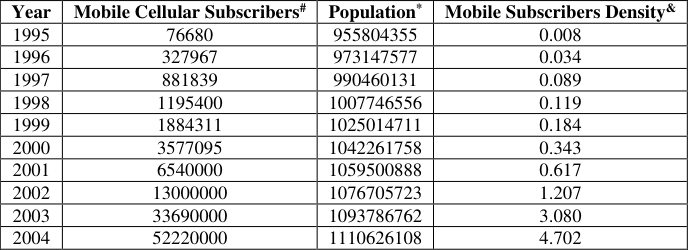 Table 1
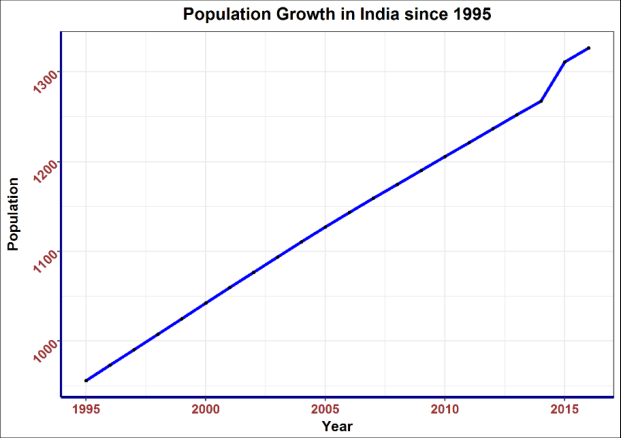 Figure 1
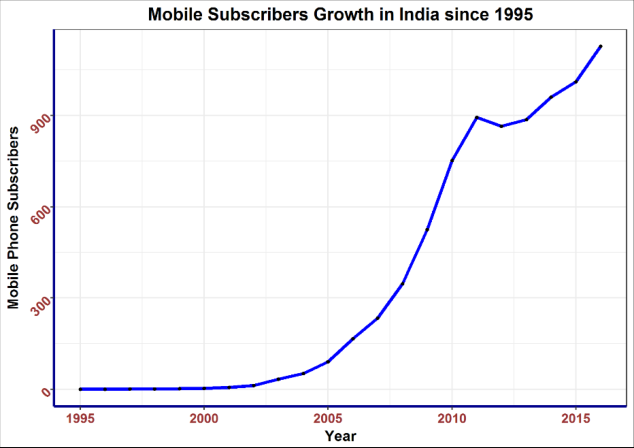 Figure 2
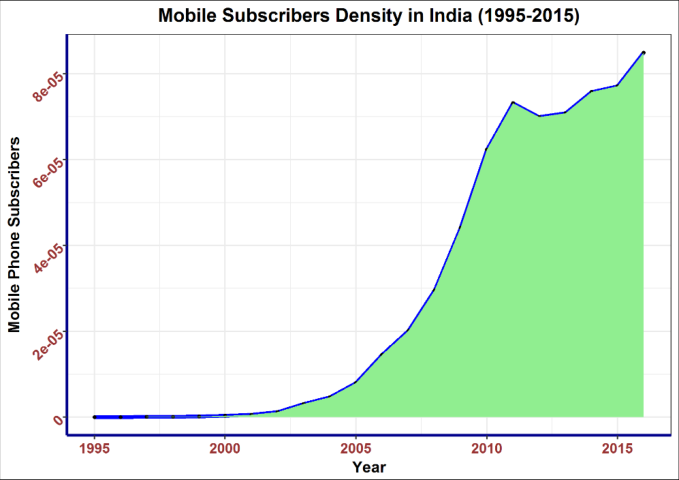 Figure 3
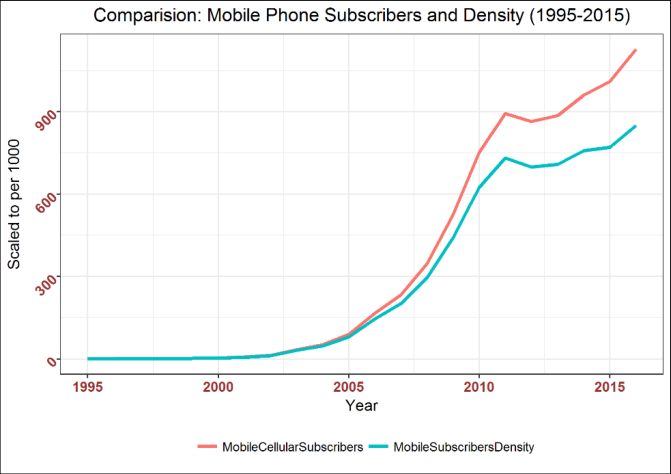 Figure 4
 Table 2
 Table 3
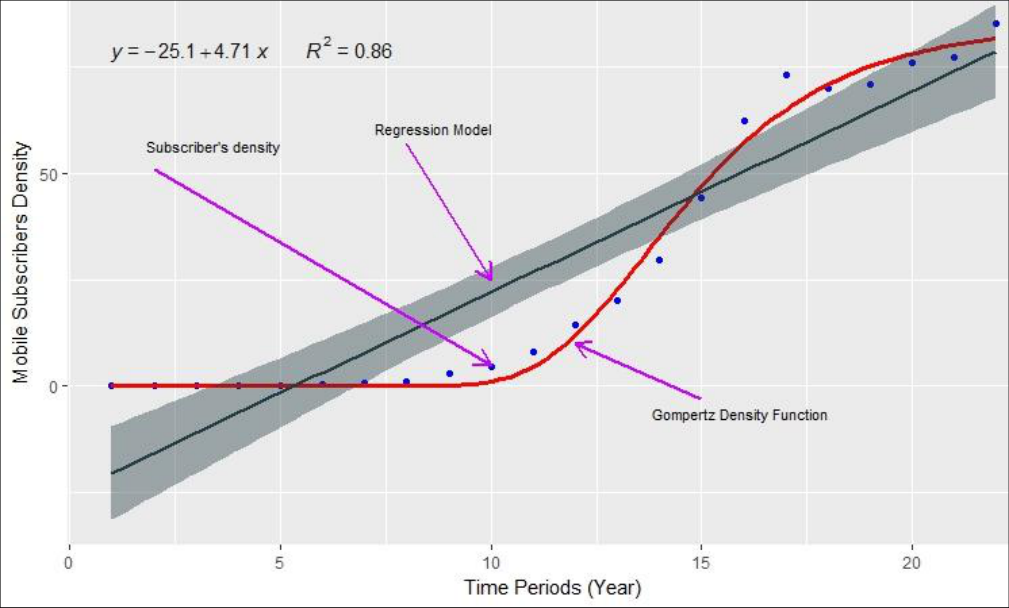 Figure 5
Introduction
Today, the mobile phones are no more a luxury as they used to be way back in mid 1990s when wireless communications system such as mobile phones started as services in India. In the beginning of wireless communications services on offer, the mobile phones were not common, the devices (mobile phones) were expensive and cost of services were very high. But over the period of time, the users of mobile services increased and this factor helped organization to overcome operational expenses leading to further decrease in cost of services, passing benefits to consumers and hence cheaper services available for everyone in the country. Today, mobile phones are smart, feature rich, inexpensive, easy to use and cost of maintaining these services are one of the cheapest in the world. The growth of mobile phone service subscribers and its usage is expanding rapidly in the country. In a 2016 report by TRAI, India's telecom regulator, it stated that mobile phone subscriber base crossed the 1 billion users mark (Trak.in & TRAI, 2017) [13] . According to Diffusion of Innovation Theory (Rogers, 2003) [10] , technological innovations are not adopted by all individuals in a social system at the same time. In mobile service case, the initial services being expensive, were not adopted by everyone, but as the users grow, these services become affordable due to price reduction and growth picks up until it reached to almost everyone leading to a saturation level in the business. Keeping this in mind, the objectives of this research are to explore the density of mobile subscribers in the country and to forecast the growth of mobile phone subscribers. For forecasting we will use Gompertz Density Function (Gompertz, 1825) [5] which also takes care of diffusion theory.
Literature Review
The sigmoid models are very often used in technological change and in general, economic growth and diffusion studies. An early use of such models to analyse the economic growth can be observed in the research work of French sociologist Tarde (Tarde, 1903) [11] . Following Tarde's idea, Mansfield (1961) [7] explained the observed patterns of diffusion in terms of the expected profitability of the innovation, and the dissemination of information about its technical and economic characteristics. Christian (2012) [3] in his research explored necessity and penetration rate of 3G service in India, Mexico and Thailand by using the Gompertz curve model. He examined the drivers behind 3G diffusion using linear probability models and qualitative choice (logit) analysis and concluded that time series diffusion patterns follow an s-curve pattern, favouring the Gompertz curve. Ahmad et al. (2014) [1] in their study examined different models to estimate the drivers for the growth of mobile phone subscribers in Oman. The growth rates were estimated by fitting four statistical models namely, Logistic, Gompertz, Exponential and Autoregressive model. They assessed the forecasting performance of these models using Mean Absolute Deviation (MAD) and Mean Square Error. Finally, they concluded that based on the criterion for assessment of the model using the minimum forecast error, the Gompertz model outperformed the other models. In another research, Das (2013) [4] forecasted the maximum possible GSM subscriber base to 760 million but beyond the year 2020, which in fact crossed 1 billion-mark in 2017 (Trak. in, 2017) [13] . This conflict in forecasting naturally leads us to investigate the use of statistical tests that require simple estimation and easy computation. We will model the growth of mobile services in India using diffusion framework, mode specifically Gompertz Diffusion Function, while incorporating other variables that might impact growth and make a forecast in short term. In a manner conforming to diffusion theory and plethora of research findings, it is hypothesized that the number of mobile phone subscribers in India would grow slowly initially and saturates later when density of subscribers reaches towards 100 percent hence forming a S-shaped curve. This phenomenon can be described using Gompertz Density Function (sometimes also known as Gompertz Curve or Gompertz Function, named after Benjamin Gompertz, is a sigmoid function). The right-hand (also known as future value) asymptote of the function is approached much more gradually by the curve than the left-hand (or lower valued) asymptote. This is typically in contrast to the simple logistic function in which both asymptotes are approached by the curve symmetrically. The univariate analysis like ARIMA (Kumar & Sharma, 2016) [6] could also be exploited to make a similar forecast but that would conflict the basic scenario where growth during initial years are slow (one reason behind it poor infrastructure and high cost of operations), then rises exponentially as infrastructure improves and cost of operations falls but later sustainability (of that business growth) becomes a challenge as saturation phase arrives (where all the consumers are brought into its services with diminishing potentials of adding more customers to the base).
Gompertz Density Function
Benjamin Gompertz (1825) [5] , in his research and published a paper in the Philosophical Transactions of the Royal Society, "On the Nature of the Function Expressive of the Law of Human Mortality," showed that "if the average exhaustions of a man's power to avoid death were such that at the end of equal infinitely small intervals of time, he lost equal portions of his remaining power to oppose destruction," then the number of survivors at any age 'x' would be given by the equation 1 below:
For any historical time series period't' [t > 0] and given Y t as variable of interest, the relative increase in Y t is obtained by the equation 2 below:
And if Y t is a time series taking nonnegative values, the Gompertz diffusion curve for Y t is given by:
Here α, β, γ > 0 i.e. the parameters α, β and γ are all positive and upper limit of the growth curve is controlled by parameter 'α' [0% < α ≤ 100%]. The 'β' [0 < β ≤ 1] sets the displacement along the x-axis, 'γ' [0 < γ ≤ 1] sets the growth rate (i.e. y scaling) and 'e' is Euler's number (i.e. 'e' = 2.71828….), as presented by Charles P. Winsor [13] .
Data and Sources
Below shown in table 1 is the data of yearly total Mobile Subscribers sourced from Telecom Regulatory Authority of India (TRAI), Cellular Operators Association of India (COAI, 2017) [2] , and online from Track. In. The yearly total population data is sourced from World Bank (2017) [16] and Worldometers.info (2017) [17] . The density of mobile subscribers is calculated for per 100 people in India. From raw data above, below in Figure 1, we have a plot for the yearly population growth in India between 1995 and 2016.
| Year | Mobile Cellular Subscribers# | Population* | Mobile Subscribers Density& |
|---|---|---|---|
| 1995 | 76680 | 955804355 | 0.008 |
| 1996 | 327967 | 973147577 | 0.034 |
| 1997 | 881839 | 990460131 | 0.089 |
| 1998 | 1195400 | 1007746556 | 0.119 |
| 1999 | 1884311 | 1025014711 | 0.184 |
| 2000 | 3577095 | 1042261758 | 0.343 |
| 2001 | 6540000 | 1059500888 | 0.617 |
| 2002 | 13000000 | 1076705723 | 1.207 |
| 2003 | 33690000 | 1093786762 | 3.080 |
| 2004 | 52220000 | 1110626108 | 4.702 |
Table text extracted from the original PDF; superscript letters are shown inline. The original table image is below.
View original table image
Clearly, we can see that the population is growing at almost a constant rate (about 1.5-2% Year on Year) with some small spike near year 2014-15 and later returning to same average in rest of the recent years. Clearly, we see that there has been a slow growth in the numbers during initial phase of service offerings and then it followed sharp rise towards the mid years and slowing growth in most recent years. These most recent years could be seen as the beginning towards saturated growth. This shows up that the trend is taking a turn towards slowing down growth. Let us further explore the trend using density of subscribers between the periods. Below Figure 3 represents the same: Although trend still not tending towards saturation, the plot suggests that it will move towards saturation in coming years. Also, because population growth, as we saw earlier, in all these years were almost constant, the density almost follows the subscribers growth trend.
Modelling the Data Y t is the density of mobile phone subscribers per 100 persons at time't' (year). Here't' is taken as 0 for 1995 (the year when mobile services started in India), 1 for 1996, 2 for 1997, and so forth. In our case since density varies between 0 and 100, the parameter 'α' takes a max value of 100 (at saturation). The Gompertz density function, as in equation ( 3) above, reaches its maximum penetration rate at Y t = α/e which is the point of inflection of the curve that occurs at t = ln (β)/γ.
When t = 0, Y t = αe -β is the starting point of mobile phone subscribers density and when't' is large (end of the time series), Y t = α, i.e. Y t reaches towards saturation. Using saturation parameter 'α', time variable 't' and ordinary least square method, the parameters 'β' and 'γ' are estimated. The open source statistical computational tool 'R' (version 3.4.0), Packages 'drc' (Ritz et al. 2015, 2016) [8,9] and gg Figure 2 (Wickham, 2009) [14] were used for statistical analysis.
Below table 2 shows the result obtained from data modeling: These parameters, as obtained in the table 2 above, are used to fit the model on original data. Below Figure 5 shows the original data series of subscribers' density, the fitted regression model and the fitted Gompertz Model: We can observe that the Gompertz model fits well on the data as compare to regression model. Using the above parameters, we will make a prediction for future growth using Gompertz function. This prediction (and estimation) of future growth of mobile phone subscriptions in India might help researchers and policy makers in estimating the remaining untapped market of mobile services in India. Table 3 below shows the forecasting of growth in population as well as for subscribers in India for the four years in future (i.e. 2017 through 2020) along with 95% confidence interval bounds:
| Year | Population | Density | Mobile Phone Subscribers | — | — |
|---|---|---|---|---|---|
| Lower Bound (Pessimistic) | Actual Forecast | Upper Bound (Optimistic) | |||
| 2017 | 1344468110 | 88.56089 | 1140151711 | 1190672924 | 1163215121 |
| 2018 | 1362134645 | 90.12635 | 1187630895 | 1227642238 | 1278550658 |
| 2019 | 1379801179 | 92.60495 | 1248738418 | 1277764192 | 1304032019 |
| 2020 | 1397467713 | 93.75544 | 1287520683 | 1310202003 | 1331763253 |
Table text extracted from the original PDF; superscript letters are shown inline. The original table image is below.
View original table image
Conclusion
In this research, we studied the growth of mobile phone subscriptions in India and we observed that the growth followed an Scurve (precisely, Gompertz function). The growth during the first decade of inception of services (i.e. from year 1995 to 2003) was almost constant but during mid-years (i.e. 2004-2011), it was exponentially high and during later years (i.e. 2011 to 2016), the growth approximately started approaching the saturation (or slowing growth) phase. Using annual data of mobile phone subscribers since inception of services in India (year 1995) to 2016, the parameters of the Gompertz function were estimated using ordinary least squares methodology. These parameters were found statistically significant under the assumed saturation levels. The R 2 value and lower mean squared error (MSE) suggest that model can be assumed to be a good fit for forecasting of mobile phone subscribers in near future.
Using the obtained parameter, we then made four periods ahead forecast of population, subscribers' density and phone subscribers. We observed that almost 84 subscriptions of mobile services per 100 persons in 2015 further rises to 93 subscriptions per 100 persons by 2020 (as forecasted) and forecast suggests that the subscribers' density (or total phone subscribers) will be flatten out further (i.e. move towards more saturation) in four years. This study and forecast for density growth would serve as one of the supporting references to help the telecom services providing companies, mobile handset manufacturers and other related accessories suppliers to re-design their operational and growth strategies in India. However, this research can further be extended to divide the growth between various segments such as rural and urban populations, low, medium and high-income populations etc. where there could be some significant differences in the growth.
Figures and tables from the paper
References
16 in the original paper- Ahmad MI, Alsaadi MK, Almamri A. Statistical Models for Mobile Telephony Growth in Oman. Information Management and Business Review. 2014; 6(3):121-127.
- Christian MD. Is Faster Necessarily Better? 3G Take-Up Rates and the Implications for Next Generation Services. International Journal of Communications Network and System Sciences. 2012; 5(8):463-480. DOI:10.4236/ijcns.2012.58057.
- Das PK. Nonlinear Statistical Model and its Applications to Diffusion of Mobile Telephony in India. Annals of Pure and Applied Mathematics. 2013; 5(1):64-70.
- Gompertz Benjamin. On the Nature of the Function Expressive of the Law of Human Mortality, and on a New Method of Determining the Value of Life Contingencies. Philosophical Transactions of the Royal Society, 1825, 513-585.
- Kumar M, Sharma S. Forecasting tourist in-flow in South East Asia: A case of Singapore. Tourism & Management Studies. 2016; 12(1):107-119.
- Mansfield E. Technical change and the rate of imitation. Econometrica. 1961; 29:741-766.
- Ritz C, Baty F, Streibig JC, Gerhard D. Dose-Response Analysis Using R. Plos One. 2015; 10(12):e014-6021.
- Ritz C, Strebig JC. Analysis of Dose-Response Curves. Package 'drc': CRAN, 2016. (www.R-project.org)
- Rogers EM. Diffusion of innovations. New York: Free Press, 2003.
- Tarde G. The Laws of Imitation. USA: Henry Holt & Co, 1903.
- Telephone Regulatory Authority of India, 2017. Annual Reports: www.trai.gov.in/
- Trak. In Indian Telecom Stats: 1 Billion Mobile Subscriber Base Reached, Active Base Cross 902M, 2017. (www.track.in)
- Wickham H. gg Figure 2: Elegant Graphics for Data Analysis. New York: Springer-Verlag, 2009.
- Winsor CP. The Gompertz Curve as a Growth Curve. Proceedings of the National Academy of Sciences. 1932; 18(1):1-8.
- World Bank. Total Population, India, 2017. http://data.worldbank.org/indicator/SP.POP.TOTL
- Worldometers. Population of India, 2017. http://www.worldometers.info/world-population/india-population/