
Research article · 2018 · Full text
International Journal of Statistics and Applied MathematicsPerformance evaluation of district central co-operative banks in India: A data envelopment analysis
Volume 3(2) · Pages 251–254
Research areasEfficiency Analysis Using DEA
Abstract
Author-writtenCooperative banks play an important role in the Indian banking system. In this paper, Data Envelopment Analysis (DEA) model is applied to evaluate the efficiency of District Central Cooperative Banks (DCCB) in India. DEA is a mathematical modeling technique used to evaluate the relative efficiency of Decision making units (DMUs). We considered each DCCB as a Decision making unit. Nineteen DCCB functioning in India are taken into an account for the analysis. Banker Charnes Cooper (BCC) Output - oriented model allowing variable returns to scale (VRS) is applied. It is found that Karnataka DCCB is inefficient compared to its peers. The projection analysis is carried out for this DMU and it reveals that it has to make improvement into output.
Summary
Source-checkedPlain-language reading of the full paper, prepared with AI and checked against the text. Each point links to the authors' own words.
Why it matters
- Cooperative banks are a significant component of the banking system in India. View evidence ↗
- These banks are considered an integral part of the current Indian money market. View evidence ↗
- While Data Envelopment Analysis (DEA) is used globally for banking efficiency, there is limited empirical research applying it in India. View evidence ↗
The question
- The study aims to evaluate the relative efficiency of District Central Cooperative Banks (DCCB) in India using a DEA model. View evidence ↗
What they did
- The researchers used an output-oriented Banker Charnes Cooper (BCC) model that allows for variable returns to scale (VRS). View evidence ↗
- The model evaluated efficiency based on six inputs (offices, employees, paid-up capital, deposits, management cost, and working capital) and three outputs (investments, loans & advances, and the C/D ratio). View evidence ↗
- Data was sourced from the National Federation of State Cooperative Banks Ltd for the 2011-2012 period. View evidence ↗
What they found
- The Karnataka DCCB was identified as the inefficient unit relative to its peer banks. View evidence ↗
- To reach efficiency, the Karnataka bank would need to increase its outputs by 0.7% using its current level of inputs. View evidence ↗
- Projection analysis suggests that for the 596 banks in Karnataka, a reduction of 81 banks via slack movements is needed to reach an optimum level. View evidence ↗
What it means
- The authors conclude that Karnataka can improve efficiency by benchmarking its inputs and outputs against a reference set of peer banks. View evidence ↗
- The authors recommend that Karnataka maximize its first output using both radial and slack movements, and its second and third outputs using radial movement only. View evidence ↗
Visual summary
2 visualsIllustrations explain the paper; charts are replotted from the paper's own table values.
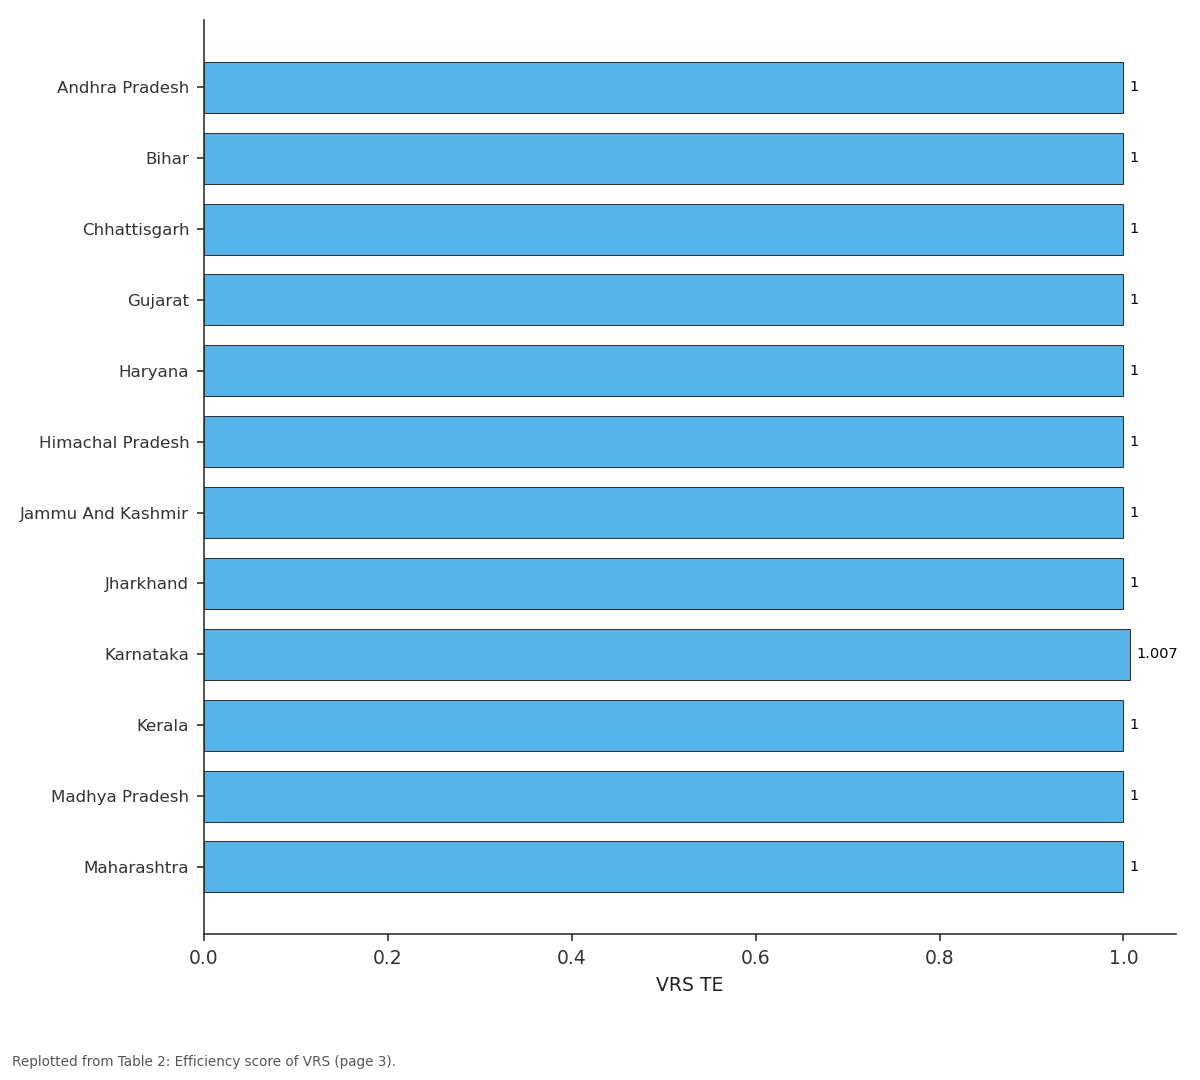
VRS TE: Andhra Pradesh vs Bihar vs Chhattisgarh vs Gujarat vs Haryana
Replotted from Table 2 (page 3) of the original paper. Every bar is the paper's own table value.
View source evidence ↗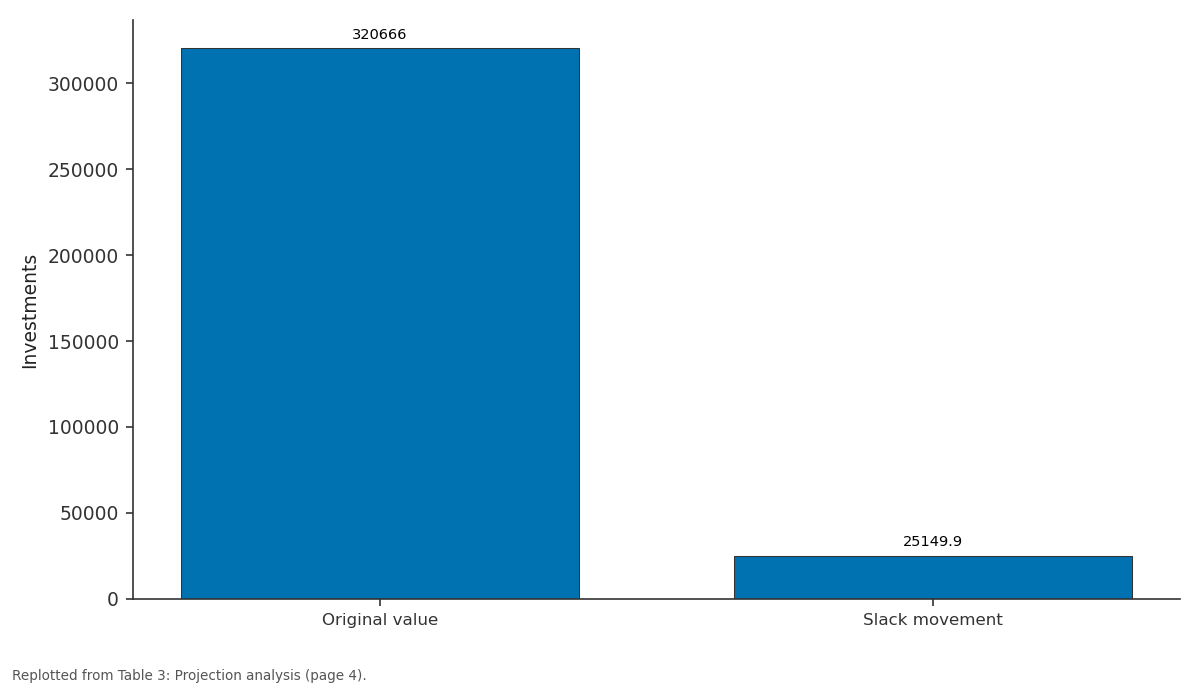
Investments: Original value vs Slack movement
Replotted from Table 3 (page 4) of the original paper. Every bar is the paper's own table value.
View source evidence ↗Figures & tables
From the original paper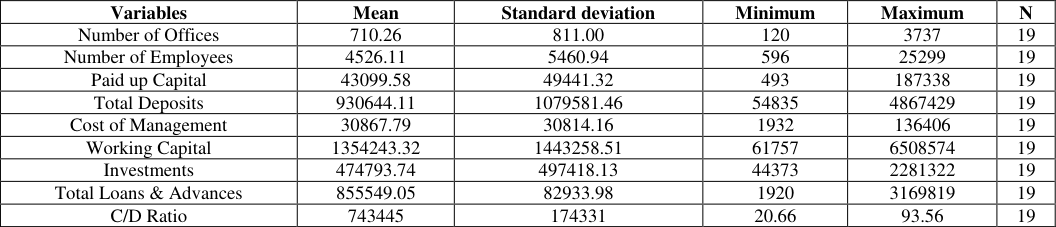 Table 2
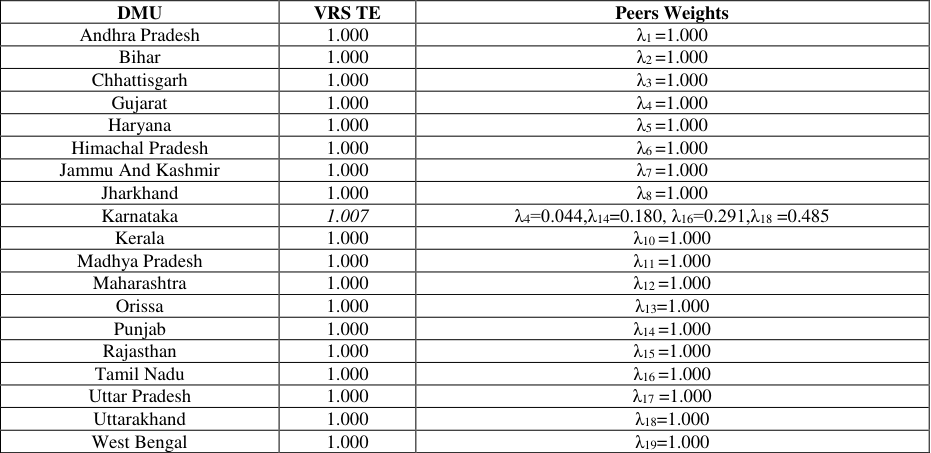 Table 2
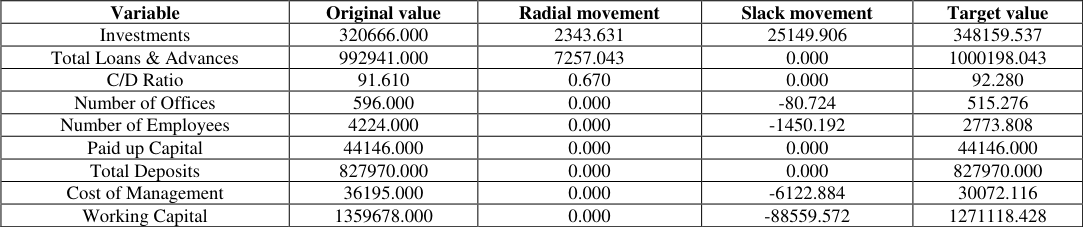 Table 3
Introduction
A cooperative bank is a financial entity that belongs to its members, who are owners and customers of their own bank. Cooperative banks are often created by persons belonging to the same local or professional community or sharing a common interest. Cooperative banks generally provide their members with a wide range of banking and financial services (loans, deposits, banking accounts etc.). Cooperative banks differ from stockholder banks by their organization, goals, values and governance. In most countries, they are supervised and controlled by banking authorities and have to respect prudential banking regulations, which put them at a level playing field with stockholder banks. Depending on countries, this control and supervision can be implemented directly by state entities or delegated to a cooperative federation or central body. Cooperative banking is retail and commercial banking organized on a cooperative basis. The central cooperative banks are located at the district headquarters or some prominent town of the district. For the cooperative banks in India, cooperatives are organized groups of people and jointly managed and democratically controlled enterprises. They exist to serve their members and depositors and produce better benefits and services for them. Cooperative banks have completed 100 years of existence in India. They play a very important role in the financial system. The cooperative banks in India form an integral part of our money market today. The cooperative banking structure is a three tier federal one and it include A State Cooperative Bank works at the apex level The Central Cooperative Bank works at the Intermediate Level. Primary Cooperative credit societies at base level DCCB's are the federations of primary credit societies in a district and are of two types those having a membership of primary societies only and those having a membership of societies as well as individuals. The funds of the bank consist of share capital, deposits, loans and overdrafts from state cooperative banks and joint stocks. These banks provide finance to member societies within the limits of the borrowing capacity of societies. They also conduct all the business of a joint stock bank.
All over the world, number of studies has applied DEA to the question of efficiency in commercial banking but very little empirical research can be observed in India. The authors are the opinion that only a limited number of studies has been carried out with using modeling approach. This has been motivated the authors to study the efficient DCCB.
Review of Literature
Farrel (1957) [1] is considered to be the most influential paper on DEA. The further pioneering contributions were made by CCR (1978, 1979) [2,3] and CCR (1981) [4] . Banker, Charnes and Cooper (1984) [5] and Charnes et al (1985) [6] . Banker and Morey (1986) have evaluated the relative technical and scale efficiencies of DMUs by means of mathematical programming formulations when some of the inputs and outputs are exogenously fixed and beyond the discretionary control of DMU personnel. Bhattacharya et al. (1997) [8] Saha and Ravishankar (2000) [9] , Tone Kaoru (2001) [10] proposed a slacks-based measure of efficiency in DEA and stated that this measure has a close connection to BCC measure of efficiency. Leleu (2006) [11] studied DEA in the context of continuous optimization using BCC models. Appa et al (2006) [12] considered a new framework for the solution of DEA models based on Banker et al (2004) [13] . Banker and Chang (2006) [14] studied the super efficiency procedure for outlier identification in DEA models Asmild et al (2007) [15] developed procedures for measuring overall efficiency and effectiveness using DEA. Sahoo, B.K., Sengupta, J.K., and Mandal, A. (2007) [16] , Sunilkumar and Rachita Gulati. (2008) [17] Dwivedi A.K. & Charyulu D.K., (2011) [18] , are among those few researchers who have examined performance of the Indian commercial banks. They have mainly considered the reform impact and different ownership groups e.g. Public, private and foreign
DEA Approach
DEA is a mathematical modeling technique for the analysis of the relative efficiency of DUMs with multiple inputs and multiple outputs. It is based on Linear Programming problem and It determines the efficient frontier by evaluating all DMUs and measuring their performance in respected to best practice DMUs. Basic DEA models are developed by CCR (1978) [2] and BCC (1984) [5] . CCR based on Constant Returns to scale and BCC admits Variable Returns to Scale.
CCR DEA Model
Efficiency in DEA is defined as the ratio of the weighted sum of outputs to its weighted sum of inputs. Let there be N DMUs and each unit has r outputs and k inputs. The above fractional programming problem can be converted in to a linear program by normalizing either the numerator or denominator. Here we normalize the denominator i.e the weighted sum of nputs equal to unity. Therefore, the above fractional programming problem reduced to 0 .
The above model should be solved for N times one for each DMU. When it is solved, it gives relative efficiency scores 0
), input and output weights. In general, a DMU is considered to be efficient if it obtains a score of 1 and inefficient if it sets scores less than 1. According to the theory of duality in Linear programming problem (LPP) every primal has it own dual so the dual LPP corresponding to above primal is
Emprirical Analysis
The data for this study are taken from " Basic Data on performance District Central
Figures and tables from the paper
| Variables | Mean | Standard deviation | Minimum | Maximum | N |
|---|---|---|---|---|---|
| Number of Offices | 710.26 | 811.00 | 120 | 3737 | 19 |
| Number of Employees | 4526.11 | 5460.94 | 596 | 25299 | 19 |
| Paid up Capital | 43099.58 | 49441.32 | 493 | 187338 | 19 |
| Total Deposits | 930644.11 | 1079581.46 | 54835 | 4867429 | 19 |
| Cost of Management | 30867.79 | 30814.16 | 1932 | 136406 | 19 |
| Working Capital | 1354243.32 | 1443258.51 | 61757 | 6508574 | 19 |
| Investments | 474793.74 | 497418.13 | 44373 | 2281322 | 19 |
| Total Loans & Advances | 855549.05 | 82933.98 | 1920 | 3169819 | 19 |
| C/D Ratio | 743445 | 174331 | 20.66 | 93.56 | 19 |
Table text extracted from the original PDF; superscript letters are shown inline. The original table image is below.
View original table image
| DMU | VRS TE | Peers Weights |
|---|---|---|
| Andhra Pradesh | 1.000 | λ1 =1.000 |
| Bihar | 1.000 | λ2 =1.000 |
| Chhattisgarh | 1.000 | λ3 =1.000 |
| Gujarat | 1.000 | λ4 =1.000 |
| Haryana | 1.000 | λ5 =1.000 |
| Himachal Pradesh | 1.000 | λ6 =1.000 |
| Jammu And Kashmir | 1.000 | λ7 =1.000 |
| Jharkhand | 1.000 | λ8 =1.000 |
| Karnataka | 1.007 | λ4=0.044,λ14=0.180, λ16=0.291,λ18 =0.485 |
| Kerala | 1.000 | λ10 =1.000 |
| Madhya Pradesh | 1.000 | λ11 =1.000 |
| Maharashtra | 1.000 | λ12 =1.000 |
| Orissa | 1.000 | λ13=1.000 |
| Punjab | 1.000 | λ14 =1.000 |
| Rajasthan | 1.000 | λ15 =1.000 |
| Tamil Nadu | 1.000 | λ16 =1.000 |
| Uttar Pradesh | 1.000 | λ17 =1.000 |
| Uttarakhand | 1.000 | λ18=1.000 |
| West Bengal | 1.000 | λ19=1.000 |
Table text extracted from the original PDF; superscript letters are shown inline. The original table image is below.
View original table image
| Variable | Original value | Radial movement | Slack movement | Target value |
|---|---|---|---|---|
| Investments | 320666.000 | 2343.631 | 25149.906 | 348159.537 |
| Total Loans & Advances | 992941.000 | 7257.043 | 0.000 | 1000198.043 |
| C/D Ratio | 91.610 | 0.670 | 0.000 | 92.280 |
| Number of Offices | 596.000 | 0.000 | -80.724 | 515.276 |
| Number of Employees | 4224.000 | 0.000 | -1450.192 | 2773.808 |
| Paid up Capital | 44146.000 | 0.000 | 0.000 | 44146.000 |
| Total Deposits | 827970.000 | 0.000 | 0.000 | 827970.000 |
| Cost of Management | 36195.000 | 0.000 | -6122.884 | 30072.116 |
| Working Capital | 1359678.000 | 0.000 | -88559.572 | 1271118.428 |
Table text extracted from the original PDF; superscript letters are shown inline. The original table image is below.
View original table image
References
18 in the original paper- Farrell MJ. The Measurement of Productive Efficiency. Journal of the Royal Statistical Society Series A. General1. 1957; 20(3):253-282.
- Charnes A, Cooper WW, Rhodes E. Measuring the efficiency of Decision Making Units. European Journal of Operational Research. 1978; 2(6):429-444.
- Charnes A, Cooper WW, Rhodes E. Short Communication: Measuring the Efficiency of Decision Making Units. European Journal of Operations Research. 1979; 3(4):339.
- Charnes A, Cooper WW, Rhodes E. Evaluating Program and Managerial Efficiency: An Application of Data Envelopment Analysis to Program Follow Through. Management Science. 1981; 27(6):668-697.
- Banker RD, Charnes A, Cooper WW. Some Models for Estimating Technical and Scale Efficiencies in Data Envelopment Analysis. Management Science. 1984; 30(9):1078-1092.
- Charnes A, Cooper WW, Golany B, Seiford LM, Stutz J. Foundation of Data Envelopment Analysis for ParetoKoopmans Efficient Empirical Production Function. Journals of Econometrics. 1985; 30(1/2):91-107.
- Banker RD, Morey RC. Efficiency Analysis for Exogeneously Fixed Inputs and Outputs. Operations Research (USA). 1986; 34(4):513-521.
- Bhattacharya A, Lovell CAK, Sahay P. The Impact of Liberalization on the Productive Efficiency of Indian Commercial Banks. European Journal of Operational Research. 1997; 98:332-45.
- Saha Ashish, Ravisankar TS. Rating of Indian Commercial Banks: A DEA Approach. European Journal of Operational Research. 2000; 124:187-203.
- Kaoru Tone. A Slacks-based measure of efficiency in data envelopment analysis. European Journal of Operational Research. 2001; 130:498509.
- Leleu H. A linear programming framework for free disposal hull technologies and cost functions: Primal and dual models. European Journal of Operational Research. 2006; 168:340-344
- Appa Gautam, Williams H Paul. A new framework for the solution of DEA models. European journal of operational research. 2006; 172(2):604-615. ISSN 03772217
- Banker RD, Charnes A, Cooper WW, Seiford LM, Thrall RM, Zhu J. Returns to scale in different DEA models. European Journal of Operational Research. 2004; 154:345-362.
- Banker RD, Chang H. The super-efficiency procedure for outlier identification, not for ranking efficient units. European Journal of Operational Research. 2006; 175:1311-1320.
- Asmild M, Paradi JC, Reese DN, Tam F. Measuring overall efficiency and effectiveness using DEA. European Journal of Operational Research. 2007; 178:305-321.
- Sahoo BK, Sengupta JK, Mandal A. Productive Performance of Evaluation of the Banking Sector in India using Data Envelopment Analysis. International Journal of Operational Research. 2007; 4(2):63-79.
- Sunilkumar, Rachita Gulati. An Examination of Technical, Pure Technical, and Scale Efficiencies in Indian Public Sector Banks using Data Envelopment Analysis. Eurasian Journal of Business and Economics. 2008; 1(2):33-69.
- Dwivedi AK, Charyulu DK. Efficiency of Indian Banking Industry in the Post Reform Era. Indian Instute of Management, Ahmedabad, India. W.P. No. 2011-0301.