
Research article · 2018 · Full text
International Journal of Statistics and Applied MathematicsArtificial neural network based FTIR spectroscopy for the detection of adulteration in virgin sesame oil
Volume 3(1) · Pages 456–459
Research areasEdible Oils Quality and AnalysisSpectroscopy and Chemometric AnalysesDate Palm Research Studies
Abstract
Author-writtenThere are large varieties and trademarks of vegetable oils in India. Vegetable oils have characteristics quite similar to each other and often cannot be distinguished by only observing the color, odor or taste. The methods used traditionally for the classification of these oils are often costly and time consuming and they usually take advantage of techniques from analytical chemistry and chemometrics to increase their efficiency. Due to the wide variety of products, more efficient methods are badly needed to qualify, characterize and classify these substances, because the final price should reflect the excellence of the product that reaches the consumer. In the present study, an attempt has been made to investigate the virgin sesame oil adulterants by using FTIR spectral data. At the end of the analysis, the adulteration of 10% palm oil and 5% palm oil with the virgin sesame oil did not reveal any significant form of adulteration, while an adulterations of 5%, 10% and 15% groundnut oil have respectively revealed 30.5%, 31.6% and 25.9% virgin sesame oil, which is somewhat definitely significant.
Summary
Source-checkedPlain-language reading of the full paper, prepared with AI and checked against the text. Each point links to the authors' own words.
Why it matters
- Vegetable oils are often difficult to distinguish from one another using only sensory observations like color, odor, or taste. View evidence ↗
- Traditional methods for classifying vegetable oils are typically expensive and time-consuming. View evidence ↗
- Existing authentication techniques often require hazardous chemicals, extensive sample preparation, and highly skilled operators. View evidence ↗
The question
- The study aims to use Artificial Neural Networks (ANN) to differentiate and classify the FTIR spectra of virgin sesame oil, palm oil, and groundnut oil. View evidence ↗
What they did
- Virgin sesame oil samples were adulterated by adding palm and groundnut oils in proportions ranging from 5% to 15% (v/v). View evidence ↗
- Infrared spectra were obtained using a Shimadzu FTIR-8400S spectrophotometer equipped with an attenuated total reflectance (ATR) accessory. View evidence ↗
- A three-layer feed-forward back-propagation ANN model was developed using six input variables representing different percentages of palm and groundnut oil adulterants. View evidence ↗
What they found
- Comparing hidden layer sizes, a layer of 4 units yielded the lowest relative error of 0.001. View evidence ↗
- Adulteration of virgin sesame oil with 5% or 10% palm oil did not reveal any significant form of adulteration. View evidence ↗
- The sensitivity analysis indicated that 5% palm oil adulteration revealed 96.0% normalized importance. View evidence ↗
- Adulteration with groundnut oil at 5%, 10%, and 15% revealed normalized importance values of 30.5%, 31.6%, and 25.9% respectively, which the authors consider significant. View evidence ↗
Visual summary
3 visualsIllustrations explain the paper; charts are replotted from the paper's own table values.
ANN Model Architecture
AI-generated conceptual illustration (virgin sesame oil and a neural network schematic). It explains the idea and does not show study data.
View source evidence ↗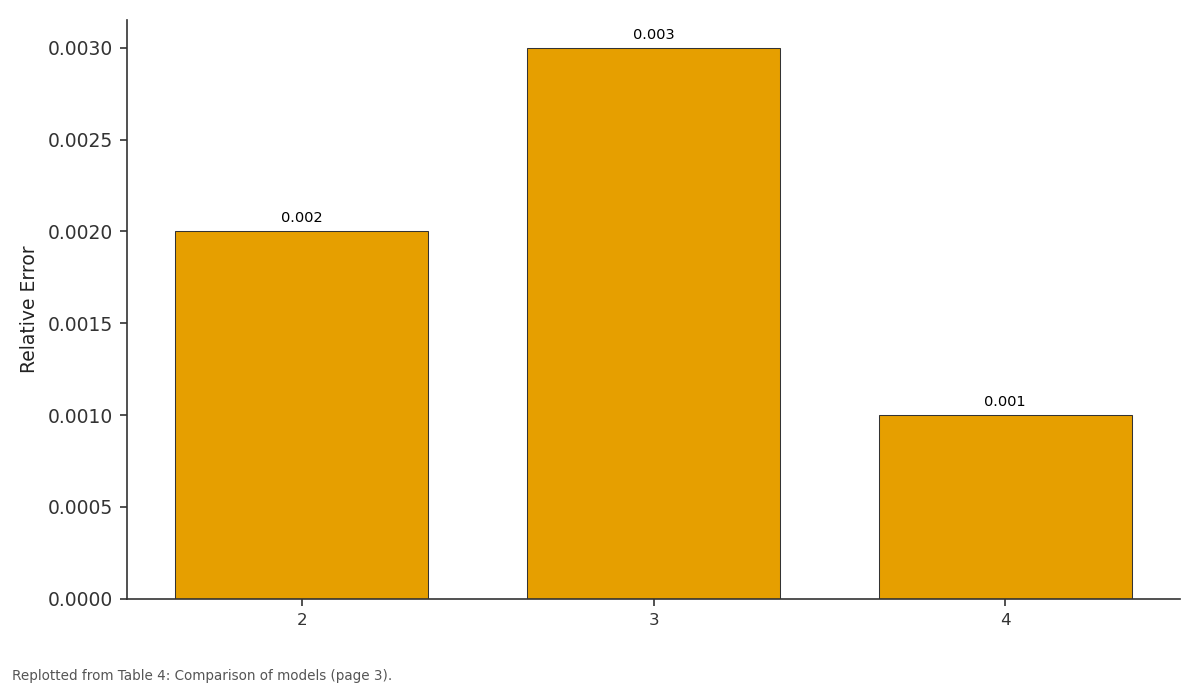
Relative Error: 2 vs 3 vs 4
Replotted from Table 4 (page 3) of the original paper. Every bar is the paper's own table value.
View source evidence ↗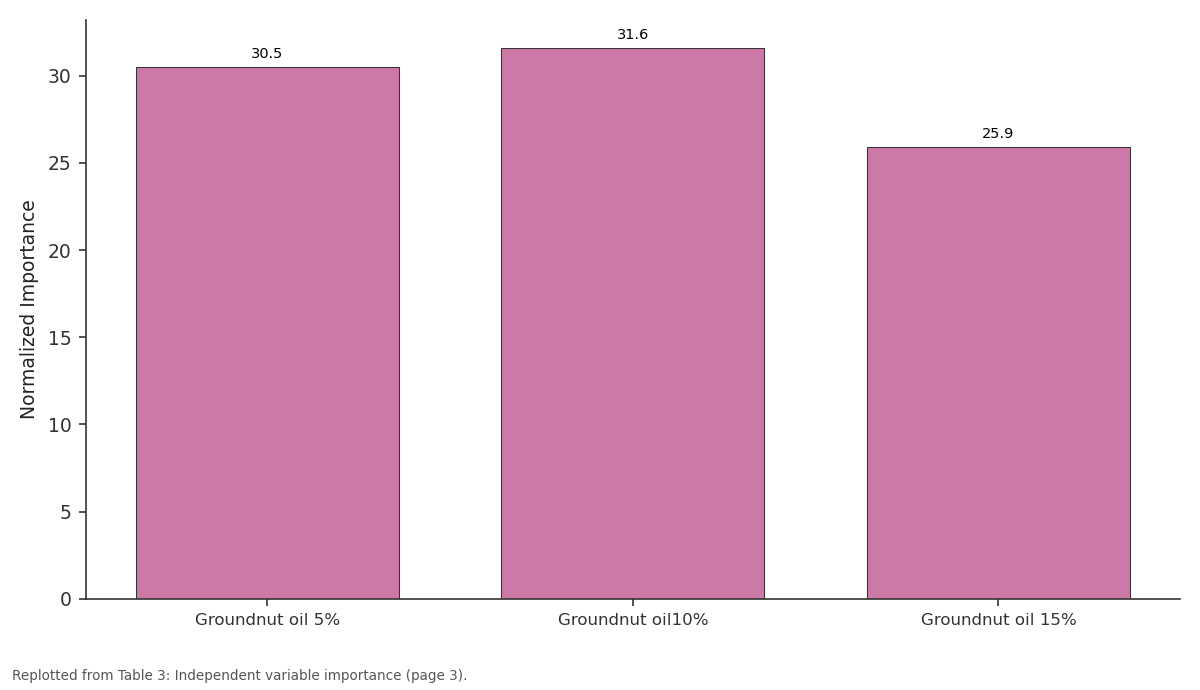
Normalized Importance: Groundnut oil 5% vs Groundnut oil10% vs Groundnut oil 15%
Replotted from Table 3 (page 3) of the original paper. Every bar is the paper's own table value.
View source evidence ↗Figures & tables
From the original paper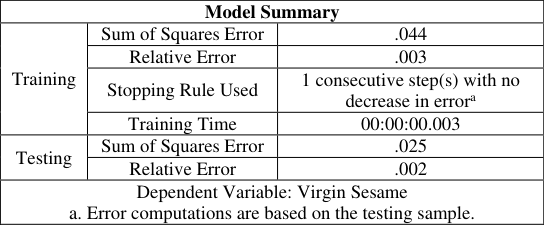 Table 1
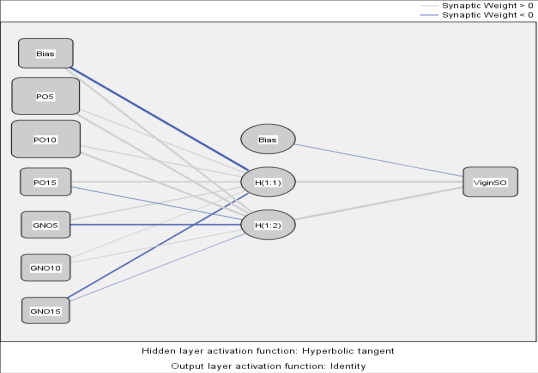 Figure 1
 Table 4
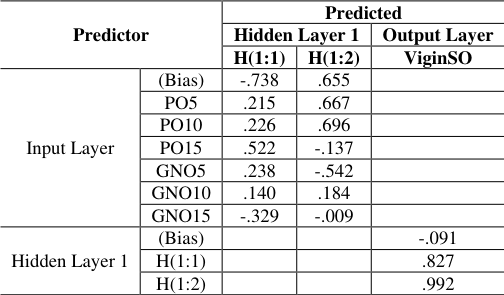 Table 2
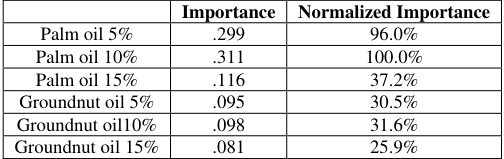 Table 3
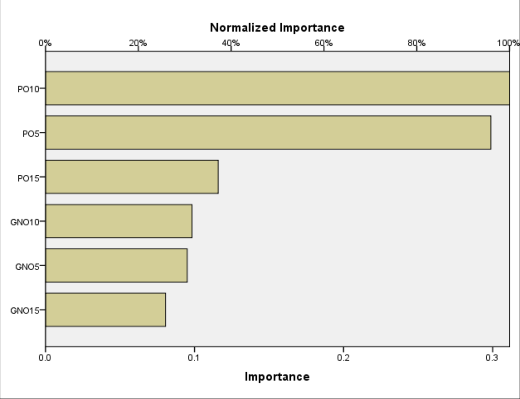 Figure 2
Introduction
The quality related parameters in foods are advancing due to the progress in Spectroscopy and the development of a new sensor technology (Skjervold et al., 2003) [14] . Advances in Spectroscopy have now enabled researchers to obtain information about physical, chemical components in food or biological materials at the molecular level. The various spectroscopic techniques have been used to study structure-function relationships in foods to improve the overall food quality. Chemometrics is well established for calibrating the spectral data to predict concentrations of constituents of interest (Ghosh and Jayas, 2009) [4] . Chemometrics is related to all those processes which transform analytical signals and complex data into useful information (Mujica-Ascencio et al., 2010) [11] . Today, the application of the Fourier Transform Infra Red (FTIR) Spectroscopy has become a powerful analytical tool in this type of studies and particularly in studies related to the edible oils and fats (Rohman and Che Man, 2012) [13] . During the recent years, the Artificial Neural Networks and Channel Relationships methods have been frequently used to process spectral signals (Almhdi et al., 2007) [1] . The use of Artificial Neural Networks (ANNs) for modeling and simulating have become popular in energy sources, chemical engineering, water treatment, and control domain, among others (Jaafarzadeh et al., 2012) [7] . The ANNs and their applications in food chemistry and food science are described by Goyal (2013) [6] and Marini (2009) [9] . ANN can be described as a mathematical model of a specific structure, consisting of a number of the single processing elements (nodes, neurons), arranged in interconnected layers. An active neuron multiplies each input vector by its weight, sums the products and passes the sum through a transfer function to produce the output (Bieroza et al., 2011) [2] . The ANN is made up of a group of interconnected artificial neurons. It consists of an input, hidden and an output layer. Each layer is also composed of neurons. Each neuron transforms inputs and sends outputs to other neurons to which it is connected. 'Weights' and 'bias' are determined from the receiving neurons. The network is trained, with a subset or data set of observations and is optimized based on its ability to predict a set of known outcomes (Klaypradit et al., 2011) [8] .
Marine et al., (2007) [10] employed a combination of two different neural network architectures for the resolution of simulated binary blends of olive oils from different cultivars. In the food industry, food safety and quality are considered important issues worldwide that are directly related to health and social progress. Consumers are increasingly looking for trusted brands of food products, and expect manufacturers and retailers to provide high quality products (Gori et al., 2012; Pandurangan et al., 2017) [5,12] . Increased consumer awareness of food safety and quality issues has led to the development of new and increasingly sophisticated techniques for food product authentication. However, most of these techniques are time consuming, and require extensive sample preparation and hazardous chemicals as well as skilled and experienced operators (Gori et al., 2012) [5] . Due to the large variety of brands and trademarks of vegetable oils in the Indian market, it is common not to know for sure, if the substance that is being bought is really a product without adulteration. Vegetable oils have characteristics quite similar to each other and often cannot be distinguished by only observing their color, odor or taste. In the present study, we propose a method to classify vegetable oils: virgin sesame oil, palm oil and groundnut oil using ANN -Artificial Neural Networks as a tool to differentiate and distinguish the FTIR spectra of these oils.
Materials and methods 2.1 Oil Samples
The Virgin sesame Oil (VSO) and selected vegetable oils, namely Palm Oil (PO) and Groundnut oil (GO) were purchased from the local market. In this study, the Virgin Sesame Oil (VGO) adulterated samples have been used by deliberately adding palm and groundnut oils in established proportions in the range of 5-15% (v/v). These mixtures were manually shaken to ensure total homogenization.
FTIR Spectra acquisition
An FTIR-8400S Fourier Transform Infra Red Spectrophotometer (Shimadzu, Japan) equipped with attenuated total reflectance (ATR) accessory was used to obtain the infrared spectra of oil samples. This Spectrophotometer uses a DLATGS (Lanalin-doped deuterated trigylcerine sulphate) sensitive pyroelectric detector that provides a good signal-to-noise ratio and allows reduction of analysis time to collect the FTIR Spectra. For the FTIR Spectra, the technique of recording a small quantity of the oil sample in a thin film was used (Gergen, 2009) [3] .
Artificial neural network training
In assembling the ANN, the number of neurons in the hidden layer varied from 1 to 4 in order to achieve the greatest possible success in classifying samples. It was observed that, from 4 neurons in the hidden layer, the cases of success were dwindling. The number of neurons in the hidden layer with the highest number of successful cases was four. Various ranges of weights were tested and the highest performance was between 600 and 3700 nm. Using shorter intervals for the weights, the network errors were very disparate. The neural network was analyzed by using SPSS version 17.0. Many different arrangements and network settings were tested, and as already observed, the strongest performance was the setting with 4 neurons in each layer.
Results and discussion
The number of neurons used in the present study is 4, based on the sum of square error convergence. In the present study, we find that our network is activated by training time. The case processing summary shows that 35 cases were assigned to the training sample, 24 cases in the testing sample and no cases were holdout and excluded from the analysis. The final three-layer 6-2-1-feed-forward, back propagation ANN model with variables consisting of palm oil 5%, palm oil 10%, palm oil 15%, Groundnut oil 5%, Groundnut oil 10% and Groundnut oil 15%, has been developed and trained in 59 spectral data (Fig. 1). The network information displays information about the neural network and it is useful for ensuring that the specifications are correct. The number of variables in the input layer is the number of covariates plus the total number of factor levels; a separate variable has been created for each category of adulterants namely palm oil 5%, palm oil 10%, palm oil 15%, groundnut oil 5%, groundnut oil 10%, and groundnut oil 15%. Likewise, a separate variable was created for each category of virgin sesame oil. Thus, the output layer will have only one variable, which is a pre-requisite for any modeling procedure. Covariates are rescaled using the adjusted normalized method. The automatic architecture selection has chosen 4 units in the hidden layer. In the current model, the optimum level was reached, with two hidden layers, with a sum of square error values of 0.001. The number of hidden layers is decided with the help of least sum of square error (Tables. 1 & 4). The output layer contains the responses. Since the history of default is a categorical variable with a single category, namely virgin sesame oil, it is recoded as an indicator variable. Each output unit is some function of the hidden units. Again, the exact form of the function depends, in part, on the network type and, in part, on user-controllable specifications. The model summary (Table .1) displays information about the results of training, testing, and the application of the final network to the holdout sample. The MLP (Multiple Layer Perception) network allows a two hidden layer; in that case, each unit of the second hidden layer is a function of the units in the first hidden layer, and each response is a function of the units in the second hidden layer (Table .2). As shown in the normalized importance (Table .3; Fig. 2), palm oil 10% and palm oil 15% were the most important predictors of persistent adulterants of sensitivity. As previously mentioned, each neural network input element has an associated synaptic value, which is represented by a numerical value that controls the input; the higher the synaptic value, the more relevant is the input for the result that is generated from the neural network. Thus, the adulteration of 10% palm oil with virgin sesame oil does not reveal any significant form of adulteration in the sesame oil, whereas; in the virgin sesame oil, an adulteration of palm oil at 5% reveal 96%. The other adulterant, has shown significant changes in the virgin oil at more than 5% level and those adulterants are not explained further.
Conclusion
This new methodology uses the most relevant parameters of the FTIR spectral data for ANN and confirms the need for systematic study of the details that authenticate the edible oil adultrants over the FTIR spectrum. Thus, in the study of the FTIR spectral frequency assignments, the blend that make up the samples to be analyzed, becomes a crucial step in the process of analyzing the information derived from the FTIR spectra of the edible oil adultrants. In conclusion, the adulteration of 10% palm oil and 5% palm oil with the virgin sesame oil does not reveal any significant form of adulteration, while an adulteration of 5%, 10% and 15% groundnut oil have respectively revealed 30.5%, 31.6% and 25.9% virgin sesame oil, which is somewhat definitely significant.
Figures and tables from the paper
| Model Summary | — | — |
|---|---|---|
| Training | Sum of Squares Error | .044 |
| Relative Error | .003 | |
| Stopping Rule Used | 1 consecutive step(s) with no decrease in errora | |
| Training Time | 00:00:00.003 | |
| Testing | Sum of Squares Error | .025 |
| Relative Error | .002 | |
| Dependent Variable: Virgin Sesame a. Error computations are based on the testing sample. |
Table text extracted from the original PDF; superscript letters are shown inline. The original table image is below.
View original table image
| Size of Hidden Layer | Sum of Squares Error | Relative Error |
|---|---|---|
| 2 | 0.0015 | 0.002 |
| 3 | 0.029 | 0.003 |
| 4 | 0.006 | 0.001 |
Table text extracted from the original PDF; superscript letters are shown inline. The original table image is below.
View original table image
| Predictor | — | Predicted | — | — |
|---|---|---|---|---|
| Hidden Layer 1 | Output Layer | |||
| H(1:1) | H(1:2) | ViginSO | ||
| Input Layer | (Bias) | -.738 | .655 | |
| PO5 | .215 | .667 | ||
| PO10 | .226 | .696 | ||
| PO15 | .522 | -.137 | ||
| GNO5 | .238 | -.542 | ||
| GNO10 | .140 | .184 | ||
| GNO15 | -.329 | -.009 | ||
| Hidden Layer 1 | (Bias) | -.091 | ||
| H(1:1) | .827 | |||
| H(1:2) | .992 |
Table text extracted from the original PDF; superscript letters are shown inline. The original table image is below.
View original table image
| — | Importance | Normalized Importance |
|---|---|---|
| Palm oil 5% | .299 | 96.0% |
| Palm oil 10% | .311 | 100.0% |
| Palm oil 15% | .116 | 37.2% |
| Groundnut oil 5% | .095 | 30.5% |
| Groundnut oil10% | .098 | 31.6% |
| Groundnut oil 15% | .081 | 25.9% |
Table text extracted from the original PDF; superscript letters are shown inline. The original table image is below.
View original table image
References
4 in the original paper- CONIELECOMP), 2010 20 th International Conference on. IEEE, 2010, pp. 136e141.
- Pandurangan MK, Murugesan S, Gajivaradhan P, Shettu N. Application of artificial neural networks to authenticate Virgin Groundnut Oil adulterants using FTIR spectral data. The Pharmaceutical and Chemical Journal. 2017; 4(4):33-38.
- Rohman A Che, Man YB. The Scientific World Journal. Article ID 250795, 2012; 6pages.
- Skjervold PO. Development of intrinsic fluorescent multispectral imagery specific for fat, connective tissue, and myofibers in meat. Journal of Food Science. 2003; 68(4):1161-1168.