
Research article · 2018 · Full text
International Journal of Statistics and Applied MathematicsLogistic regression model applications in retail industry
Volume 3(1) · Pages 476–480
Research areasAgricultural Economics and Practices
Abstract
Author-writtenThe Indian retail industry has emerged as one of the most dynamic and fast-paced industries due to the entry of several new players. It accounts for over 10 per cent of the country’s Gross Domestic Product (GDP) and around 8 per cent of the employment. India is the world’s fifth-largest global destination in the retail space. The Boston Consulting Group and Retailers Association of India published a report titled, ‘Retail 2020: Retrospect, Reinvent, Rewrite’, highlighting that India’s retail market is expected to nearly double to US$ 1 trillion by 2020 from US$ 600 billion in 2015, driven by income growth, urbanization and attitudinal shifts. Retail spending in the top seven Indian cities amounted to Rs.3.58 trillion (US$ 53.7 billion), with organized retail penetration at 19 per cent as of 2014.
Summary
Source-checkedPlain-language reading of the full paper, prepared with AI and checked against the text. Each point links to the authors' own words.
Why it matters
- The Indian retail industry is a highly dynamic sector that contributes more than 10% to the national GDP and approximately 8% to employment. View evidence ↗
- Driven by urbanization and income growth, India's retail market was projected to grow from US$ 600 billion in 2015 to nearly US$ 1 trillion by 2020. View evidence ↗
- Mass promotions are often inefficient because, although they reach many people, only a small fraction typically belong to the intended target market. View evidence ↗
The question
- The paper aims to compare mass promotions with targeted promotions by using logistic regression to predict how customers respond to specific promotions. View evidence ↗
- The authors propose using customer segmentation to achieve a comprehensive view of the customer and to identify the correct populations for targeted marketing. View evidence ↗
What they did
- The authors utilize logistic regression, a technique designed to describe the relationship between a set of predictor variables and a categorical response variable. View evidence ↗
- In the proposed model, the response variable is typically a binary or dichotomous categorical variable. View evidence ↗
- Because the maximum likelihood equations are nonlinear, iterative methods are required to obtain the estimators. View evidence ↗
What they found
- The logistic distribution is characterized by a symmetrical, bell-shaped density that has heavier tails compared to a normal distribution with the same variance and mean. View evidence ↗
- Logistic regression is preferred because it is mathematically flexible, easy to use, and allows for interpretations that are biologically meaningful. View evidence ↗
- The logit transformation is linear in its parameters and can range from negative infinity to positive infinity. View evidence ↗
- The conditional distribution of the response variable in a logistic regression model follows a Binomial distribution. View evidence ↗
What it means
- The authors conclude that retailers should employ statistical methodologies, including logistic regression and predictive modeling, to better understand their customers. View evidence ↗
- The authors recommend that promotional and customer retention policies be based on statistical results, supported by modern software for data visualization and analysis. View evidence ↗
Visual summary
1 visualsIllustrations explain the paper; they do not show study data.
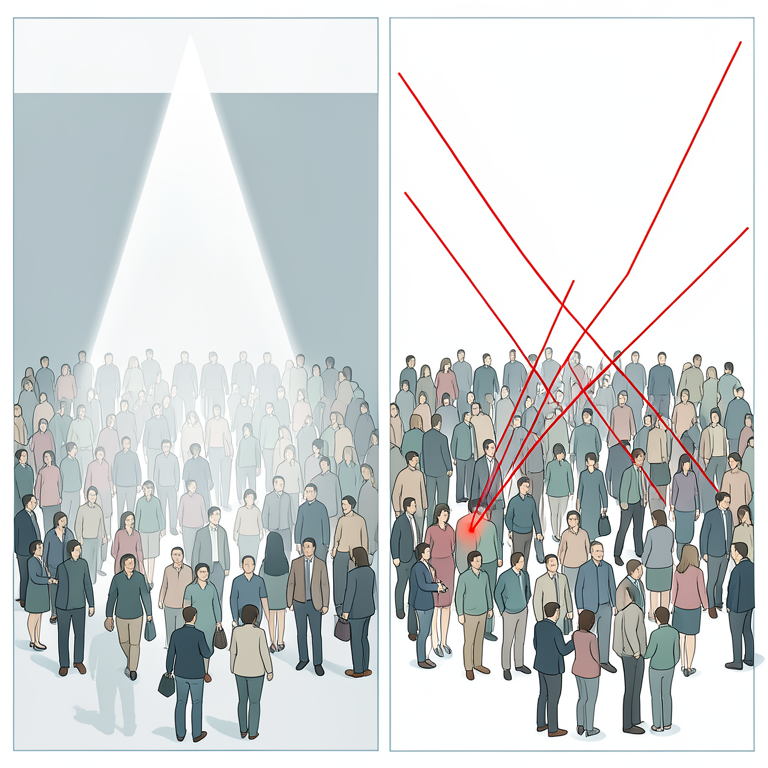
Mass vs. Targeted Promotion
AI-generated conceptual illustration (Retail customers in a shopping mall). It explains the idea and does not show study data.
View source evidence ↗Introduction
Promotions can be categorized based on the intended coverage of a single promotional message. For example, a single television advertisement for a major event, an in store promotion or a promotion on a newspaper could be seen by hundreds of customers at the same time. Such mass promotion, intended to reach as many people as possible, has been a mainstay of Retailers' promotional efforts for a long time. Unfortunately, while mass promotions are delivered to a large number of people, the actual number that fall within the marketer's target market may be small. Because of this, many who use mass promotion techniques find it to be an inefficient way to reach desired customers. Instead, today's marketers are turning to newer techniques designed to focus promotional delivery to only those with a high probability of being in the marketer's target market. In so doing, the marketing focus shifts away from the breadth of customer base to the depth of each customer's needs. The performance metric changes from market share to so-called "wallet share". Data mining is used to construct six types of techniques aimed at solving business problems: classification, regression, time series, clustering, association analysis, and sequence discovery. The first two, classification and regression, are used to make predictions, while association and sequence discovery are used to describe behavior. Clustering can be used for either forecasting or description. This article examines the performance of the mass promotions Vs target promotion here we use logistic regression technique with qualitative and quantitative variable to predict the response of a customer to a particular promotion and we also propose how can we use the customer segmentations to know a customer at a 360 0 view and how to use these segmentations to select correct populations for any target promotions. Finally, we draw conclusions based on the discussion.
Logistic Distribution
A random variable X is said t have Logistic distribution with mean and variance 2 , if it has a cumulative distribution function,
0 and probability density function related to its distribution function, f (x, , ) F (x, , ) [1 F(x, , )] 3
Alternatively, these functions may be expressed as
Properties of Logistic Distribution
1. The density f (x, , ) is bell shaped and symmetrical with heavier tails than a normal density with the same mean and variance. 2. The canonical form of the logistic distribution, which corresponds to the random variable z, with mean = 0 and variance
1. The most popular application of the logistic distributions is the logit in the content of modeling Quantal response data and performing Logistic regression.
The distribution function of the standardized random variable z (
3) is very close to the standard normal distribution.
3. The sum of independent logistic random variables is not a logistic random variable. 4.
The characteristic function of z is given by
6. The absolute moments are given by
7. The Logistic distribution can be obtained from a mixture of the extreme value distributions and the exponential distribution. The Logistic distribution is infinitely divisible.
Specification of Logistic Regression Model
Generally linear regression model is used to approximate the relationship between a continuous response variable and a set of predictor variables. However the response variable is often categorical rather than continuous variable, for such cases, linear regression is not appropriate, but the biostatistician can turn to an analogous method, Logistic regression, which is similar to linear regression in many ways. Logistic regression refers to techniques for describing the relationship between a categorical response variable and a set of predictor variables. In other words the good of a logistic regression analysis is to find the best fitting and most parsimonious, yet biologically reasonable, model to describe the relationship between a response variable and a set of predictor or independent variables. Generally the response variable in the Logistic regression model is categorical and usually Binary or bichotonous variable. There are two main reasons for choosing the Logistic regression model by Biostatistician. These are: (i) In the mathematical point of view, it is an extremely flexible and easily used function; (ii) It trends itself to a biologically meaningful interpretation.
Suppose that (x) E[y / x]
be the conditional mean of y given x. The logistic regression model is given by 01 01
The logit transformation g(x) in terms of (x) is given by 01
The logit g(x) has many of the desirable properties of linear regression model. The logit g(x) is linear in its parameters, may be continuous and may range from - to + depending on the range of x. In the linear regression analysis, one may assume, that an observation of the outcome variable may be expressed as
y E [ y x]
Such that the error variable follows a normal distribution with mean zero and some constant variance That is constant across the levels of the independent variable. This implies that the conditional distribution of the dependent variable (y) given x is normal with mean E [ y/x] and constant variance.
In the case of Logistic regression model, one may express the value of the response variable given x as
Here, may assume one of are two possible values. If y = 1 then = 1 (x) with probability (x) and if y = 0 then = - (x)
with probability 1- (x). i.e., has a distribution with mean zero and variance equal to (x
Thus, the conditional distribution of the response variable follows a Binomial distribution with probability given by the conditional mean (x).
A simple example of logistic regression is as follows: suppose that medical researchers are interested in exploring the relationship between patient age (x) and the presence (1) or absence (0) of a particular disease (y). For a number of patients, generally, this relationship shows logistic regression.
Estimating the Logistic Regression Model
Consider ii (x , y ) , i = 1,2,…….., n be a sample of n independent pairs of observations on two variables X and Y, where i y denotes the value of a dichotomous response variable and i
x denotes the value of the independent variable for the i th subject.
Assume that Y has been coded as 0 or 1 representing the absence or presence of the characteristic respectively.
Write the logistic regression model as
Under the method of maximum likelihood estimation, one may obtain the maximum likelihood equations as
Conclusion
In the Growing retail industry promotions and customer retention has become one of the major challenge. They need to focus using the statistical methodologies like predictive modelling, segmentation, cluster analysis, factor analysis, logistic regression and decision theory to understand their customers well and they need to plan all their promotional and customer retention policies based on the statistical results. The latest software technologies will help them in visualizing and analyzing the vast amount of data they have.
References
19 in the original paper- Camm J, Cochran J, Fry M, Ohlmann J, Anderson D. A Categorization of Analytical Methods and Models. In Essentials of Business Analytics, 2014, 5-7.
- Cox DR, SNELL EJ. The Analysis of Binary Data, 2nd ed. London: Chapman and Hall, 1989.
- Fisher D, De Line R, Czerwinski M, Drucker S. Interactions with big data analytics. Interactions. 2012; 19(3):50-59.
- Hastie T, Tibshirani R, Friedman J. The Elements of Statistical Learning: Data Mining, Inference, and Prediction. 2nd ed. Springer, 2009.
- Hosmer DW, Lemeshow S. 'A goodness-of-fit test for the multiple logistic regression model', Communications in Statistics. 1980; A10:1043-1069
- Hosmer DW, Lemeshow S. Applied Logistic Regression, Wiley, New York, 1989
- Lal Rajiv, David E Bell. The Impact of Frequent Shopper Programs in Grocery Retailing, Quantitative Marketing and Economics. 2003; 1(2):179-202.
- Lam, Shun Y, Mark Vandenbosch, John Hulland, Michael Pearce. Evaluating Promotions in Shopping Environments: Decomposing Sales Response into Attraction, Conversion,and Spending Effects, Marketing Science. 2001; 20(2):194-215.
- Leenheer, Jorna, Tammo HA, Bijmolt. Adoption and Effectiveness of Loyalty Programs: The Retailer's Perspective, Research Report No. 03-124. Cambridge, MA: Marketing Science Institute, 2003,
- Maddala GS. Limited-Dependent and Qualitative Variables in Econometrics. Cambridge University Press, 1983.
- Peter SH, Leeflang, Dick R Wittink. The Estimation of Pre-and Postpromotion Dips with Store-Level Scanner Data, Journal of Marketing Research. 2000; 37:383-95.
- Petrissans A. Customer relationship management: the changing economics of customer relationships. White Paper prepared by Cap Gemini and International Data Corporation, 1999.
- Rice J. ed. Mathematical Statistics and Data Analysis. Cengage Learning, 2006.
- Roland T Rust, Katherine N Lemon. The Customer Pyramid: Creating and Serving Profitable Customers, California Management Review. 2001; 43(4):118-42.
- Rossi, Peter E, Greg M. Allenby A Bayesian Approach to Estimating Household Parameters, Journal of Marketing Research. 1993; 30:171-82.
- Subrahmanyan S. Using Quantitative Models for Setting Retail Prices. Journal of Product & Brand Management. 2000; 9(5)
- Talluri KT, Van Ryzin GJ. The Theory and Practice of Revenue Management. Springer, 2005.
- Winer R. A Price Vector Model of Demand for Consumer Durables: Preliminary Developments Marketing Science, 1985.
- Wolverson R. High and Low: Online Flash Sales Go Beyond Fashion to Survive. Time Magazine, 2012.