
Research article · 2020 · Full text
International Journal of Statistics and Applied MathematicsSolving complicated advanced mathematical problems based on matlab software
Volume 5(3) · Pages 25–31
Research areasEducational Technology and AssessmentMetaheuristic Optimization Algorithms Research
Abstract
Author-writtenBy solving a series of complicated problems using the function and the loop statement provided by Matlab software, we found that the Matlab software is a powerful and convenient software. It not only requires fewer commands but also gives results in a short time. It is suitable to help researchers to solve any problems in higher mathematics, both simple problems, and complicated problems. However, it has some shortcomings also.
Summary
Source-checkedPlain-language reading of the full paper, prepared with AI and checked against the text. Each point links to the authors' own words.
Why it matters
- Matlab is a versatile tool capable of solving various advanced mathematical problems, including those involving matrices, integrals, and equations. View evidence ↗
- Existing literature often focuses on simple applications of Matlab, such as calculating single definite integrals or third-order determinants. View evidence ↗
The question
- The author aims to demonstrate that Matlab can solve more complex advanced mathematical problems by utilizing its loop statements and various functions. View evidence ↗
What they did
- To solve higher-order derivative problems, the author combined Matlab's derivative function with loop statements. View evidence ↗
- High-dimensional integral problems were addressed by calling the Matlab integral function within a loop. View evidence ↗
- The properties of solutions for complicated differential equations were analyzed using Matlab's plotting functions to create phase diagrams. View evidence ↗
- Matlab's specialized functions were used to generate visual representations of complex functions like the gamma and beta functions. View evidence ↗
What they found
- Matlab successfully computed the 1st through 10th derivatives of a complex function involving exponential and trigonometric terms. View evidence ↗
- The software was able to calculate a 10-fold integral of a given function, producing a verified correct result. View evidence ↗
- Visualization of the beta function showed that as one parameter increases while the other is fixed, the function value decreases at a slowing rate. View evidence ↗
- Dynamic imaging revealed that the gamma distribution's density function flattens as the first parameter increases from 1 to 5 while the second is held at 0.5. View evidence ↗
What it means
- The author concludes that Matlab is highly effective for solving high-dimensional calculus and ordinary differential equations through its built-in and plotting functions. View evidence ↗
- The author recommends Matlab as a powerful and convenient tool for researchers to solve both simple and difficult problems in advanced mathematics. View evidence ↗
- The author states that the symbolic results provided by Matlab often differ from frequently used forms, making them difficult to read. View evidence ↗
Figures & tables
From the original paper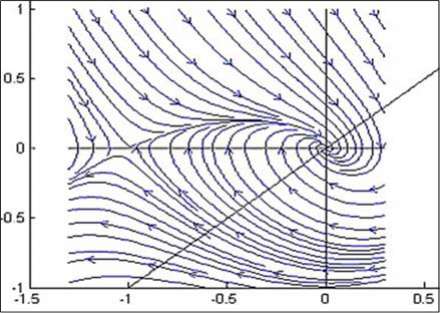 Figure 1
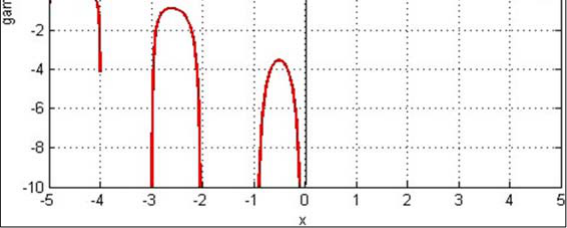 Figure 2
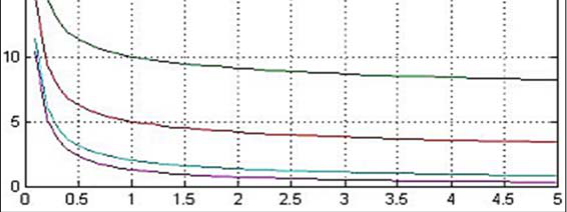 Figure 3
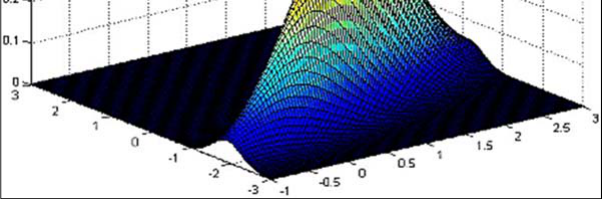 Figure 4
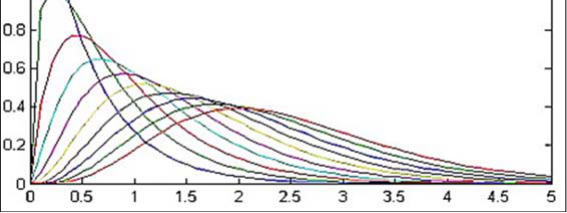 Figure 5
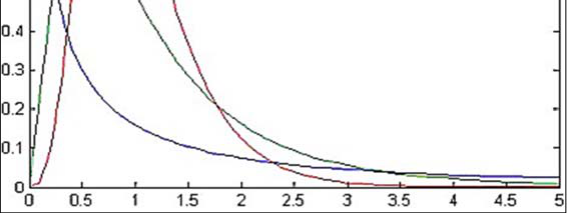 Figure 6
Introduction
Matlab software is a useful mathematical software, which can solve many problems in mathematics, especially in advance mathematics, such as solving the problems of equations, limits, polynomials, integrals, matrices, etc. Regarding the application of Matlab software in advanced mathematics, numerous books and articles have introduced it [1][2][3][4][5][6][7][8][9][10][11][12][13][14] . However, most of them are only about the simple application, such as using Matlab software to find simple limit value [1,7,9,14] , to find the value of the third-order determinant [3,8] , to find the single definite integral [11] , etc. Furthermore, it is only limited to finding the Taylor expansion of a function at a certain point, solving linear equations and simple ordinary differential equations [2,4,5,6,10,12,13] . Actually, except for this, Matlab software can also be used to solve more complicated problems in advanced mathematics with the effective use of various functions and loop statements provided by Matlab software. We will elaborate on this issue below. These results have been verified to be correct, except it is too difficult to read.
The solution of complicated problems 2.1 The Solution of higher derivative problem
The solution of complicated problems 2.1 The Solution of higher derivative problem
The solution of high dimensional integral problem
Example 2. Find the 10 fold integral of the function
To solve this problem, we call the integral function of Matlab software, and input the following commands in combination with the loop statement. This result has been verified to be correct. The same, it is very difficult to read too.
Determination of the properties of solutions of complicated differential equation
Example 3. For the following ordinary differential equation: After checking with the function image in related books, the function image in Figure 2 is exactly the image of gamma function.
Drawing the images of gamma and beta function
Additionally, we can see that the function also exists on the interval less than 0, and the image is more complex. When x is greater than 0, the function decreases first and then increases.
is known as Euler first integral. Because of its complexity and particularity, it is difficult to draw its image by traditional methods. Next, we will call the relevant functions of Matlab software to draw its image by entering the following commands.
Clc; clear all x=0:0.1:5 Ylabel ('$beta (m, n) $','interpreter', 'latex', 'Font Size', 18) Xlabel ('x') Plot (x, beta (x, 0.05), x, beta (x, 0.1), x, beta (x, 0.2), x, beta (x, 0.5), x, beta (x, 0.8)) Legend ('n=0.05', 'n=0.1', 'n=0.2', 'n=0.5', 'n=0.8') Grid on The image obtained is shown in figure 3. After checking with the function image in related books, the function image in Figure 3 is exactly the image of beta function. As can be seen from Figure 3, when one of the parameters is fixed and the other parameter increases, the function value decreases, but the speed of reduction tends to be slow.
Drawing the images of common probability density function
Example 6. The normal distribution of two-dimensional random variables, when
. Fixing its parameters, and inputting the following commands, then the density function image of its two-dimensional joint normal distribution could be drawn. Mu = [1 -1]; Sigma = [.9 .4, .4 .3] [X1, X2] = meshgrid (linspace (-1, 3, 100)', linspace (-3, 3, 100)') X = [X1(:) X2(:)] p = mvnpdf (X, mu, Sigma) Surf (X1, X2, reshape (p, 100, 100)) The result is shown in Figure 4. The resulting image-a dynamic image too, as shown in Figure 5. It can be seen that the density function of gamma distribution becomes flat when the second parameter is fixed to 0.5 and the first parameter is increased from 1 to 5.
, when its parameters change, we can enter the following commands to draw its image. x=0:0.1:5; ylabel ('$F(m, n)$', 'interpreter', 'latex', 'FontSize', 18) xlabel ('x') Plot (x, fpdf (x, 1, 1), x, fpdf (x, 5, 10), x, fpdf (x, 10, 50)) Legend ('F (1, 1)', 'F (5, 10)', 'F (10, 50)') The resulting image is shown in Figure 6. It can be seen from the above: 1) It is very easy to solve the high-dimensional calculus problem by using the built-in function of Matlab software. 2) By using the plotting function of Matlab software, it is very convenient to solve some difficult problems of ordinary differential equation. 3) For the very complicate functions in advanced mathematics, with Matlab software we can draw its image easily and accurately. 4) In advanced mathematics, the probability distribution functions which are very difficult to draw can be plotted. And when their parameters range, the graph produced can be dynamic, making them more visualized.
Conclusion
Therefore, Matlab software is a very powerful mathematical software, and also a very convenient one. It not only requires less commands, but also gives results in a short time. It is suitable to help researchers solve the problems in advanced mathematics, both simple problems and difficult problems. However, through the above work, we also found that when we do numerical calculation, the results calculated are all in decimal form, and we do not find the fraction form as we usually see, for example 3 2
. So we are not able to verify whether the results are correct or not. There is even no constant form, such as 2 and 2 e . When Matlab software give the symbolic results, the form is also different from the requently-used form, which makes it very difficult for us to read. If Matlab software can also give such numerical calculation, it will be more convenient.
Figures and tables from the paper
References
14 in the original paper- Ma XY. Application of Matlab software in advanced mathematics. Computer products and circulation. 2019; 12:204.
- Zhu YW, P JW. Application of Matlab software linear regression in deformation analysis of Furong dam. Small hydropower. 2019; 06:24-35.
- Zhan YQ. Application of Matlab software in Linear Algebra Teaching. Science and technology innovation and application. 2019; 34:156-160.
- Zhao YQ, Fan JJ. Application of Matlab software in ordinary differential equation. Journal of Shandong Normal University. 2019; 34(03):253-261.
- Du Shq, Liu H. The application of Matlab software in the teaching process of probability theory and mathematical statistics. Gansu science and technology. 2019; 35(17):42-43.
- Meng XY. Application of Matlab software mathematical modeling technology in engineering mathematics. China new communication. 2019; 21(16):161.
- Duan Q. Application of Matlab in Higher Mathematics Teaching. Think tank era. 2019; 36:186-195.
- Du HL. Application of Matlab software in linear algebra Experiment Teaching. Computer knowledge and technology. 2019; 15(20):114-115.
- Huang HQ. Application of Matlab software in Higher Mathematics Teaching. Education and teaching forum. 2019; 19:96-98.
- Hou ShP, Jiao YY. The application of Matlab software in the teaching of probability theory and mathematical statistics. Education and teaching forum. 2019; 05:156-157.
- Jiang RW, Tang J. Application of Matlab software in definite integral teaching. Integrated circuit application. 2018; 35(12):41-42.
- Cai QB. The application of Matlab software in the teaching of numerical analysis. Education and teaching forum. 2018; 41:177-179.
- Niu XM. Application of Matlab software in numerical analysis course. Journal of Chifeng University. 2018; 34(08):17-18.
- Zhu XF. Application of Matlab software in Higher Mathematics Teaching. Fujian computer. 2018; 34(08):61-62.