
Research article · 2019 · Full text
International Journal of Statistics and Applied MathematicsDesign and development of two stages mixed sampling plans with the norm of variance and non-conformities
Volume 4(5) · Pages 100–103
Research areasAdvanced Statistical Process MonitoringIndustrial Vision Systems and Defect DetectionManufacturing Process and Optimization
Abstract
Author-writtenThe mixed sampling plans are two stages sampling plans in which variable and attribute quality characteristics are used in deciding the acceptance or rejection of the lot. In industries variables and attributes together are used to decide about the acceptance of lots. In industries many products are in measurable dimensions and the quality of the products should not deviate much from the required target. Hence variance of the distributions plays a vital role in the decision making of the lots. Many quality control practitioners insist that in a mixed sampling inspection the first stage sample should be based on the variance criterion for a target-oriented production to reduce the variance. Hence two stages mixed sampling plans are being developed with a variance criterion. This article presents a new algorithm to make a unique decision on the lot for mixed quality control environment. In this paper the sampling plans are developed by considering variable quality characteristics with variance criteria in the first stage and the second stage is dealt with attribute criteria. New efficiency measures are derived and provided. Designing procedure and Illustrations are given.
Summary
Source-checkedPlain-language reading of the full paper, prepared with AI and checked against the text. Each point links to the authors' own words.
Why it matters
- In industrial production, maintaining measurable dimensions close to a target is critical, making the variance of distributions a key factor in deciding whether to accept or reject product lots. View evidence ↗
- Quality control often requires monitoring both variability and the number of non-conformities, but there is insufficient existing literature on this mixed environment. View evidence ↗
The question
- The authors aim to develop new two-stage mixed sampling plans that control variance in the first stage and the number of defectives in the second stage. View evidence ↗
What they did
- The proposed plan uses a first-stage sample size (n1) based on variance quality characteristics and a second-stage sample size (n2) based on attribute quality characteristics. View evidence ↗
What they found
- The authors found that the two-stage mixed sampling plan is more sensitive to quality deterioration than other methods. View evidence ↗
- Based on Table 1, as the sample size increases, the acceptance constant (k) for the variance criterion decreases. View evidence ↗
- Based on Table 2, for lower probabilities of acceptance, the constant (k) increases as the sample size increases. View evidence ↗
What it means
- The authors conclude that combining variable and attribute criteria leads to more exact inspection decisions. View evidence ↗
- The authors state that this plan encourages producers to better maintain variability within their production processes. View evidence ↗
Visual summary
2 visualsIllustrations explain the paper; charts are replotted from the paper's own table values.
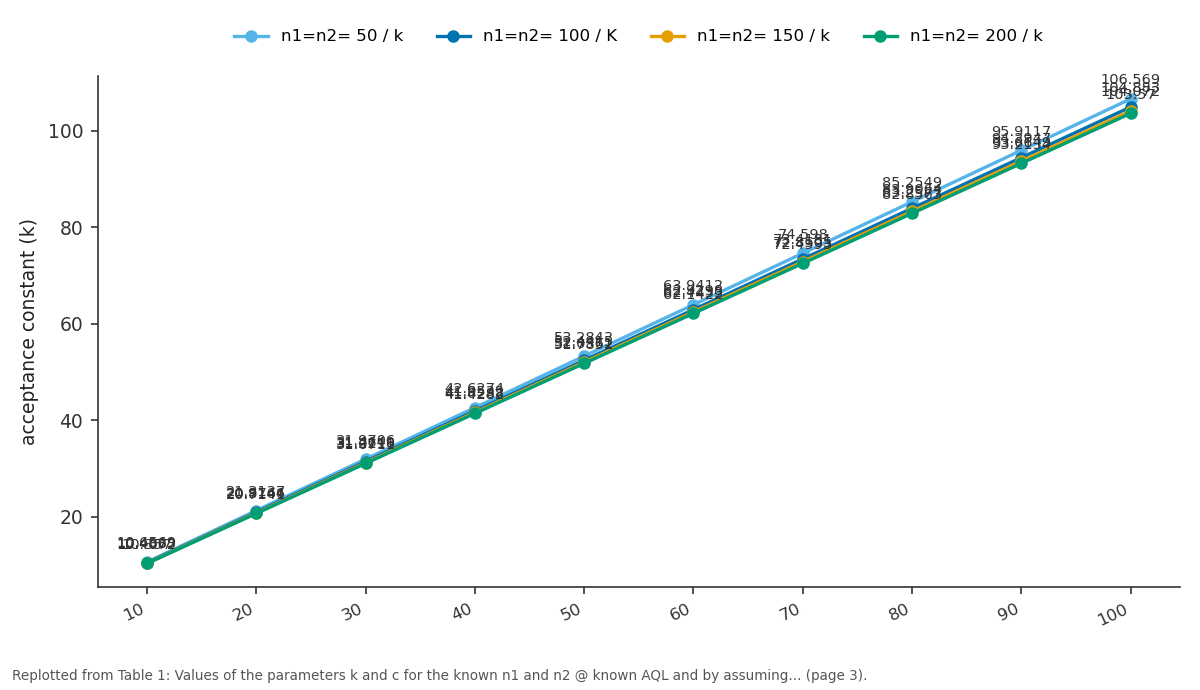
n1=n2= 50 / k and n1=n2= 100 / K and more: 10 vs 20 vs 30 vs 40 vs 50
Replotted from Table 1 (page 3) of the original paper. Every bar is the paper's own table value.
View source evidence ↗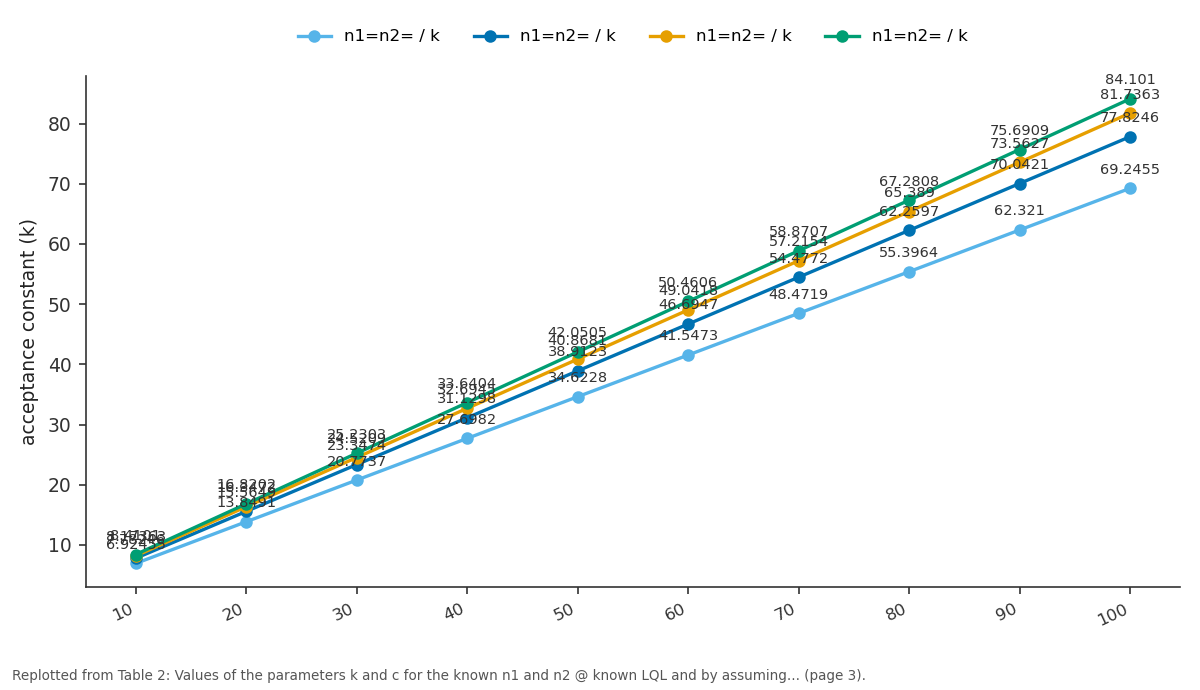
n1=n2= / k and n1=n2= / k and more: 10 vs 20 vs 30 vs 40 vs 50
Replotted from Table 2 (page 3) of the original paper. Every bar is the paper's own table value.
View source evidence ↗Figures & tables
From the original paper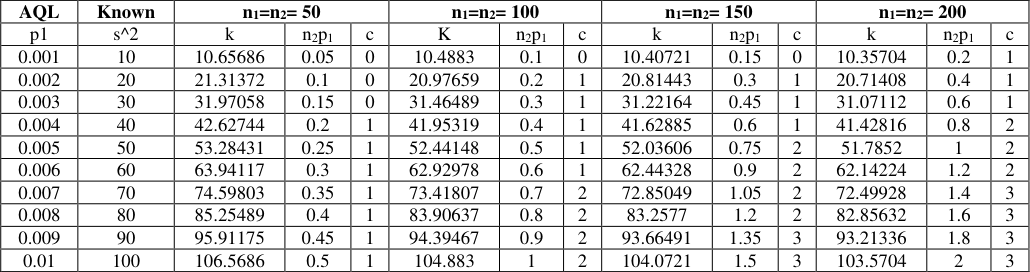 Table 1
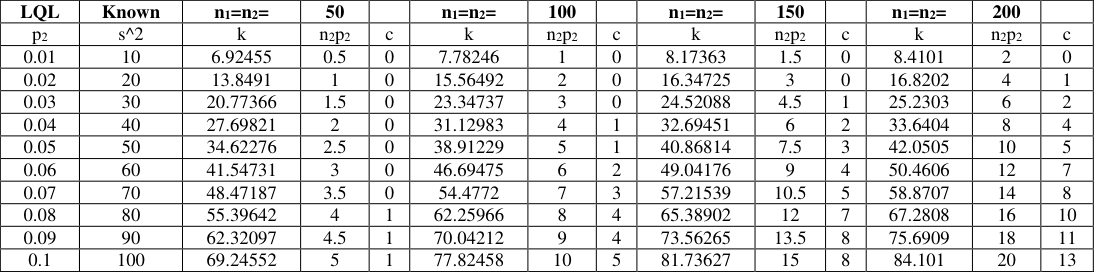 Table 2
Introduction
The mixed sampling plans are two stage sampling plans in which variable and attribute quality characteristics are combined in deciding the acceptance or rejection of the lot. Due to modern quality control systems, mixed sampling plans are widely applied in various stages of production. In industries, variable criteria play a vital role in inspection area. In industries many products are in measurable dimensions and the quality of the products should not deviate much from the required target. Hence variance of the process plays a vital role in the decision making of the lots. In many quality control sections, one has to control both the variability and number of non-conformities. But the literature is not sufficient in this type of mixed environment. Therefore, new mixed sampling plans are being developed to control variance and number of defectives in the first and second stages respectively. The Operating characteristics function and other related measures of the new mixed sampling plans are derived. A new designing methodology for determining the parameters of the sampling plans are given. Comparisons can be made between two and three stages of mixed sampling plans. Tables are constructed to facilitate easy application of mixed sampling plans in the Quality Control Section of production industries. In the year 1967, Schilling presented a method for determining the operating characteristics of mixed variables-attributes sampling plans. Savage (1955) [7] has designed mixed variables and attributes sampling plans based on exponential distribution. DevaArul (2004) [1] has developed new algorithm by inculcating the blend of process & product control measures to control the lot quality. Suresh and Deva Arul (2003) [11] have developed Multi-Dimensional Mixed Sampling Plans to control multi-variate quality characteristics. DevaArul. S (2009) [2] has designed new type of mixed sampling system. Suresh and DevaArul (2002) [9,10] have designed Mixed Chain Sampling Plans to control series of lots. Suresh and DevaArul (2002) [9,10] have developed new type of mixed sampling plans to reduce the sampling cost. DevaArul and Jemmy Joyce (2010) [3] have developed Mixed Sampling Plans for Second Quality Lots.
John H Curtiss (1947) [6] has studied acceptance Sampling by Variables, with Special Reference to Average or Dispersion. DevaArul and Senthil Kumar (2017) [5] have developed new three stages mixed sampling plan for V-A-V quality characteristics with mean and number of defectives as criteria. DevaArul and Senthil Kumar (2019) [4] have developed new two stages variable sampling plan with mean and variance criteria.
Formulation of two stages mixed sampling plans Let N:
Sample size of the first stage with variance quality characteristics. 𝑛 2 :
Sample size of the second stage with attribute quality characteristics. K = Variable factor such that a lot is accepted if
The attributes acceptance number in the second stage β = P a = Probability of acceptance β 1 = Probability of acceptance at AQL 𝛽 1 ′ = Probability of acceptance assigned to first stage σ 2 = Population variance P = Fraction defective
Algorithm for two stages mixed sampling plans based on variance criteria Stage 1
Step 1: Draw a random sample of size n 1 .
Stage 2:
Step 1: Draw another sample of size 𝑛 2 .
Step 2: Count the number of defectives d.
Step 3: If ≤ 𝑐 , accept the lot otherwise reject the lot.
Operating Characteristics and Associated Measures of two stages Mixed Plans 4.1 Operating Characteristics function:
The probability of acceptance of mixed sampling plans with variance criterion and number of non-conformities is given below
Proof
The lot will be accepted in the following cases Case: From the sample of size 𝑛 1 , if 𝑠 1 2 ≤ Kthe lot will be accepted Case: When𝑠 1 2 > 𝐾 , From the sample of size 𝑛 2 , if 𝑑 ≤ 𝑐 the lot will be accepted Case (i) & (ii) are mutually exclusive case. By the law of addition theorem on probability we get
Similarly, ASN and AOQ are derived and given below.
Average Sample Number
Average Sample Number
Average Outgoing Quality AOQ
Average Outgoing Quality AOQ
Designing and determination of parameters through AQL
Step1: Let the first stage probability acceptance be 𝛽 1
′
Let the second stage probability acceptance be 𝛽 1
′′
Step2: Determine the sample size n 1 for the known 𝛽 1
′
Step3: Calculate the acceptance limit k for the existing process average
where, {χ α,n-1 2 } is the standard chi-square variate with n-1 degrees of freedom. Here α = 1-𝛽 1 ′ and n = n 1 Step4: Now determine 𝛽 1 ′′ the second stage probability of acceptance such that
Step5: Determine the second sample size n 2 and acceptance number "c" such that
Tables can be constructed using the above designing procedure. Step 1: Draw another sample of size 𝑛 2 .= 100.
Two Stage Mixed Sampling Plan with Variance Criteria
Step 2: Count the number of defectives 𝑑
Step 3: If 𝑑 = 0, accept the lot otherwise reject the lot.
Designing and determination of parameters through LQL
Step 1: Let the first stage probability acceptance be 𝛽 2
′
Let the second stage probability acceptance be 𝛽 2
′′
Step 2: Determine the sample size n 1 for the known 𝛽 2 ′
Step 3: Calculate the acceptance limit K=k 1 for the existing process average LQL= p 2
Step 4: Now determine 𝛽 2 ′′ the second stage probability of acceptance such that
Step 5: Determine the second sample size n 2 and acceptance number "c" such that
Tables can be constructed using the above designing procedure.
Two Stage Mixed Sampling Plan with Variance Criteria
Stage 2
Step 1: Draw another sample of size 𝑛 2 .= 200.
Step 2: Count the number of defectives 𝑑
Step 3: If 𝑑 ≤ 2, accept the lot otherwise reject the lot.
Conclusion
In this research article, a new two stage mixed sampling plan with variance criterion is developed. Since the final decision is based on combination of vari-attri criteria the inspection result will lead to exact decision. The new algorithm is made easy to operate in quality control section. Based on the designing procedure tables are constructed to facilitate quality control engineers. It is found that the two stages mixed sampling plan is more sensitive towards deterioration of the quality. Hence this sampling plan pressurizes the producer to maintain the variability in the production processes. From the table (1) one can find that whenever the sample size increases, the acceptance constant k decreases and from table (2), it is found that whenever the sample size increases, k increases for lower probability of acceptance. Customers may be satisfied by this type of inspection since both variance and nonconformities are monitored and controlled.
Figures and tables from the paper
| AQL | Known | n1=n2= 50 | — | — | n1=n2= 100 | — | — | n1=n2= 150 | — | — | n1=n2= 200 | — | — |
|---|---|---|---|---|---|---|---|---|---|---|---|---|---|
| p1 | s^2 | k | n2p1 | c | K | n2p1 | c | k | n2p1 | c | k | n2p1 | c |
| 0.001 | 10 | 10.65686 | 0.05 | 0 | 10.4883 | 0.1 | 0 | 10.40721 | 0.15 | 0 | 10.35704 | 0.2 | 1 |
| 0.002 | 20 | 21.31372 | 0.1 | 0 | 20.97659 | 0.2 | 1 | 20.81443 | 0.3 | 1 | 20.71408 | 0.4 | 1 |
| 0.003 | 30 | 31.97058 | 0.15 | 0 | 31.46489 | 0.3 | 1 | 31.22164 | 0.45 | 1 | 31.07112 | 0.6 | 1 |
| 0.004 | 40 | 42.62744 | 0.2 | 1 | 41.95319 | 0.4 | 1 | 41.62885 | 0.6 | 1 | 41.42816 | 0.8 | 2 |
| 0.005 | 50 | 53.28431 | 0.25 | 1 | 52.44148 | 0.5 | 1 | 52.03606 | 0.75 | 2 | 51.7852 | 1 | 2 |
| 0.006 | 60 | 63.94117 | 0.3 | 1 | 62.92978 | 0.6 | 1 | 62.44328 | 0.9 | 2 | 62.14224 | 1.2 | 2 |
| 0.007 | 70 | 74.59803 | 0.35 | 1 | 73.41807 | 0.7 | 2 | 72.85049 | 1.05 | 2 | 72.49928 | 1.4 | 3 |
| 0.008 | 80 | 85.25489 | 0.4 | 1 | 83.90637 | 0.8 | 2 | 83.2577 | 1.2 | 2 | 82.85632 | 1.6 | 3 |
| 0.009 | 90 | 95.91175 | 0.45 | 1 | 94.39467 | 0.9 | 2 | 93.66491 | 1.35 | 3 | 93.21336 | 1.8 | 3 |
| 0.01 | 100 | 106.5686 | 0.5 | 1 | 104.883 | 1 | 2 | 104.0721 | 1.5 | 3 | 103.5704 | 2 | 3 |
Table text extracted from the original PDF; superscript letters are shown inline. The original table image is below.
View original table image
| LQL | Known | n1=n2= | 50 | — | n1=n2= | 100 | — | n1=n2= | 150 | — | n1=n2= | 200 | — |
|---|---|---|---|---|---|---|---|---|---|---|---|---|---|
| p2 | s^2 | k | n2p2 | c | k | n2p2 | c | k | n2p2 | c | k | n2p2 | c |
| 0.01 | 10 | 6.92455 | 0.5 | 0 | 7.78246 | 1 | 0 | 8.17363 | 1.5 | 0 | 8.4101 | 2 | 0 |
| 0.02 | 20 | 13.8491 | 1 | 0 | 15.56492 | 2 | 0 | 16.34725 | 3 | 0 | 16.8202 | 4 | 1 |
| 0.03 | 30 | 20.77366 | 1.5 | 0 | 23.34737 | 3 | 0 | 24.52088 | 4.5 | 1 | 25.2303 | 6 | 2 |
| 0.04 | 40 | 27.69821 | 2 | 0 | 31.12983 | 4 | 1 | 32.69451 | 6 | 2 | 33.6404 | 8 | 4 |
| 0.05 | 50 | 34.62276 | 2.5 | 0 | 38.91229 | 5 | 1 | 40.86814 | 7.5 | 3 | 42.0505 | 10 | 5 |
| 0.06 | 60 | 41.54731 | 3 | 0 | 46.69475 | 6 | 2 | 49.04176 | 9 | 4 | 50.4606 | 12 | 7 |
| 0.07 | 70 | 48.47187 | 3.5 | 0 | 54.4772 | 7 | 3 | 57.21539 | 10.5 | 5 | 58.8707 | 14 | 8 |
| 0.08 | 80 | 55.39642 | 4 | 1 | 62.25966 | 8 | 4 | 65.38902 | 12 | 7 | 67.2808 | 16 | 10 |
| 0.09 | 90 | 62.32097 | 4.5 | 1 | 70.04212 | 9 | 4 | 73.56265 | 13.5 | 8 | 75.6909 | 18 | 11 |
| 0.1 | 100 | 69.24552 | 5 | 1 | 77.82458 | 10 | 5 | 81.73627 | 15 | 8 | 84.101 | 20 | 13 |
Table text extracted from the original PDF; superscript letters are shown inline. The original table image is below.
View original table image
References
11 in the original paper- Devaarul S. Certain Studies relating to Mixed Sampling plans and Reliability based Sampling Plans, Ph.D., Thesis, Department of Statistics, Bharathiar University, Coimbatore, Tamil Nadu, India, 2004.
- Devaarul S. Mixed sampling system with tightened inspection in the second stage, International Journal of Artificial Intelligence. 2009; 2(09):57-65.
- Devaarul S, Jemmy Joyce V. Selection of Mixed Sampling Plans for Second Quality Lots, Economic Quality Control, Germany, 2010.
- Devaarul S, Senthil Kumar D. Accepted for Publication Development of Two Stages Variable Sampling Plans (2S-VSP) with measures of mean and variance for continuous production process, International Journal of Mathematics and computer applications research, 2019. ISSN No: 2249-8060.
- Devaarul S, Senthil Kumar D, Design and Development of three stages mixed sampling plans for V-A-V quality Characteristics, International Journal of Statistics and systems. 2017; 12(4):763-772.
- John H Curtiss. Acceptance Sampling by Variables, with Special Reference to the Case in which Quality is Measured by Average or Dispersion, Journal of Research U.S.A. 1947; 39:271.
- Savage IR. Mixed Variables and Attributes Plans, The Exponential Case, Technical Report No.23, Applied Mathematics and Statistics Laboratory, Stanford University, Stanford, California, 1955.
- Schilling EG. A general method for determining the OC of Mixed variable-attributes Sampling plans, Single sided specifications, SD known, Ph.D. Thesis, Rutgers -The state university, New Brunswick, New Jersey, 1967.
- Suresh KK, Devaarul S. Designing and Selection of Mixed Sampling Plans with Chain Sampling as attribute plan Quality Engineering Journal, U.S.A. 2002; 15(1):155-160.
- Suresh KK, Devaarul S. Combining Process and Product Control for Reducing Sampling Costs Economic Quality Control, Journal and Newsletter for Quality and Reliability -Germany. 2002; 17(2):187-194.
- Suresh KK, Deva Arul S. Multi Dimensional Mixed Sampling Plans, Journal of Quality Engineering, U.S.A. 2003; 16(2):233-237.