
Research article · 2017 · Full text
International Journal of Statistics and Applied MathematicsFactor analysis of local residents’ perceptions towards social impact of tourism in Nepal
Volume 2(6) · Pages 01–8
Research areasDiverse Aspects of Tourism Research
Abstract
Author-writtenTourism, apart from being perceived as an economic factor, is a social component and it prevails subjectively and intangibly in the community. With this view, the purpose of this study is to identify and examine the local residents’ perceptions towards social impact of tourism in Nepal by conducting face to face field survey of 601 respondents from certain tourist destinations with response rate 91.76%.Data was collected from local respondents depending on five point Likert scale. Factor analysis has been used to analyze the collected data. The factor analysis found that 60.8% total variance of perception of residents has been explained by positive impact of tourism and 60.4% total variance has been explained by negative impact of tourism. Thus, the result indicates positive perception of majority of the respondents towards social impacts of tourism.
Summary
Source-checkedPlain-language reading of the full paper, prepared with AI and checked against the text. Each point links to the authors' own words.
Why it matters
- Tourism causes gradual changes in the values, beliefs, and cultural practices of a society, which are felt most deeply by local residents. View evidence ↗
- Conversely, tourism may lead to the imitation of foreign cultures and languages, potentially causing a crisis of local identity and creating crowded conditions. View evidence ↗
The question
- The study aims to identify and examine how local residents in Nepal perceive the social impacts of tourism. View evidence ↗
What they did
- The researchers randomly drew a sample of 655 residents from 2013 electoral rolls, resulting in 601 completed surveys (a 91.76% response rate). View evidence ↗
- A stratified random sampling approach was used to select respondents from three distinct tourist destinations: Ghandruk VDC, Nagarkot VDC, and Bachhauli VDC. View evidence ↗
- Data was collected using a five-point Likert scale and analyzed using factor analysis. View evidence ↗
What they found
- For positive social impacts, three factors accounted for 60.82% of the common variance shared by seven variables. View evidence ↗
What it means
- The authors conclude that tourism development in Nepal has a positive social impact at the community level. View evidence ↗
- The authors recommend that tourism strategies focus on activities that improve the skills of local residents to maintain positive attitudes toward social impacts. View evidence ↗
Figures & tables
From the original paper Table 1
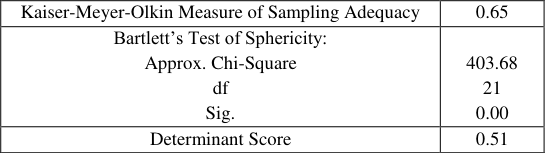 Table 2
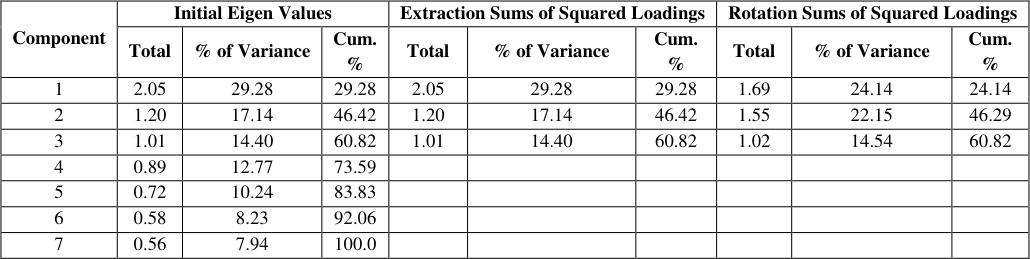 Table 3
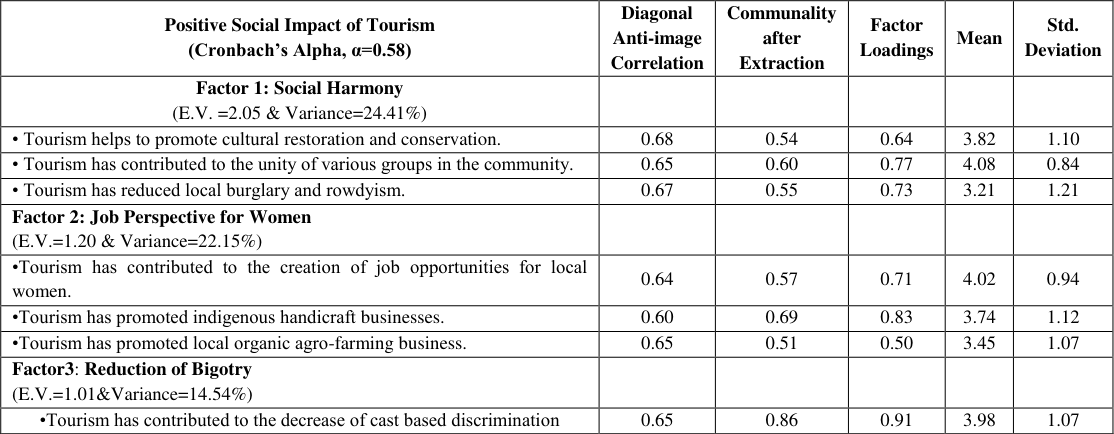 Table 4
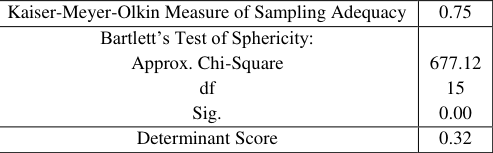 Table 5
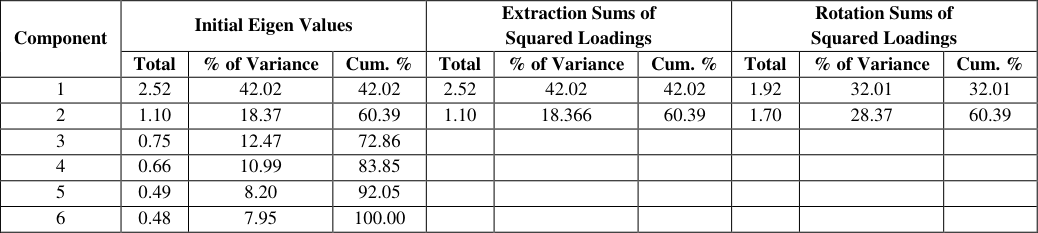 Table 6
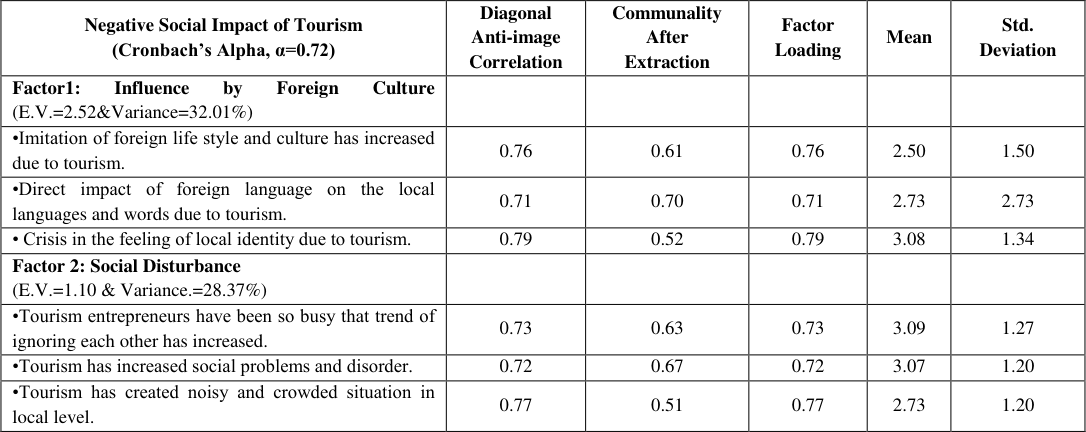 Table 7
Introduction
Tourism instigates gradual change in society's values, beliefs and cultural practices as a result local residents feel its impact more profoundly. It helps to promote the cultural restoration and conservation, and contribute to unity of various groups in the community by means of demonstrating their cultural practices such as rituals, dances, indigenous customs etc. for the tourist to entertain and attract them. Tourism helps to create economic independence which reduces the local burglary and any kind of discriminations. It creates job opportunity for local women by promoting indigenous handicraft business and local organic agro-farming business. On the contrary, there is chance of imitation of foreign life styles, cultures and languages; resulting to its adverse effect it can create crowded situation and feeling of crisis towards local identity. Foreign influence may be interpreted positively as an increase in the standard of living, it may also be considered negatively as an indication of acculturation (Brunt & Courtney, 1999; Dogan, 1987) [1,2] . Tourism can contribute revitalization of arts, crafts and local culture and to the realization of cultural identity and heritage. In order to attract more tourists, architectural and historical sites are restored and protected (Inskeep, 1991; Liu and Var, 1986) [3,4] . Moreover, many people of different cultures come together by means of tourism, facilitating the exchange of cultures (Brayley et al, 1990) [5] . These kind of social impacts may be positive or negative. With the development of tourism in an area, there might be changes in social structure of the community. Basically two different classes: a rich class with consists of businessmen and landowners, and a lower class which contains mostly immigrants might emerge in the community (De Kadt, 1979) [6] . Concentrated immigration from different cultures of people brings about social divergence in the area. Generally, impacts of tourism on women are perceived positively such as:they can exercise freedom more than before, more opportunities to work, independence and respect, better education, higher standards of living with higher family income etc. However, some argue that tourism distracts family structure and values, and also leads to increase in divorce rates and prostitution (Gee et al.1997) [7] . Tourism may lead to a decline in moral values; invokes use alcohol and drugs; increases crime rates and tension in the community (Milman and Pizam, 1988) [8] . Moreover, with the development of tourism, human relations are commercialized while the non-economic relations begin to lose their importance in the community (Dogan, 1989) [9] . In relatively small tourism resort towns, increased population and crowd especially in summer seasons cause noise, pollution and congestion. This limits the use of public areas such as parks, gardens and beaches as well as local services by the residents, which sometimes result in negative attitudes towards tourists (Ross,1992) [10] . Unplanned and uncontrolled structures, distorted urbanization and poor infrastructure damage the natural environment and wild life, and cause air and water pollution. Overuse or misuse of archaeological and historic sites can make to the damage of their appearance. So, tourism causes both positive and negative social impacts in the local community. There are various empirical studies related to Nepalese tourism industries. Some of them are Berger (1978) [11] , Khadka (1993) [12] , Shrestha (1998) [13] , Pradhananga (2000) [14] , Sharma (2001) [15] , Upadhyaya (2004) [16] , Dungel (2015) [17] and Dhakal (2016) [18] assessed economic impact of tourism of Nepal. But, the impacts of tourism consist not only of the economic aspect but it is also of a social component. With this reality, the purpose of this study is to identify and examine the local residents' perceptions towards social impact of tourism by conducting face to face field survey of 601 respondents from certain tourist destinations of Nepal.
Methods
Jinwoo Park and Misook Jung (2009) [19] have provided a method for determining a sample size under certain assumptions when the quantity of interest is measured by Likert scale.
Where n represents the sample size, K represents the number of items used for Likert scale varies from 1 to 10. D represents the relative tolerable error bounds from 1% to 10%. C represents the coefficients of variation of a population varies from 0.1 to 1.0 and ρ represents pair-wise correlation coefficient varies from 0.1 to 0.7 (Park and Jung, 2009).This study has been applied above formula of estimating sample size assuming K=10, D=5%, C=1.0 and ρ =0. During data collection, stratified random sampling approach has been used to select the respondents that represent the whole group of population that lives in three tourist destinations: Annapurna Base camp rout (Ghandruk VDC), Bhaktapur (Nagarkot VDC), Wildlife Conservation Center Chitwan (Bachhauli VDC, Ward numbers 1-4). Geographically, Nepal is divided into three ecological zones: Mountain, Hill and Teari/Inner Terai. So, Ghandruk is taken as Mountain, Nagarkot is taken as Hill and Bachhauli is taken as Terai/Inner Terai. Assuming that 15% non-response rate, a sample of 655 residents has been randomly drawn from electoral rolls based on Constituent Assembly Election II, 2013 provided by Election Commission of Nepal (ECN, 2013) [20] using randomization technique. All adult members of the household were approached. The questionnaire was distributed door to door and this method was chosen because of its higher response rate than other methods (Andereck and Nickerson, 1997) [21] . If an individual refused to participate or could not meet in his/her resident, then next member of same or neighboring household was intercepted and ask to participate(Munhurrun and Naidoo, 2011) [22] . The data gathered in four week period (mid January to mid February), 2017, which is low tourist arrival season in Nepal. 601 respondents completed the survey, with a response rate 91.76%. The sampling frame has been designed to obtain a greater degree of representativeness from local residents to achieve a broad range of representation from the whole population. The actual population number in every location has been based on National Population and Housing Census of Nepal 2011, Central Bureau of Statistics (CBS,2011) [23] . All the statistical analysis has been performed by using IBM*SPSS*statistics version 20. The strata wise distribution of population and samples; and completed questionnaire are shown in the Table 1. This study has been used exploratory factor analysis which tries to uncover complex patterns by exploring the data set and testing prediction (Child, 2006) [24] . This study has been adopted the extraction method based on principal component analysis and the rotation method based on Varimax with Kaiser Normalization. Factor analysis model assumes that there are m underlying factors whereby each observed variables is a linear function of these factors together with a residual variate (Yong, and Pearce, 2013) [25] . This model intends to reproduce the maximum correlations.
| Location | Population (%) | Strata- wise Distribution of Samples | Completed Questionnaire |
|---|---|---|---|
| ABC Rout (Ghandruk VDC) | 4265(31%) | 0.31𝗑655=203 | 192 |
| Bhaktapur (Nagarkot VDC) | 4571(33%) | 0.33𝗑655=216 | 201 |
| WCC Chitwan (Bachhauli VDC, ward no. 1-4) | 4906(36%) | 0.36𝗑655=236 | 208 |
| Total | 13742(100%) | 655 | 601 |
Table text extracted from the original PDF; superscript letters are shown inline. The original table image is below.
View original table image
Where j=1, 2, 3,………..p. The factor loadings are λj1,λj2, λj3,……..λjm which denotes that λj1 is the factor loading of j th variable on the 1 st factor. The measurement error for Xj is denoted by εj.
The Communality is the summation of squared correlations of the variable with the factors (Cattel, 1973) [26] . It can be expressed in the following form:
Where h 2 is communality and λj1, λj2,……..λjm is the factor loadings for j variables which shows the how much the variable contributes to each factor. Kaiser-Meyer-Olkin (KMO) measure of sampling adequacy (Cerny and Kaiser, 1977) [27] has been intended to check the suitability of data set for factor analysis. KMO varies from 0 to 1 where as the values between 0.5 to 0.7 are mediocre, between 0.7 to 0.8 are good,0.8 to 0.9 are great and above 0.9 are superb (Hutcheson and Sofroniou,1999) [28] . The Kaiser-Meyer-Olkin (KMO) measure of sampling adequacy is given by the formula:
Where Rij = correlation matrix and Uij = partial covariance matrix. The Bartlett's test of Sphericity (Snedecor and Cochran, 1989) [29] has been used for testing the null hypothesis that the original correlation matrix is an identity matrix. The Bartlett's test of Sphericity is given as:
Where p = number of variables, n= total sample size and R=correlation matrix. Multicollinearity can be detected by looking at determinant score of correlation matrix. If correlation is singular, the determinant |R|=0. The determinant score has been computed for testing the problem multicollinearity. A simple heuristic is to make sure that determinant R >0.00001 (Haitovsky, 1969) [30] . The Cronbach's alpha coefficient has been computed for testing the internal consistency or reliability, α>0.5 (Nunnally and Bernstein, 1994) [31] . It provided the measure of scale reliability which can be expressed as
Where n is number of sample, S 2 is variance within the items, COV is covariance between a particular item and any other item on the scale, and 𝐶𝑂𝑉 ̅̅̅̅̅̅̅ is average covariance between the items. All the statistical analysis has been performed by using IBM*SPSS*statistics version 20.
Results and Discussions 3.1 Socio-demographic Profiles of Respondents
In this study, the socio-demographic profiles of local respondents has been based on gender, marital status, education status, entrepreneur types, religion, cast/ethnicity, age in year, income level and family size. According to sociodemographic profiles of respondents, there was distribution of men and women with 54.4% and 45.6% respectively. Most of the respondents were married with 77.9%, while 19.3% were still unmarried and 2.8% were single woman/widower. With regard to education background, 9.5% were still illiterate, 17.1% were literate without formal school education, 18.8% were completed primary education, 26.5% were completed secondary education, 18.5% were completed higher secondary and 9.7% respondents had university degree. Similarly, 7.5% respondents were involved in home stay, 22.5% respondents were traders, 25.5% respondents were involved in hotel/guest house, 7.5% respondents were involved in restaurant, 25% respondents were involved in agriculture and animal farming, 6.2% respondents were involved in travel and tour agency, 6% respondents were not involved in tourism business. Most of the respondents were Hindus with 71.5% while Buddhists were 22.6% and Christian were 5.8%. With regard to cast and ethnicity, 24.9% respondents were in Brahmin /Chhetry /Dashanami group, 70.2% respondents were in Madhesi/Janjati/ Adibashi group and only 4.9% were in Dalit group. The age group of 38.3% respondents was in 21-29 years old, 28.8% respondents was in 30-39 years old, 21.9% respondents was in 40-49 years old and 10.9% respondents was in 50 years and over. The income level of 44.6% respondents was less than 20(000NRS), 39.8% of respondents earned 20-40(000NRS), 8.9% of respondents earned 40-60 (000NRS) and 6.7% of respondent earned more than 60(000NRS). Similarly, 36.1% respondents had less than or equal 4 family members, 40.4% respondents had 5 to 6 family members and 23.5% respondents had more than 7 family members.
Positive Social Impact of Tourism
The most important positive social impact of tourism is social harmony such as promotion of cultural restoration and conservation, unity of various group in the community, and reduction of local burglary and rowdyism. Similarly it positively impacts job perspective for women such as job opportunity for local women, promotion of indigenous handicraft businesses and local organic agro-farming business. To analyze the positive social impact of tourism, KMO measure of sampling adequacy, Bartlett's test of Sphericity, and determinant score have been calculated to identify the suitability of the data set for operating the factor analysis. Table 3 shows that before extraction, it is identified 7 linear components within the data set. After extraction and rotation, there are 3 linear components (factor) within the data set where as the Eigen value is greater than 1. The result shows that 60.82% common variance shared by 7 variables can be accounted by three factors. This is the reflection of KMO of 0.65 (mediocre). This initial solution suggests that the final solution will extract not more than 3 factors. The scree plot is also used to determine the number of factors to retain; it is a graphical representation of Eigen values associated with each of the factors extracted.
| Component | Initial Eigen Values | — | — | Extraction Sums of Squared Loadings | — | — | Rotation Sums of Squared Loadings | — | — |
|---|---|---|---|---|---|---|---|---|---|
| Total | % of Variance | Cum. % | Total | % of Variance | Cum. % | Total | % of Variance | Cum. % | |
| 1 | 2.05 | 29.28 | 29.28 | 2.05 | 29.28 | 29.28 | 1.69 | 24.14 | 24.14 |
| 2 | 1.20 | 17.14 | 46.42 | 1.20 | 17.14 | 46.42 | 1.55 | 22.15 | 46.29 |
| 3 | 1.01 | 14.40 | 60.82 | 1.01 | 14.40 | 60.82 | 1.02 | 14.54 | 60.82 |
| 4 | 0.89 | 12.77 | 73.59 | ||||||
| 5 | 0.72 | 10.24 | 83.83 | ||||||
| 6 | 0.58 | 8.23 | 92.06 | ||||||
| 7 | 0.56 | 7.94 | 100.0 |
Table text extracted from the original PDF; superscript letters are shown inline. The original table image is below.
View original table image
The scree plot also shows that there are three factors where the Eigen value is greater than one. The diagonal anti-image correlation column gives the information of sampling adequacy of each and every item. Communalities reflect the common variance in the data structure after extraction. Factor loading expressed the relationship of each variable to the underlying factors. These measures are displayed in Table 4. In Table 4, the diagonal element of the anti-image correlation matrix gives the information of sampling adequacy of each and every item that must be greater than 0.5.The amount of variance in each variable that can be explained by the retained factor is represented by the communalities after extraction. So, communalities reflect the common variance in the data structure. It can say that 54% of the variance associated with statement first is common. Similarly, 60%, 55%, 57%, 69%, 51% and 86% of the common variance associated with stamen second, third, fourth, fifth, sixth and seventh respectively. Factor loading expressed the relationship of each variable to the underlying factor. So, the variables promotions of cultural restoration and conservation, unity of various groups and reduction of local burglary and rowdyism have a correlation of 0.64, 0.77 and 0.73 with factor1 (Social Harmony) respectively. The variables job opportunity for local women, promotion of handicraft business and promotion of local organic agro-farming business have correlation of 0.71,0.83 and 0.50 with factor 2 (Job prospective for women) respectively. The variable contribution to the decrease of cast based discrimination has a correlation of 0.91 with factor 3(Reduction of bigotry). The first factor named "social harmony" explained 24.41% of the total variance with Eigen value (E.V.) 2.05. This factor contained 3 perception items such as promotion of cultural restoration and conservation, unity of various groups in the community and reduce local burglary and rowdyism where as contribution of the unity of various groups tends to strongly agree according to its mean score of scale. But promotion of cultural restoration and conservation; and reduction of local burglary and rowdyism have a tendency towards agree according to their mean score of the scale. The second factor labeled "job perspective for women" explained 22.15% variance with Eigen value (E.V.) is 1.20. This factor contained 3 perception items such as job opportunity for local women, promotion of indigenous handicraft business and local organic agro-farming business where as contribution job opportunity for local women tends to strongly agree but promotion of indigenous handicraft business and local organic agro-farming business tend to agree according to their mean score of scale. The third factor labeled "Reduction of bigotry" explained 14.54% variance with Eigen value 1.01. This factor contained 1 perception item such as contribution to reduce the cast based discrimination which tends to agree according to its mean score of scale. The Cronbach's alpha coefficient for the factors with total scale reliability is 0.58> 0.5. It indicates that the variables exhibit a correlation with their factor grouping and thus they are internally consistent.
| Positive Social Impact of Tourism (Cronbach’s Alpha, α=0.58) | Diagonal Anti-image Correlation | Communality after Extraction | Factor Loadings | Mean | Std. Deviation |
|---|---|---|---|---|---|
| Factor 1: Social Harmony (E.V. =2.05 & Variance=24.41%) | |||||
| • Tourism helps to promote cultural restoration and conservation. | 0.68 | 0.54 | 0.64 | 3.82 | 1.10 |
| • Tourism has contributed to the unity of various groups in the community. | 0.65 | 0.60 | 0.77 | 4.08 | 0.84 |
| • Tourism has reduced local burglary and rowdyism. | 0.67 | 0.55 | 0.73 | 3.21 | 1.21 |
| Factor 2: Job Perspective for Women (E.V.=1.20 & Variance=22.15%) | |||||
| •Tourism has contributed to the creation of job opportunities for local women. | 0.64 | 0.57 | 0.71 | 4.02 | 0.94 |
| •Tourism has promoted indigenous handicraft businesses. | 0.60 | 0.69 | 0.83 | 3.74 | 1.12 |
| •Tourism has promoted local organic agro-farming business. | 0.65 | 0.51 | 0.50 | 3.45 | 1.07 |
| Factor3: Reduction of Bigotry (E.V.=1.01&Variance=14.54%) | |||||
| •Tourism has contributed to the decrease of cast based discrimination | 0.65 | 0.86 | 0.91 | 3.98 | 1.07 |
Table text extracted from the original PDF; superscript letters are shown inline. The original table image is below.
View original table image
Negative Social Impact of Tourism
Tourism might cause a gradual change in society's values, beliefs, language and life styles. It may lead negative impact to the society because of people having merely a commercial tourism related human relations that results into ignoring each other and remain indifferent. The KMO measure of sampling adequacy, Bartlett's test of sphericity, and determinant score of negative social impact of tourism are shown in the following table: Table 5 shows the value of KMO statistic is equal to 0.75>0.6 which indicates that factor analysis is appropriate for the data. The Bartlett's test is highly significant (p<0.001), and therefore there are some relationship between the variables. The determinant score is 0.32>0.00001 which indicates that there an absence of multicollinearity. The Eigen values associated with each factor represent the variance explained by those particular linear components. Table 6 shows that before extraction, it is identified 6 linear components within the data set. After extraction and rotation, there are 2 linear components (factor) within the data set where as the Eigen value is greater than 1. Before and after extraction and rotation, 60.39% total variance has been explained by two factors. Scree plot is a graphical representation of the Eigen values associated with each of the factor extracted, against each other that have been included in the analysis.
| Component | Initial Eigen Values | — | — | Extraction Sums of Squared Loadings | — | — | Rotation Sums of Squared Loadings | — | — |
|---|---|---|---|---|---|---|---|---|---|
| Total | % of Variance | Cum. % | Total | % of Variance | Cum. % | Total | % of Variance | Cum. % | |
| 1 | 2.52 | 42.02 | 42.02 | 2.52 | 42.02 | 42.02 | 1.92 | 32.01 | 32.01 |
| 2 | 1.10 | 18.37 | 60.39 | 1.10 | 18.366 | 60.39 | 1.70 | 28.37 | 60.39 |
| 3 | 0.75 | 12.47 | 72.86 | ||||||
| 4 | 0.66 | 10.99 | 83.85 | ||||||
| 5 | 0.49 | 8.20 | 92.05 | ||||||
| 6 | 0.48 | 7.95 | 100.00 |
Table text extracted from the original PDF; superscript letters are shown inline. The original table image is below.
View original table image
The scree plot shows that there are two factors in which the Eigen values greater than or equal to one. The diagonal antiimage correlation column gives the information of sampling adequacy of each and every item. Communalities reflect the common variance in the data structure after extraction. Factor loading expressed the relationship of each variable to the underlying factors. These measures are displayed in Table 7. The first factor named "influenced by foreign culture" explained 32.01% of the total variance with Eigen value (E.V.) 2.52. This factor contained 3 perception items such as imitation of foreign life style and culture, impact of foreign language on the local language, and crisis in the local identity where as imitation of foreign life style and culture, impact of foreign language on the local language have a tendency towards neither agree nor disagree condition but the crisis in the feeling of local identity tends to disagree according to their mean score of the scale.
| Negative Social Impact of Tourism (Cronbach’s Alpha, α=0.72) | Diagonal Anti-image Correlation | Communality After Extraction | Factor Loading | Mean | Std. Deviation |
|---|---|---|---|---|---|
| Factor1: Influence by Foreign Culture (E.V.=2.52&Variance=32.01%) | |||||
| •Imitation of foreign life style and culture has increased due to tourism. | 0.76 | 0.61 | 0.76 | 2.50 | 1.50 |
| •Direct impact of foreign language on the local languages and words due to tourism. | 0.71 | 0.70 | 0.71 | 2.73 | 2.73 |
| • Crisis in the feeling of local identity due to tourism. | 0.79 | 0.52 | 0.79 | 3.08 | 1.34 |
| Factor 2: Social Disturbance (E.V.=1.10 & Variance.=28.37%) | |||||
| •Tourism entrepreneurs have been so busy that trend of ignoring each other has increased. | 0.73 | 0.63 | 0.73 | 3.09 | 1.27 |
| •Tourism has increased social problems and disorder. | 0.72 | 0.67 | 0.72 | 3.07 | 1.20 |
| •Tourism has created noisy and crowded situation in local level. | 0.77 | 0.51 | 0.77 | 2.73 | 1.20 |
Table text extracted from the original PDF; superscript letters are shown inline. The original table image is below.
View original table image
The second factor labeled "social disturbance" explained 28.37% variance with Eigen value (E.V.) is 1.10. This factor contained 3 perception items such as entrepreneurs ignoring each other, increasing social problem and disorder, and created noisy and crowded situation where as entrepreneurs ignoring each other, increasing social problem and disorder have a tendency towards disagreement but created noisy and crowded situation tends to neither agree nor disagree situation according to their mean score of scale. The Cronbach's alpha coefficient for the factors with total scale reliability is 0.72 > 0.5. It indicates that the variables exhibit a correlation with their factor grouping and thus they are internally consistent
Conclusion
The results of this study reveal that at a community level there is a positive social impact towards tourism development of Nepal. The host community perceived that tourism development creates positive social impact towards social harmony, job perspective for women, and reduction of bigotry. Similarly, they did not perceive that tourism development creates negative social impact with the foreign cultural influence causing cultural and social disturbances to the natives. The results of factor analysis found that three positive factors named as social harmony, job perspective for women, and reduction of bigotry explained 60.82% variance of perception of residents. Similarly, two negative factors named as influence by foreign culture and social disturbance explained 60.40% variance of perception of residents. The local residents have neutral perceptions towards imitation of foreign life style, direct impact of foreign language, and for creating noisy and crowded situation. Tourism development strategy needs to depend on new policies for sustaining the Nepali social assets. Tourism strategy should concentrate on activities that help in improving the skill of local residents that has created positive attitudes towards social impacts.
Figures and tables from the paper
References
31 in the original paper- Brunt P, Courtney. Host perception of socio-cultural impacts. Annals of Tourism Research. 1999; 26(3):493515.
- Dogan HZ. Socio-cultural foundations of tourism. Izmir: Uqur Ofset, 1987.
- Inskeep E. Tourism planning-An integrated and sustainable development approach. New York: Van Nostrand Reinhold, 1991.
- Liu JC, Var T. Resident attitudes towards tourism impacts in Hawaii. Annals of Tourism Research. 1986; 13:193-214.
- Brayley R, Var T, Sheldon P. Perceived influence of tourism on social issues. Annals of Tourism Research. 1990; 17(2):285-289.
- De Kadt E. Tourism-passport to development? New York: Oxford University Press, 1979.
- Gee CY, Makens JC, Choy DJL. The travel industry, 3rd edition. New York: Van Nostrand Reinhold, 1997.
- Milman A, Pizam A. Social impacts of tourism on Central Florida. Annals of Tourism Research. 1988; 15(2):191-204.
- Dogan HZ. Forms of adjustment-socio-cultural impacts of tourism. Annals of Tourism Research. 1989; 16:216236.
- Ross GF. Resident perceptions of the impact of tourism on an Australian city. Journal of Travel Research. 1992; 30(3):13-20.
- Burger V. The economic impact of tourism in Nepal: An input output analysis, Phd, Faculty of the Graduate School, Cornell University, Austria, 1978.
- Khadka KR. Tourism and economic development in Nepal, Phd, Development and Project Planning, University of Bradford, U.K, 1993.
- Shrestha HP. Tourism Marketing in Nepal. Phd, Faculty of Management. Tribhuvan University, 1998.
- Pradhanang SB. Tourists' consumption pattern and its economic impact in Nepal. PhD, Central Department of Economics. Tribhuvan University, 2000.
- Shama OP. Tourism development and planning in Nepal. PhD, Faculty of Social Sciences, Banaras Hindu University, India, 2001.
- Upadhyaya RP. A study of tourism as leading sector in economic development of Nepal. PhD, Department of Economics, University of Lucknow, India, 2004.
- Dhungel KR. An economic analysis on the relationship between tourism and economic growth: Empirical evidence from Nepal. International journal of economics and financial management. 2015; 3(2):84-90.
- Dhakal B. Analyzing Nepal's foreign exchange earnings from tourism using co-integration and causality analysis. American journal of mathematics and statistics. 2016; 6(6):227-232.
- Park J, Jung M. A note on Determination of Sample Size for a Likert Scale. Communication of the Korean Society. 2009; 16(4):669-673.
- ECN. Voter lists of Constituent Assembly Election II, 2013.Election Commission, Nepal, 2013.
- Andereck KL, Nickerson NP. Community tourism attitude assessment at the local level in the evaluation of tourism: Adapting to change, Proceedings of the 28 th Annual Travel and Tourism Association Conference, Lexington, KY: Travel and Tourism Research Association. 1997, 86-100.
- Munhurrun PR, Naidoo P. Residents' attitudes towards perceived tourism benefits. International journal of Management and Marketing Research. 2011; 4(3):45-56.
- CBS. National Population and Housing Census of Nepal, Central Bureau of Statistics, Government of Nepal, 2011.
- Child D. The essentials of factor analysis. 3 rd edition, New York: Continuum International Publishing Group, 2006.
- Yong AG, Pearce S. A beginner's guide to factor analysis: Focusing on exploratory factor analysis. Tutorials in Quantitative Method for Psycology. 2013; 9(2):79-94.
- Cattel RB. Factor analysis. Westport, CT: Greenwood Press, 1973.
- Cerny CA, Kaiser HF. A study of measure of sampling adequacy for factor-analytic correlation matrices, Multivariate Behavioral Research. 1977; 12(1):43-47.
- Hutcheson G, Sofroniou N. The multivariate social scientist: Introductory statistics using generalized linear models. London: Sage Publication, 1999.
- Snedecor GW, Cochran WG. Statistical method. 8 th edition, Iowa State University Press, 1989.
- Haitovsky Y. Multicollinearity in regression analysis: A comment. Review of Economics and Statistics. 1969; 51(4):486-489.
- Nunnally JS, Bernstein IH. Psychometric Theory. 3 rd edition, New York: McGraw-Hill, 1994.
Cited by 7
From OpenAlex, OpenCitations and reference lists read by Scinovex
- Religious Festival Marketing: Distinguishing between Devout Believers and Tourists ↗
Kuo‐Yan Wang, Azılah Kasım, Jing Yu · Religions · 2020
Customer classification is an integral part of marketing planning activities. Researchers have struggled to classify “pilgrims” and “tourists” because these groups overlap to a large extent in terms of their identities while participating in religious activities/sightseeing. To achieve sustainable tourism development for the region with rich religious and cultural characteristics, the present article outlines a process for analyzing the motivation…
❝ 25PDF - Older people's satisfaction with and utilisation patterns of the Old Age Allowance in Nepal ↗
Govinda Prasad Dhungana, Manisha Sapkota, Bishnu Bista · Australasian Journal on Ageing · 2019
OBJECTIVE: The Old Age Allowance in Nepal aims to support the welfare of older people, to improve their social and economic status and to encourage independence. The aim of this study was to assess satisfaction with and utilisation patterns of the Old Age Allowance among older people in Nepal. METHODS: A cross-sectional, quantitative study was conducted in Chitwan, Nepal. Face-to-face…
❝ 8 - Socio-economic Aspects of Tourism Development in Chitlang Village, Makwanpur ↗
Anjana Lamichhane, K C Anup, Bishal Sharma · Economic Journal of Nepal · 2020
This paper examines how the local community of Chitlang village perceives the tourism impact on their community and how their socio-economic characteristics influence their perception towards tourism. Self-administered questionnaires were interviewed to the local people. For this, a 5-point Likert-type response scale was used. Data from 54 completed questionnaires were analyzed quantitatively by various statistical techniques, including factor analysis and…
❝ 3PDF - Nonmonetary poverty in Ethiopia: Multidimensional approach ↗
Migbaru Alamirew Workneh · Poverty & Public Policy · 2020
Abstract This study aims to estimate the nonmonetary multidimensional poverty index (MPI) for Ethiopia using the counting approach of Alkire and Foster and the 2016 Ethiopia Demographic Health Survey (DHS) data. Fourteen country‐specific indicators are used for the poverty estimation using equal and unequal weighting approaches. It is found that, the estimation with unequal weighting gives a much higher level…
❝ 2 - Development and validation of tool to assess respectful maternity care practices among healthcare providers ↗
Radha Devi Dhakal, Regidor III Dioso, Kalpana Sharma, Govinda Prasad Dhungana · BMC Health Services Research · 2025
BACKGROUND: Respectful maternity care in healthcare facilities during childbirth is a growing concern around the world. It is more than just an important component of care quality; it is also a human right. The aim of this study was to develop and validate a tool to assess respectful maternity care practices among healthcare providers in Nepal. METHODS: This is a…
❝ 0PDF - How do Residents perceive the Social Impacts of Tourism on Rural Areas? ↗
Milena Podovac, Đorđe Mitrović, Vedran Milojica · Advances in hospitality, tourism and the services industry (AHTSI) book series · 2023
Tourism has numerous impacts on the domestic population. The domestic population can have positive but also negative perceptions depending on the type and extent of the impact, which is why it is important to examine how the domestic population perceives the tourism impacts. Accordingly, this chapter examines the perceptions of the domestic population about the social impacts of tourism on…
❝ 0PDF - Socio-economic Benefits from Applying Innovative Technologies in the Tourism and Hospitality Industry in Asia ↗
Muhammad Saeed Meo, Sumayya Chughtai, Vina Javed Khan, Mohd Zaini Abd Karim, Shahan Mehmood Cheema · Springer eBooks · 2021
❝ 0PDF