
Research article · 2020 · Full text
International Journal of Statistics and Applied MathematicsDynamics of COVID-19 outbreak & lockdown effectiveness in India
Volume 5(2) · Pages 95–101
Research areasCOVID-19 epidemiological studiesCOVID-19 Pandemic Impacts
Abstract
Author-writtenOn 11 March 2020, WHO declared Novel Coronavirus Disease (COVID-19) outbreak as a pandemic and reiterated the call for countries to take immediate actions and scale up response to treat, detect and reduce transmission to save people’s lives. As a result, across globe, nations have taken steps to implement social distancing to reduce the transmission rates. On 24 March 2020, India implemented a 21-day nationwide lockdown. As on 2 April 2020, according to the Ministry of Health & Family Welfare, India, a total of 2069 COVID-19 cases, have been reported in 29 states/union territories. These include 155 who have been cured/discharged, 1 who has migrated and 53 deaths. Hospital isolation of all confirmed cases, tracing and home quarantine of the contacts is ongoing. This study aims at laying down a theoretical base by way of developing a mathematic model of the pandemic as well as analyzing the effectiveness of the current lockdown and recommendations for an effective containment.
Summary
Source-checkedPlain-language reading of the full paper, prepared with AI and checked against the text. Each point links to the authors' own words.
Why it matters
- The WHO declared COVID-19 a pandemic on March 11, 2020, urging nations to scale up responses to reduce transmission and save lives. View evidence ↗
- In response to the pandemic, India implemented a nationwide lockdown for 21 days starting March 24, 2020. View evidence ↗
- Epidemic data in India faced uncertainty due to asymptomatic spread and a lack of scalable diagnostic testing for a population exceeding 1.3 billion. View evidence ↗
The question
- The study aims to develop a mathematical model of the pandemic to analyze the effectiveness of the lockdown and provide containment recommendations. View evidence ↗
- The research specifically seeks to predict the epidemic peak in India and evaluate the sensitivity of various control measures. View evidence ↗
What they did
- The author used an SIR (susceptible-infectious-recovered) compartmental model, simplifying the SEIR model by ignoring the exposed class for population-scale analysis. View evidence ↗
- The model for India was established using a basic reproductive ratio (R0) of 2.1, a recovery rate (γ) of 1/7, and a transmission rate (β) of 0.3. View evidence ↗
- The simulation assumed a population of 1 billion and a start date of January 25, 2020. View evidence ↗
- The mathematical model was implemented and solved using the deSolve package's ODE function in the R programming language. View evidence ↗
What they found
- Simulations indicated that after a single lockdown is lifted, infection counts could exceed 4 million within just three weeks. View evidence ↗
- A very stringent lockdown (curfew) reducing the transmission rate (β) to 0.01 lowered the infection count to 0.7 million after three weeks, though the outbreak still resurged exponentially. View evidence ↗
- The model found that two intermittent, strictly implemented lockdowns (with β = 0.01) were extremely effective at controlling the outbreak. View evidence ↗
What it means
- The author concludes that strict, intermittent lockdowns are effective and can be used to balance disease control with social and business functioning. View evidence ↗
- The author states that a single 3-week lockdown is likely to be ineffective in controlling the outbreak. View evidence ↗
- The author suggests that for sharper analysis, the model should be implemented for individual states or regions to account for diverse demographic factors like population density and age profiles. View evidence ↗
Visual summary
1 visualsIllustrations explain the paper; they do not show study data.
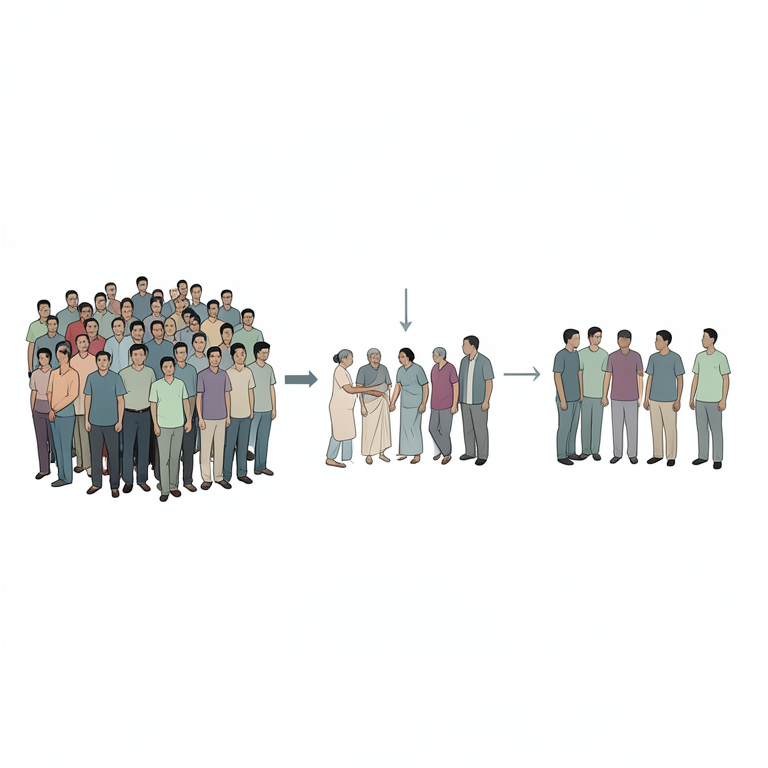
SIR Model Flow
AI-generated conceptual illustration (a population of people in an urban Indian setting). It explains the idea and does not show study data.
View source evidence ↗Figures & tables
From the original paper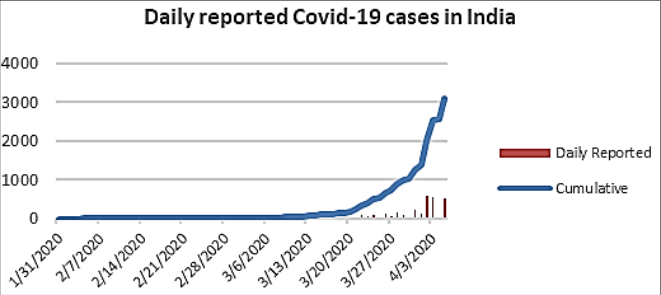 Figure 1
 Figure 2
 Table 1
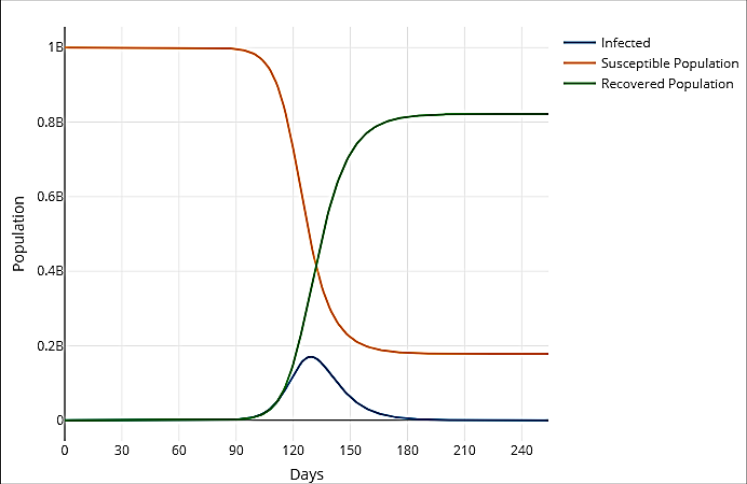 Figure 3
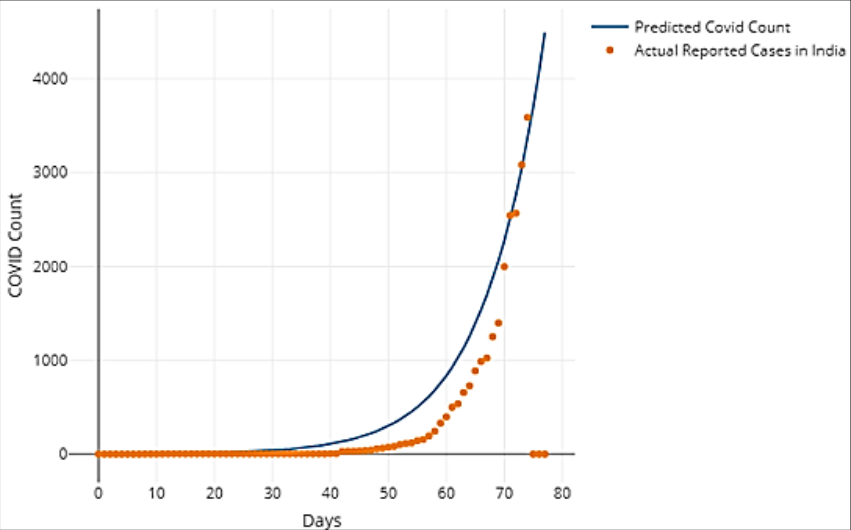 Figure 4
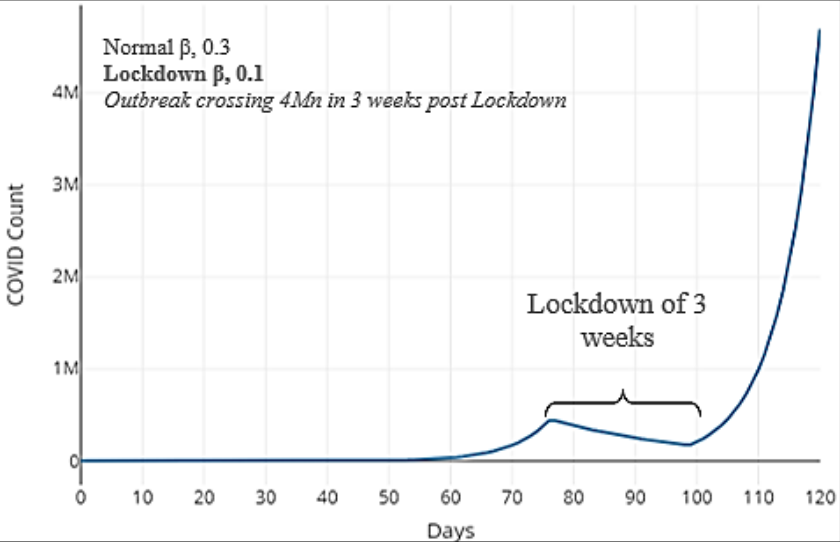 Figure 5
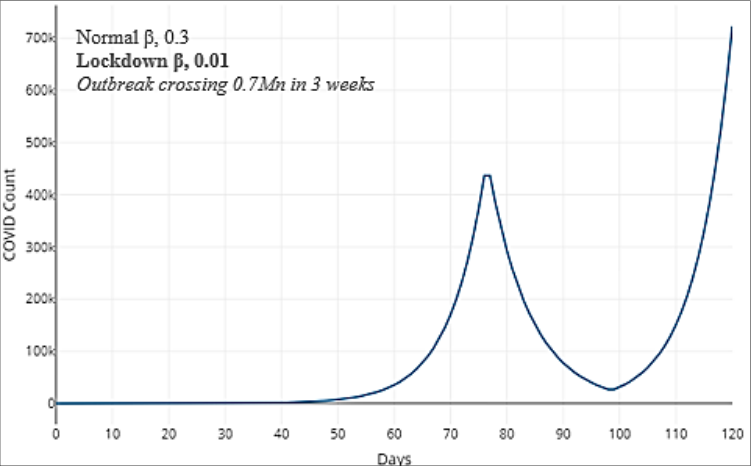 Figure 6
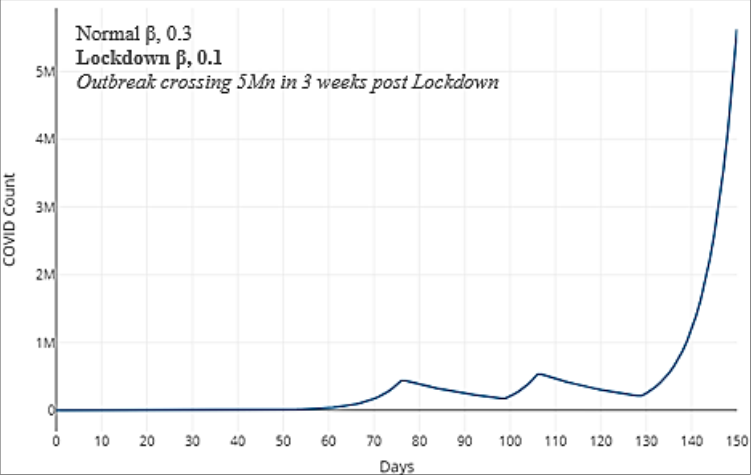 Figure 6
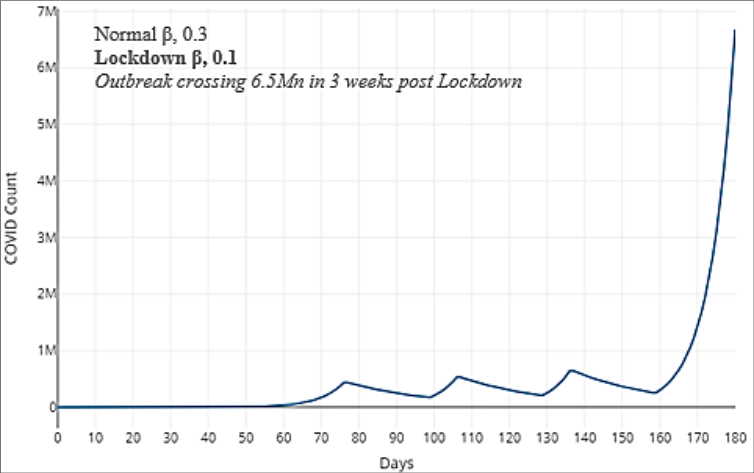 Figure 7
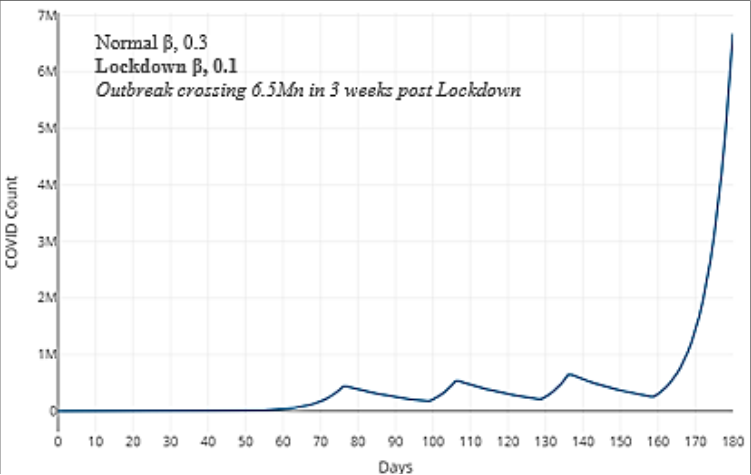 Figure 8
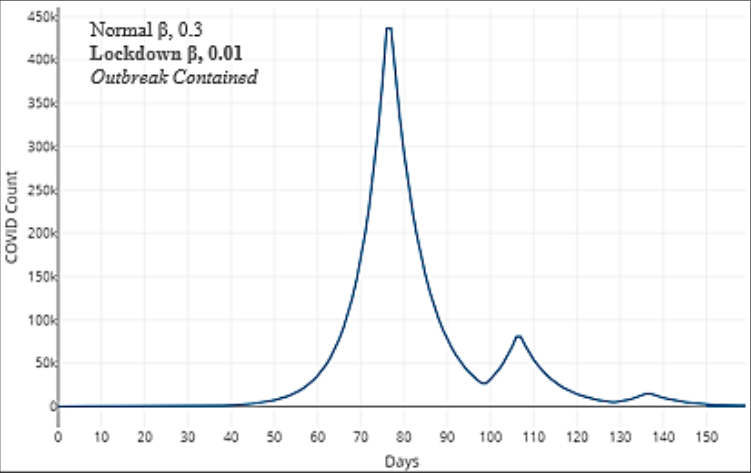 Figure 9
Introduction
December 2019, the first case of respiratory disease caused by a novel coronavirus was identified in Wuhan City, Hubei Province, China. The outbreak of the disease is ongoing worldwide and the World Health Organization named it coronavirus disease 2019 (COVID-19) on 11 February 2020. In India, the first case was reported on 31st January 2020 and the number of reported confirmed COVID-19 cases per day has increased day by day.
Fig 1: Outbreak of COVID-19 cases in India
As seen in Figure 1, the number of newly reported cases per week has increased and a serious outbreak in India is the outcome which forced national authorities to implement Lockdown and quarantine measures across the country. The purpose of this study is to give a prediction of the epidemic peak of COVID-19 in India, as well as, effectiveness and sensitivity of control measures, which might help to act appropriately & proactively to reduce the epidemic risk.
The epidemic data as shown in Figure 1 would have mainly twofold uncertainty. The first one is since asymptomatic infected people could spread the infection. The second one is due to the lack of opportunity for the diagnostic test as sufficiently simple diagnostic test kits have not been developed yet and the diagnosis in the early stage in India and has yet to achieve scale given a population of over 1.3 Bn.
Epidemic model
The progress of an infectious micro-parasitic disease is defined qualitatively in terms of the level of pathogen within the host, which in turn is determined by the growth rate of the pathogen and the interaction between the pathogen and the host's immune response. The abundance of the parasite grows over time & during this early phase the individual may exhibit no obvious signs of infection and the abundance of pathogen may be too low to allow further transmission-individuals in this phase are said to be in the exposed class. Once the level of parasite is sufficiently large within the host, the potential exists to transmit the infection to other susceptible individuals; the host is infectious. Finally, once the individual's immune system has cleared the parasite and the host is therefore no longer infectious, they are referred to as recovered. This fundamental classification (as susceptible, exposed, infectious, or recovered) solely depends on the host's ability to transmit the pathogen. This implies that the disease status of the host is irrelevant-it is not important whether the individual is showing symptoms; an individual who feels perfectly healthy can be excreting large amounts of pathogen. This disease profile can be mathematically modeled as SEIR (susceptible-exposedinfectious-recovered), however, it is mathematically simpler and justifiable at the population scale to ignore the exposed class, reducing the number of equations by one and leading to SIR dynamics. The SIR model (Kermack and McKendrick, 1927) [1] is one of the simplest compartmental models, and many models are derivatives of this basic form. The model consists of three compartments: S for the number of susceptible, I for the number of infectious, and R for the number of recovered or deceased (or immune) individuals. This model is reasonably predictive for infectious diseases which are transmitted from human to human. The variables (S, I, and R) represent the number of people in each compartment at a time. To represent that the number of susceptible, infected and recovered individuals may vary over time (even if the total population size remains constant), we make the precise numbers a function of t (time): S(t), I(t) and R(t). For a specific disease in a specific population, these functions may be worked out in order to predict possible outbreaks and bring them under control. The dynamics of an epidemic, for example the COVID-19, is much faster than the dynamics of birth and death, therefore, birth and death is omitted in the model. The SIR system without vital dynamics can be expressed by the following set of ordinary differential equations: β is a parameter controlling how much the disease can be transmitted through exposure. It is determined by the chance of contact and the probability of disease transmission. γ is a parameter expressing how much the disease can be recovered in a specific period. The ratio, β/γ, is called basic reproductive ratio R0, which if >1 leads to epidemic.
Deploying the model to Indian scenario
A major challenge in the application of epidemic models is the determination of model parameters. In this case, recent relevant research by Rajesh Singh and R. Adhikari [2] , turned out to be extremely helpful. Their research titled "Age-structured impact of social distancing on the COVID-19 epidemic in India" [2] , provides necessary parameters, namely, R0 and γ, which is computed based on case data, age distribution and social contact structure of India [3] . R0 hence is taken as 2.1 and γ as 1/7, yielding β as 0.3. These parametric values established the model for India as below:
Isolation or quarantining as well as lockdown of regions are some of the oldest, yet most effective, means of disease control. Even for the COVID-19 epidemic these strategies are adopted globally. Two strategies have been witnessed to control the outbreak: 1. Strict Lockdown, Testing & Social Distancing, Ex: China, Philadelphia, France, South Korea 2. Mild Lockdown & BAU, Ex: Germany, Sweden
This study aims at analyzing the effectiveness of the current lockdown period of 21 days and attempts to provide a theoretical base to decide upon duration & strictness required to control the outbreak. The Lockdown scenario can be modelled by an effective decrease in transmission rate, β and Quarantine can be modelled by introducing two more parameters, detection rate, quarantine period and another variable capturing the Quarantine class. The Quarantine scenario, however, is ignored given the large population, limited quarantine facility and for mathematical simplicity. This model was implemented and solved in R using ODE function in the package deSolve. The program was ultimately deployed on a shiny server with a user-interface in the form of an output on a web browser. This facilitated easy study of model's dynamics & sensitivity towards parameter shifts, the latter being the simulation of the Lockdown control measure.
Simulation approach
We model the COVID-19 epidemic with following parameters, initials and assumptions. The model was implemented & solved in R and the results were dynamically plotted. The dynamics of the outbreak was analyzed by varying the transmission rate, β, lockdown period, and lockdown count of the same. Considering the administrative constraints and flow of normal life, a break of 7 days is considered if multiple lockdowns are implemented. Further to this, the strictness of implementation of lockdown was simulated by assigning a Lockdown β for the Lockdown period which is at least 1/3 rd of the 'normal steady-state' β. Same is enabled to vary over a range to analyze the impact on the outbreak. The simulation model has been implemented on live server and is also made accessible via web for seamless access to anyone interested to study the outbreak behavior. The start date of the simulation has been chosen as 25 th Jan, 5 days prior to the first reported case.
To mathematically or logically account for the very low number of tests conducted in initial period, though gradually increasing, the model assumes no lockdown for about 11 weeks from the date of start. This takes care of the offset or lag which arises in comparing the actual trend with the predicted curve.
Simulation findings
The model was back-tested with the actual data for a period of over 10 weeks daily time-series and excellent results were obtained. The goodness of fit of the prediction was also tested yielding very good fit & following results. Correlation was performed with the cor. test function in the native stats package in R and the results were as below:
t = 38.247 df = 73 p-value < 2.2e-16 Alternative hypothesis: true correlation is not equal to 0 95 percent confidence interval: 0.962 to 0.985 Sample estimates: cor 0.976
The prediction of the outbreak I(t), under various parametric assumptions and lockdown scenarios are produced in the figures below. Actual reported cases for India is also added as dotted trace for comparison. Figure 5 shows the outbreak crossing 4 Mn infection counts in just 3 weeks once lockdown is lifted. Figure 6 shows for a more stringent lockdown over same period, note that β in this case is reduced by 1/10 th to 0.01, simulating a very stringent Lockdown (Curfew), this condition dramatically reduces the outbreak and the count after 3 weeks reduced to 0.7 Mn. However, the outbreak still resurges exponentially. In the Subsequent figures, Figure 7 & 8, the simulation shows if the number of lockdowns is increased to 2 or 3, even then the outbreak resurges, notable is the strictness of lockdown. In both the cases of Figure 7 & 8, a moderate lockdown is implemented.
In Figure 10, it becomes evident that a combination of 2 intermittent Lockdowns is extremely effective provided, it is "strictly implemented", β in this case assumed at 0.01.
Conclusion
In this paper classic SIR epidemic model was implemented using relevant parameters for India which were computed in recent research [2] . The Model's prediction was back tested for the goodness of fit and a very satisfactory fit was obtained. The model was simulated by incorporating the control measures of Lockdown and the sensitivity of Lockdown scenario was studied. The study clearly shows effectiveness of a strict lockdown measure, which might be intermittent so as not to extremely hamper the social & business functioning. The simulation also shows one Lockdown of 3 weeks duration will mostly be ineffective, also supported by the fact that the outbreak's actual breadth and depth is unknown given the low count of tests performed. A tabular finding is also presented in the Appendix A and the model is made open to public at the link provided in the Appendix B.
Given the large population and extremely diverse demographic factors, like, population density, social contact structure & ageprofile, it makes sense to implement the model for each state or major region for sharper analysis and decision making.
Acknowledgement
AcknowledgmentThis research & underlying study was motivated and supported by Dr. Shreeraj Deshpande, COO at Future Generali India Insurance Company Limited.
Figures and tables from the paper
| Particulars | Value | Remarks |
|---|---|---|
| Beta | 0.3 | Rajesh Singh and R. Adhikari |
| Gamma | 1/7 | Rajesh Singh and R. Adhikari |
| S(t=0) | 1-(1e-09) | |
| I(t=0) | (1e-09) | |
| R(t=0) | (1 -S-I) | |
| Population | 1 Bn | |
| Start Date | 25th Jan 2020 |
Table text extracted from the original PDF; superscript letters are shown inline. The original table image is below.
View original table image
References
5 in the original paper- Rajesh Singh R. Adhikari, Age-structured impact of social distancing on the COVID-19 epidemic in India, arXiv:2003.12055 [q-bio.PE]
- Kato F, Tainaka K, Sone S. et al., Combined effects of prevention and quarantine on a breakout in SIR model. Sci Rep. 2011; 1:10 https://doi.org/10.1038/srep00010
- Wang, Xingyuan, Zhao, Tianfang, Qin, Xiaomeng. Model of epidemic control based on quarantine and message delivery. Physica A: Statistical Mechanics and its Applications. 458. 10.1016/j.physa. 2016; 04:009.
- Kuniya T. Prediction of the Epidemic Peak of Coronavirus Disease in Japan, J. Clin. Med. 2020; 9:789.
- Cantó B, Coll C, Sánchez E. Estimation of parameters in a structured SIR model. Adv Differ Equ, 2017, 33. https://doi.org/10.1186/s13662-017-1078-5