
Research article · 2019 · Full text
International Journal of Statistics and Applied MathematicsA study of mathematical model of tumor growth by multicellular tumor spheroids
Volume 4(6) · Pages 32–36
Research areasMathematical Biology Tumor GrowthCancer Cells and Metastasis
Abstract
Author-writtenIn this paper we describe some elements of mathematical modeling of tumor growth by multicellular tumor spheroids. We present deterministic mathematical model most often used for description of tumor growth. Development of a model, based on some biological assumption, is also illustrated by one example. Discribed model are tested and compared by ability to describe experimental data.
Summary
Source-checkedPlain-language reading of the full paper, prepared with AI and checked against the text. Each point links to the authors' own words.
Why it matters
- Mathematical models of tumor growth are used to express how the size of a tumor changes over time. View evidence ↗
- Multicellular tumor spheroids (MTS) are useful for studying the prevascular phase of tumor growth and 3D cell-cell interactions without host interference. View evidence ↗
- In MTS, nutrients and oxygen enter through the surface, which leads to the formation of necrotic cells at the center. View evidence ↗
The question
- The study aims to describe and present deterministic mathematical models commonly used to characterize the growth of multicellular tumor spheroids. View evidence ↗
- The research seeks to test and compare these models based on their ability to accurately describe experimental data. View evidence ↗
What they did
- The authors selected models that reflect the sigmoid nature of MTS growth, which typically consists of exponential, linear, and plateau phases. View evidence ↗
- The evaluated models were categorized into three groups: empirical, functional, and structural. View evidence ↗
- The experimental data used for testing the models were derived from the means of 50 volumes. View evidence ↗
- The study used the ODEN computer code for numerical solutions and combined Nelder-Mead simplex and Levenberg-Marquardt procedures for nonlinear minimization of the X2 function. View evidence ↗
What they found
- The logistic and von Bertalanffy models were found to be incapable of describing the experimental data. View evidence ↗
- The inhibition model developed by Wheldon and Cox also failed to describe the data. View evidence ↗
- The simple spheroid model performed worse than most other models but was significantly better than the logistic, von Bertalanffy, and inhibition models. View evidence ↗
What it means
- The authors conclude that the Gompertz, autostimulation, and Piantadosi models are the most suitable for describing the growth curves of multicellular tumor spheroids. View evidence ↗
- The authors recommend that model selection should not rely solely on data description but also consider predictive power and the ability to estimate biological parameters like doubling time. View evidence ↗
Visual summary
2 visualsIllustrations explain the paper; charts are replotted from the paper's own table values.
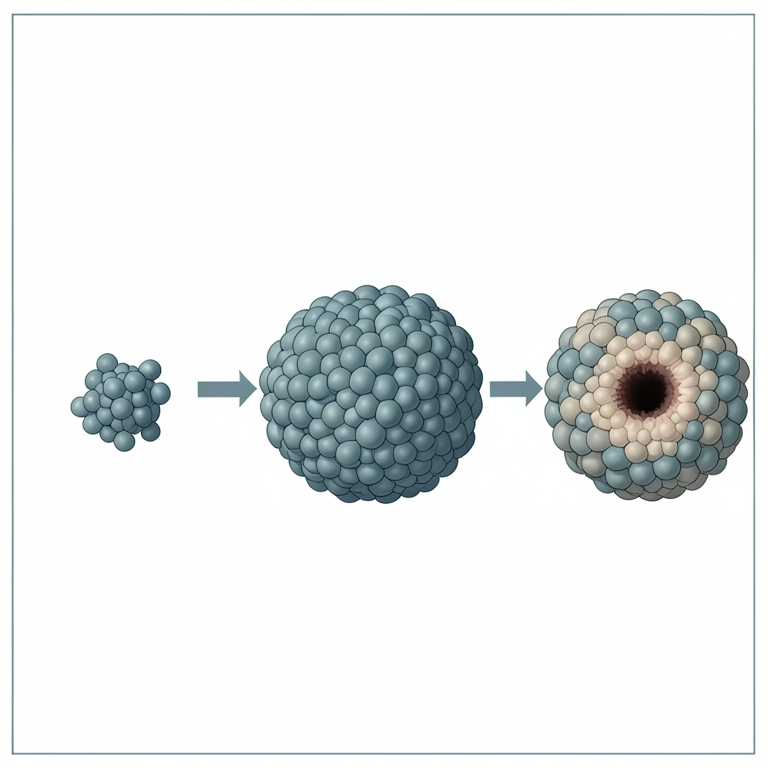
Sigmoid Growth Curve Phases
AI-generated conceptual illustration (multicellular tumor spheroids). It explains the idea and does not show study data.
View source evidence ↗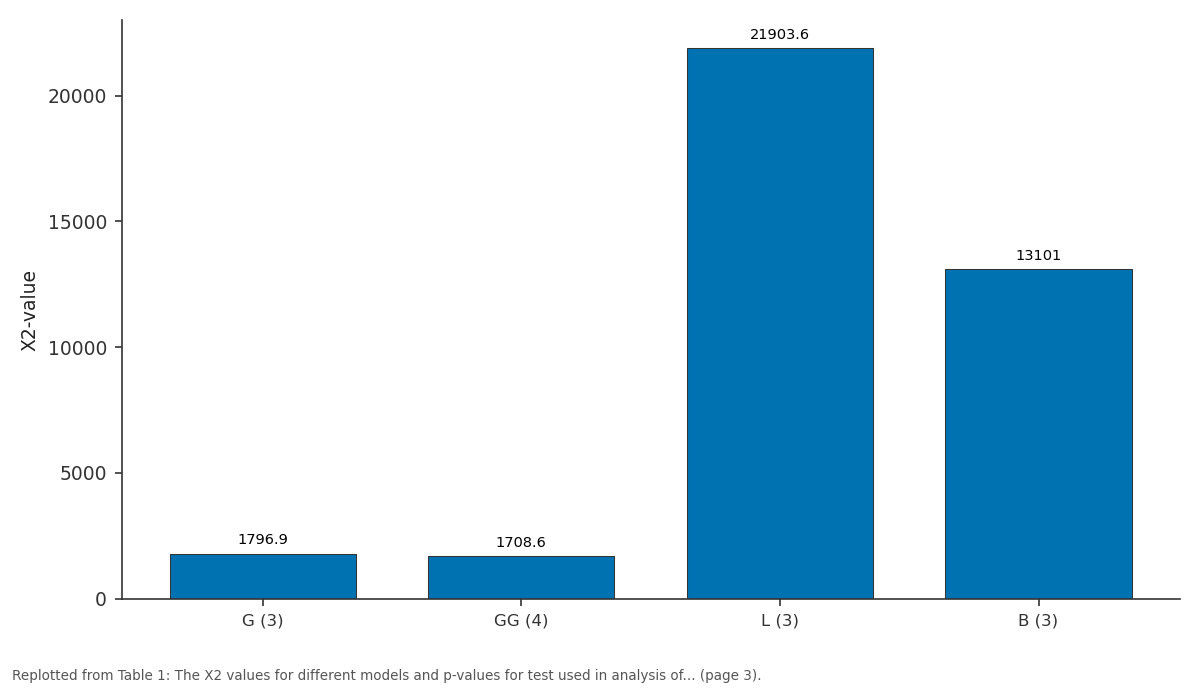
X2-value: G (3) vs GG (4) vs L (3) vs B (3)
Replotted from Table 1 (page 3) of the original paper. Every bar is the paper's own table value.
View source evidence ↗Figures & tables
From the original paper Table 1
 Table 2
 Table 2
Introduction
A mathematical model of tumor growth is a mathematical expression of the dependence of tumor size on time. In the paper we present some results in the field of deterministic mathematical modeling of tumor growth. There are three main steps in the process of mathematical modeling: 1. Definition of model based on biological assumptions. 2. Testing the model against experiment data. 3. Acceptance of model or its rejected and change of assumptions.
It is important to note that a model may be rejected due to wrong assumptions or inadequate number of assumptions. A particularly convenient experimental tumor paradigm is provided by the multicellular tumor spheroids (MTS) culture system [3] . Spheroids provide a system for the prevascular phase of tumor growth in the absence of tumor-host interactions, and for investigating the regulation of growth by three-dimensional cell-cell interaction. In MTS oxygen and nutrition come through the surface of spheroids and necrotic cell lay in the center of tumor.
Mathematical models
In the case of multicellular spheroids, growth follows the sigmoid curve with the three distinct phases : the initial exponential phase, the linear phase and the plateau [13] .For this study, we selected mathematical model of that reflect the sigmoid nature of growth. The models are divided into three groups: empirical models, functional models and structural models.
Empirical models
These model are based on the fundamental empirical insight that growth results from the increase in size concomitant with processes that limit the size the system. we consider two sets of empirical model developed for growth of biological system. One set of models is based on the principle that for tumor size B, the rate of change in size B ' , is a difference between the rate of growth and the rate of degradation. According to von Bertalanffy [2] , both rates follow the law of allometry, i.e., they are proportional to the power of tumor volume, so the growth equation is of the form B ' =cB α -dB β ……………… (1) (Starting from different assumptions, Savageau [22] later derived the same equation.) This model is named the "generalized two-parameter model" [15] . As the special cases, equation (1) includes the well know logistic growth (α = 1,β = 2) [20,30] and the von Bertalanffy growth equation (α = 2/3, β = 1) [1] . Both models have been used for description of tumor growth. It is interesting that a particular limiting case of equation ( 1) is the most often used Gompertz equation [11] B ' = cB -dB In B …………….
(2) When parameters α and β approach 1, the growth curve represented by Eq. 1 does not necessarily approach an exponential curve, but it may also approach the Gompertz growth curve. Furthermore, equation (1) contains the more general equations as special cases: "generalized Gompertz equation" [15] and "generalized Bertalanffy-logistic equation". The above models are special cases of the model described by equation (1) and are nested within this model. In this paper we illustrates the nesting relationships. These relationships make it possible to compare the models by well defined statistical criteria. Another set of nested empirical models, proposed by Turner et al. [25] , is given. It is assumed there that the rate of change in size is proportional to the product of one function increasing with size and other function decreasing with size. The corresponding equation reads
Where -1 < p<, 1/ n > o, and the solution is designed as the "generic growth curve". Turner et al. [25] derived the special cases of equation ( 3). One is the "hyper-Gompertz" model and the other is the "hyper-logistic" model. For p= 0 the generic equation reduces to the Bertalanffylogistic equation [25] which is a special case of the generalized Bertalanffy-logistic equation. The Gompertz model and the logistic model are nested in the hyper-Gompertz and the hyper-logistic models, respectively. Another empirical model is the "Gomp-ex" model [26]. It is a combination of the often used exponential model and the Gompertz model. The differential equation for this model is
This model describes explicity the initial exponential spheroid growth. For B c = B 0 , the Gomp-ex equation reduces to the simpler Gompertz equation reduces to the simpler Gompertz equation.
Functional models
From the fertile field of functional modal based on cell kinetics we selected some with few parameters. Thus we considered the model by Piantadosi [20] :
The inhibition model formulated on the basis of work by wheldon et al. [27] and Cox et al. [6] :
As well as the autostimulation model [16] based on the autocrine hypothesis:
These models are characterized by the cellular doubling time, the fraction of activity dividing cells and the random loss of cell from population. The magnitude of the growth fraction depends on the population size. The models account for volumes, though originally they were developed for cell numbers [6,16,20,27] . Although the total spheroid volume is not directly proportional to the number of living cells due to changes in cell size and central necrosis during growth [9,10] , these changes do not alter the overall size of the spheroid. Consequently, the spheroid volume can be substituted for the cell number in these models. This substitution makes it possible to apply the function models to the measurements of spheroid volumes.
Structural models
Several mathematical models have been developed for description of spheroid growth in structural terms. All such models assume that the spheroid is a perfect sphere and that processes such as proliferation, necrosis, diffusion, shedding, inhibition, etc, obey spherical symmetry. Thus the growth of a spheroid can be conveniently described by its radius, R(t). However, the corresponding equation can be obtained in terms of volume by substitutions V = 4/3𝜋𝑅 3 . Conger and Ziskin [4] based their "constant crust" model on the observation that cells proliferate at a constant rate 𝛼 within the proliferating cell rim of the spheroids, the rim is of constant thickness, 𝑘 [13] . This model was modified by Wheldon adding initial exponential growth [26] :
The models described the exponential and the linear phases of spheroid growth. The solution of equation ( 5) is unbounded. Consequently, it does not describe the final plateau phase, and we exclude it from further analysis.
To include the loss of cells, we modified equation ( 5) in analog to the previous models: R '
Again, the loss is assumed to be proportional to spheroid volume, with the rate of loss characterized by the rate constant 3𝑤. Due to simplicity of assumptions, we named this model the "simple spheroid model". Structural models also include more complex model development for growth of tumor spheroids by Landry 𝑒𝑡 𝑎𝑙. [13] and the diffusion model of spheroid growth by Maggelakis and Adam [14] .
Testing the model
To test the adequacy of the model we fit curve generated by the model to the tumor data using the weighted least obtained by minimization of the function
) 2 …………. (7) over the model parameters. Here, 𝐵 i stands for the measured volume at time 𝑡 i , B(𝑡 i ) for the correspounding volume computed from the model and 𝜎 i for the standard deviation of B i . The least squares method can be meaningfully applied when errors in measurement are distributed normally. Measurements used in this paper were obtained as means of 50 volumes and, consequently, the error distribution can be expected to approach the normal distribution, what is testified by analysis of residuals. Since standard deviation of measurements is approximately proportional to the measured volumes, we may apply minimization of
The use of the unweighted least squares method (𝜎 𝑖 = 1 𝑖𝑛 ( 7)) does not give a satisfactory fit. More details on the choice of minimized criterion can be find in [16] . To obtain volumes B(t i ) in (7), some considered differential equation were solved analytically and some numerically by the use of the computer code ODEN [23] . For nonlinear minimaization of the X 2 funtion(18), we combined the Nelder-Mead simplex [21] and the Levenberg-Marquardt minimaization procedures [18] .
To satisfy the nonnegativity constraints on parameters mandated by the models, we used the penalty functions. To quantify the quality of the fits we analyzed normality of residuals
, using the X 2 goodness-of-fit test and the Kolmogorov-Smirnov goodness-of-fit test [12] . Further, we tested the serial correlation of residuals r i by use of the Durbin-Watson test [7,8] and randomness of residuals by the sign test by the runs test [24] . Table 1 summarizes results of analysis of considered models. Gomp-ex model ( 4) and Bertalanfly-Richardson model yielded fits identical to fit by gompertz model, so they are not listed in table. Most of the model resulted with comparable X 2 values. Exceptions are logistic and von Bertalanffy models. They are obviously incapable to describe the data. The same is true for the inhibition model by Wheldon and Cox. Analysis of residuals supports this conclusion. Simple spheroid model is somehow worse than other models but much better than previously mentioned three models. Fits to other data sets [16] approved this conclusion.
| Model | G (3) | GG (4) | L (3) | B (3) | GBL (4) | GTP (5) | HG (4) |
|---|---|---|---|---|---|---|---|
| X2-value | 1796.9 | 1708.6 | 21903.6 | 13101.0 | 1708.6 | 1682.6 | 1750.1 |
| BIC | 45.15 | 45.12 | 486.52 | 293.29 | 45.12 | 46.45 | 47.93 |
| X2 test | 0.68 | 0.46 | 0.46 | 0.68 | 0.10 | ||
| KS test | >0.20 | >0.20 | 0.20 | >0.20 | >0.20 | >0.20 | >0.20 |
| DW test | >0.05 | >0.05 | 0.025 | 0.025 | >0.05 | >0.05 | >0.05 |
| Sign test | 0.55 | 0.55 | 0.02 | 0.23 | 0.55 | 0.37 | 0.55 |
| Runs test | 0.92 | 0.92 | 0.00 | 0.00 | 0.92 | 0.68 | 0.92 |
Table text extracted from the original PDF; superscript letters are shown inline. The original table image is below.
View original table image
Comparison of the models
In the previous section we saw that almost all considered models describe data well. The nesting of some models allowed the section of the most applicable models by the Ftest is based on the statistics
…………………. (8) which follows approximately the F-distribution with m 2 -m 1 and n-m 2 degrees of freedom. Here the values of X 2 (m 1 ) and X 2 (m 2 ) corresponds to the least X 2 values obtained for the nested model defined by m 1 and m 2 free parameters, respectively (m 2 >m 1 ). The fits by model not related by nesting can be compared by the Bayes information criterion (BIC) according to Schwarz:
Where m is the number of free parameter and X 2 (m) corresponds to the least x 2 value. The test is applicable when X 2 (m) is distributed by X 2 -distribution with the expected value n -m. In our case the value oX 2 (m) is larger due to underestimated measurement errors e 1 estimated by, 𝑒̅ 𝑖 . Then the standard deviation can be estimated from the fit to flexible function which is likely to yield low X 2 value (say X 1 2 (m 1 )) and the fit is characterized by m 1 free parameters and by the normally distributed residuals. Namely we can assume that standard deviation are given e i = 𝜌𝑒̅ 𝑖 and determine the fector 𝜌 by imposing X 1 2 (m 1 ) = nm 1 . This procedure implies that BIC takes the form used in this paper:
The value of X 1 2 (m 1 ) was obtained by fitting polynomials to data. We calculated the x 2 values for polynomials of increasing order and chose the lowest order for which changes in x 2 were no longer significanct (P≤0.05 by F-test). According to the above criterian, the preferred fit is characterized by a smaller BIC (9).
In conclusion, we may recapitulate that the Gompertz model, the autostimulation model and the Piantadosi model are models of choice for the description of the MTS growth curve. It is noteworthy to mention that capability of models to describe growth curve data is not the only criterion for its evaluation. Some other criteria, such as prediction of growth curve [17] and estimation of some biological parameters (e.g. doubling time and viable rim thickness [16] ) may be used for the section of an appropriate model.
Figures and tables from the paper
| KS test | >0.20 | >0.20 | >0.20 | >0.20 | >0.20 | >0.20 | >0.20 |
|---|---|---|---|---|---|---|---|
| DW test | >0.05 | >0.05 | >0.05 | >0.05 | 0.025 | IC | >0.05 |
| Sign test | 0.55 | 0.55 | 0.77 | 0.55 | 0.07 | 0.77 | 1.00 |
| Runs test | 0.16 | 0.92 | 0.86 | 0.92 | 0.00 | 0.30 | 0.83 |
Table text extracted from the original PDF; superscript letters are shown inline. The original table image is below.
View original table image
| Model | G | GG | L | B | GBL | GTP | HG |
|---|---|---|---|---|---|---|---|
| (3) | (4) | (3) | (3) | (4) | (5) | (4) | |
| X2-value | 1796.9 | 1708.6 | 21903.6 | 13101.0 | 1708.6 | 1682.6 | 1750.1 |
| BIC | 45.15 | 45.12 | 486.52 | 293.29 | 45.12 | 46.45 | 47.93 |
| X2 test | 0.68 | 0.46 | 0.46 | 0.68 | 0.10 | ||
| KS test | >0.20 | >0.20 | 0.20 | >0.20 | >0.20 | >0.20 | >0.20 |
| DW test | >0.05 | >0.05 | 0.025 | 0.025 | >0.05 | >0.05 | >0.05 |
| Sign test | 0.55 | 0.55 | 0.02 | 0.23 | 0.55 | 0.37 | 0.55 |
| Runs test | 0.92 | 0.92 | 0.00 | 0.00 | 0.92 | 0.68 | 0.92 |
Table text extracted from the original PDF; superscript letters are shown inline. The original table image is below.
View original table image
References
28 in the original paper- Von Bertalanffy L. Untersuchungen iiber die Gesetzlichkeit des Wachstums, vII, Stoffwechseitypen and Wachstumtypen Biol. Zentralbl. 1941, 61510-535.
- Von Bertalanffy L. Quantitative laws in metabolism and growth, Q. Rev. Biol. 1957; 32:217-231.
- Bjerkvig R. (Ed.): Spheroid Culture in Cancer Research. CRC, Boca Raton, 1992.
- Conger AD, Ziskin MC. Growth of mammalian multicellular tumor spheroids, Cancer Res. 1983; 43:556 -580.
- Cook RD, Weisberg S. Linear and Nonlinear Regression, in: Statistical Methodology in the Pharmacological Science, D. A. Bery, ed., Marcel Dekker, New-Yark, 1990, 163-199.
- Cox EB, Woodbury MA, Myers LE. A new model for tumor growth analysis based on apostulated in hibitory substance, Comp. Biomed. Res. 1980; 13:437.
- Durbin J, Watson GS. Testing for serial correlation in least squares regression. I. biometrika 1950; 37:409-428.
- Durbin J, Watson GS. Testing for serial correlation in least squares regression. II. Biometrica 1951; 38:159-177.
- Freyer JP. Role of necrosis in regulating the growth saturation of multicelluler spheroids, Cancer Res. 1988; 48:2432-2439.
- Freyer JP, Sutherland RM. Regulation of growth saturation and development of necrosis by the glucose and oxygen supply Cancer Res. 1986; 46:3513-3520.
- Gompertz B. On the nature of the function expressive of the law of humen mortality, Philos. Trans. Roy. Soc. Londan. 1825; 36:513.
- Kreyszig E. Introductory Mathematical Statistics, Wiley, New York, 1970.
- Landry J, Freyer JP, Sutherland RM. A model for the growth of multicelluler spheroids, Cell Tissue Kinet. 1982; 15:585-594.
- Maggelakis SA, Adam JA. Mathematical model of prevascular growth of a spherical carcinoma, Math. Comput. Modeling. 1990; 13:23-38.
- Marusic M, Bajzer Z. Generalized two-parameter equation of growth, J Math. Anal. Appl. 1993; 179:446462.
- Marusic M. Mathematical model of tumor growth,Lec. Pre. Math. Soc. Osijek, 1996.
- Marusic M, Bajzer Z, Freyer JP, Vuk-Pavlovic S. Analysis of growth of multicellular tumar spheroids by mathematical model, Cell Prolif. 1994; 27:73-94.
- Marusic M, Vuk-Pavlovic S. Prediction power of mathematical models for tumar growth, J of Biological System. 1993; 1:69-78.
- More JJ. The Levenberg-Marquardt algorithm: Implementation and theory. In: Numerical Analysis, G. A. Watson, ed., Springer, New York, 1977.
- Pearl R. Studies in human Biology, Williams & Wilkins, Baltimore, 1924.
- Piantadosi S. A model of growth with first-order birth and death rates, Comp. Biomed. Res. 1985; 18:220-232.
- Press WH, Flannery BP, Teukolsky SA, Vetterling WT. Numerical Recipes, Cambridge University Press, Cambridge, 1986.
- Savageau MA. Allometric morphogenesis of complex system: a derivation of the basic equations from first principles, Proc. Natl. Acad. Sci. USA 1979; 76:60236025.
- Shampine LF, Gordon MK. Computer Solution of ordinary Differential Equations. The Initial Value Problem, Freeman, New York, 1975.
- Siegel S, Castellan NJ, JR. Nonparametric Statistics for the Behawioral Sciences, 2 nd edition, McGraw-Hill, New York, 1988.
- Turner Jr ME, Bradley EL, JR, Kirk KA, Pruitt KM. A theory of growth, Math. Biosci. 1976; 29:367-373.
- Wheldon TE. Mathematical Models in cancer Research, Adam Hilger, Bristol, 1988.
- WHELDON TE, KIRK J, GREY WM. Mitotic autoregulation, growth control and neoplasia, J Theor. Biol. 1973; 38:627.