
Research article · 2018 · Full text
International Journal of Statistics and Applied MathematicsA statistical study on BMI of stress level among college students in Puducherry
Volume 3(2) · Pages 264–267
Research areasSmart Systems and Machine LearningArtificial Intelligence in HealthcareDiverse Scientific Research Studies
Abstract
Author-writtenThis paper focused on “The Body mass index with stress level of college students in Pondicherry”. This paper undergone with primary data collection. The questionnaire was filled by the college students in puducherry in the academic year 2015. Two stage Stratified random sampling is used as the sampling technique. In the first stage of sampling, the population is divided into three strata. In the second stage of sampling, colleges has been stratified based on the type of institution (government or private). Some colleges are selected randomly among all colleges for collecting the samples based on the sampling technique, 250 samples were collected and statistical analysis was carried out.
Summary
Source-checkedPlain-language reading of the full paper, prepared with AI and checked against the text. Each point links to the authors' own words.
Why it matters
- The study examines the relationship between Body Mass Index (BMI) and stress levels among college students in Puducherry (Pondicherry). View evidence ↗
The question
- One of the primary objectives was to identify the specific factors that influence the BMI of college students. View evidence ↗
- The researchers aimed to determine if BMI levels differed significantly based on the type of educational institution the students attended. View evidence ↗
What they did
- The study used a two-stage stratified random sampling technique, first dividing the population into three strata and then stratifying colleges by whether they were government or private. View evidence ↗
- Data was collected via questionnaires from 250 college students in Puducherry during the 2015 academic year. View evidence ↗
- The statistical analysis employed one-way ANOVA, correlation, multiple linear regression, and factor analysis. View evidence ↗
What they found
- A significant difference in BMI was found among different types of institutions (p = 0.000). View evidence ↗
- Underweight status was most common among Arts & Science students, with 55% of students from these colleges falling into this category. View evidence ↗
- The multiple regression model showed that 43.5% of the variation in BMI values can be explained by the chosen explanatory variables. View evidence ↗
- The highest reported stress factors were thinking about the future (mean = 2.57) and class workload (mean = 2.51). View evidence ↗
- The study found that mental stress is more prevalent among college students than physical stress. View evidence ↗
- The vast majority of students (84.4%) followed a non-vegetarian diet, while only 15.6% were vegetarian. View evidence ↗
Visual summary
1 visualsIllustrations explain the paper; charts are replotted from the paper's own table values.
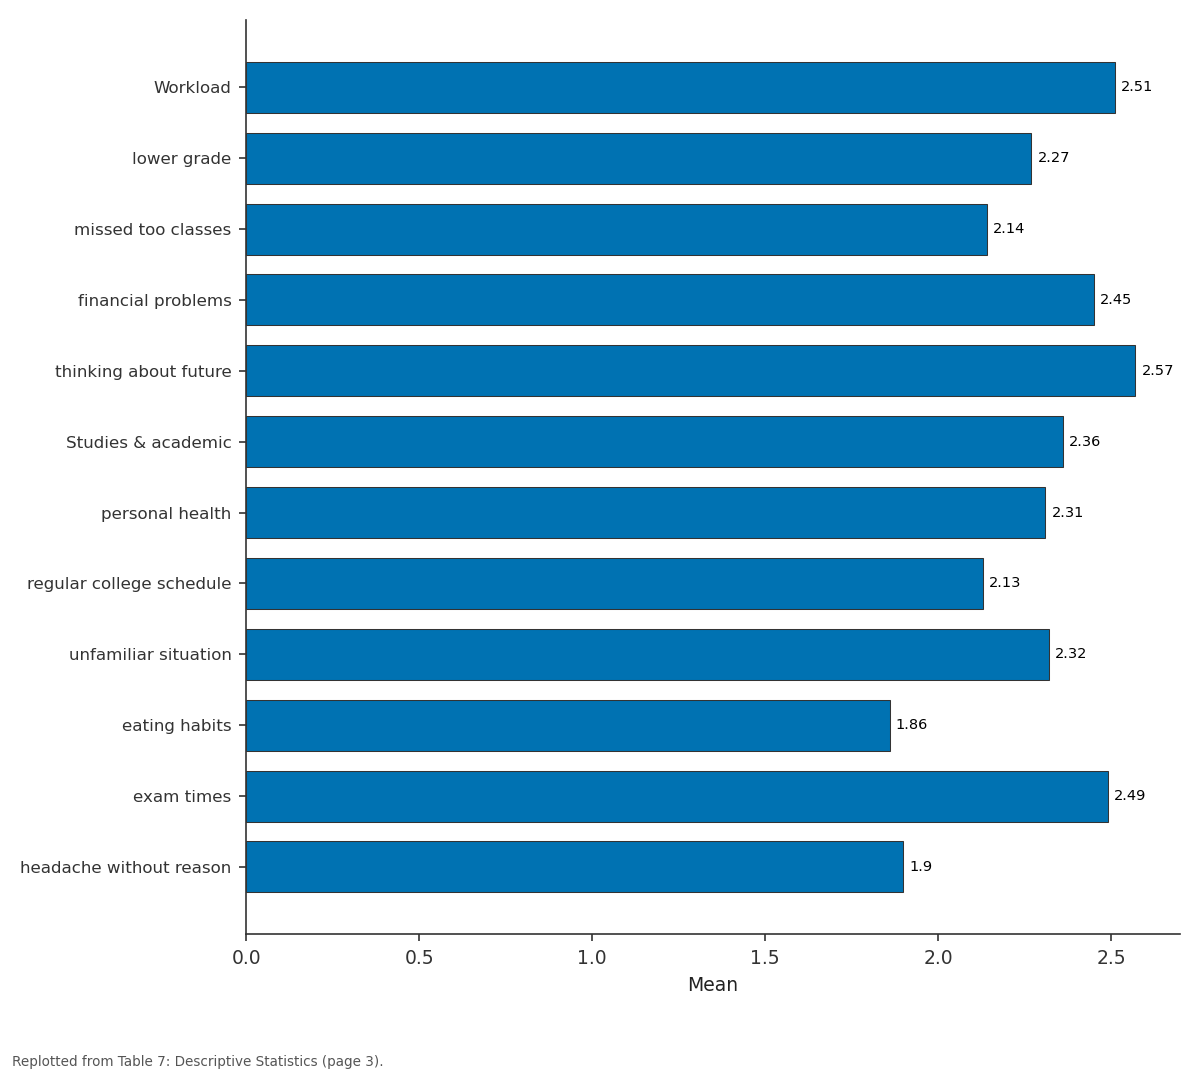
Mean: Workload vs lower grade vs missed too classes vs financial problems vs thinking about future
Replotted from Table 7 (page 3) of the original paper. Every bar is the paper's own table value.
View source evidence ↗Figures & tables
From the original paper Table 4
 Table 1
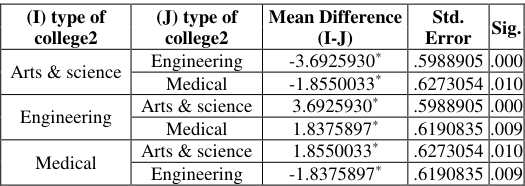 Table 2
 Table 5
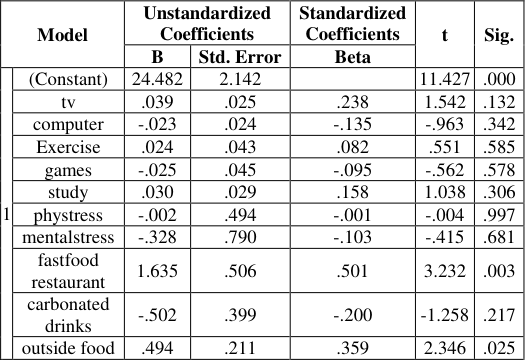 Table 6
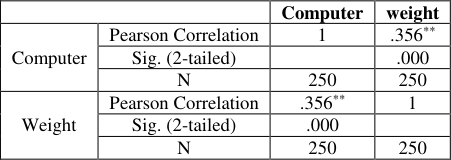 Table 3
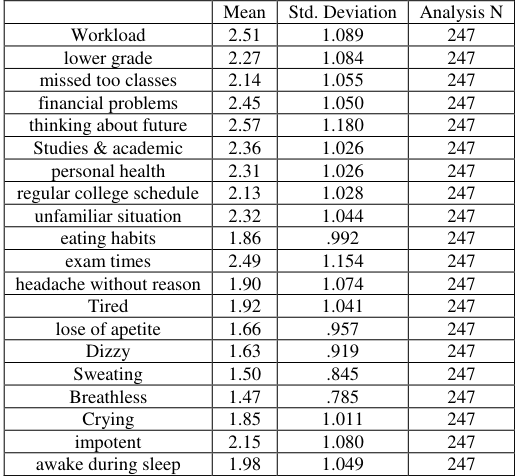 Table 7
 Table 8
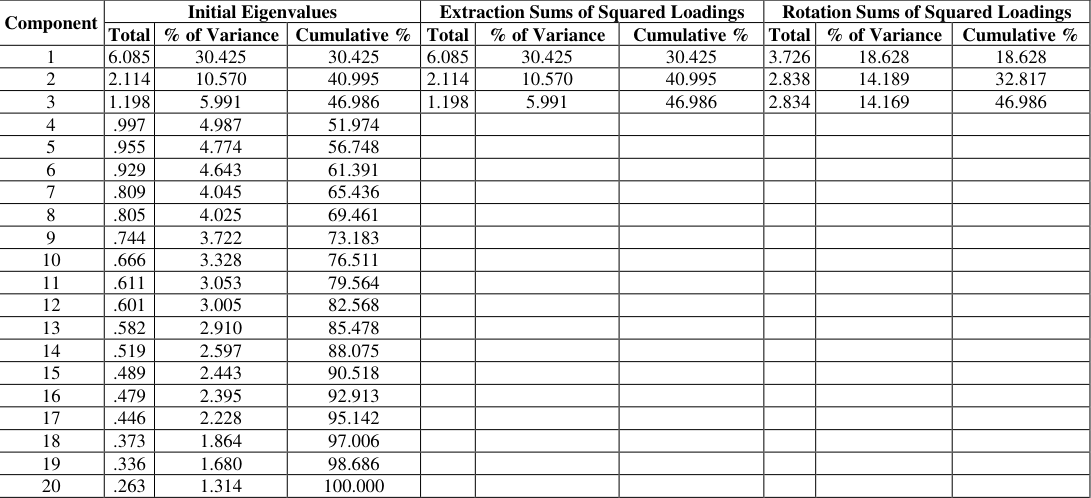 Table 9
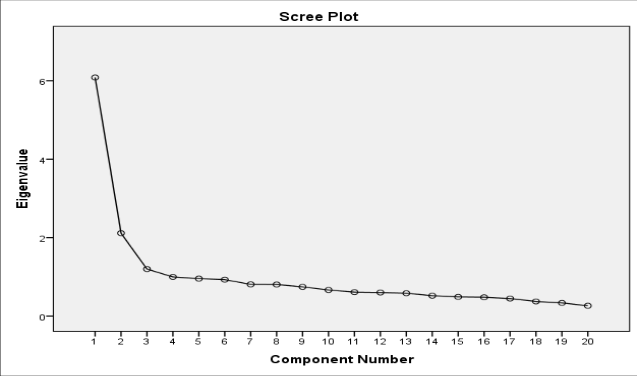 Figure 1
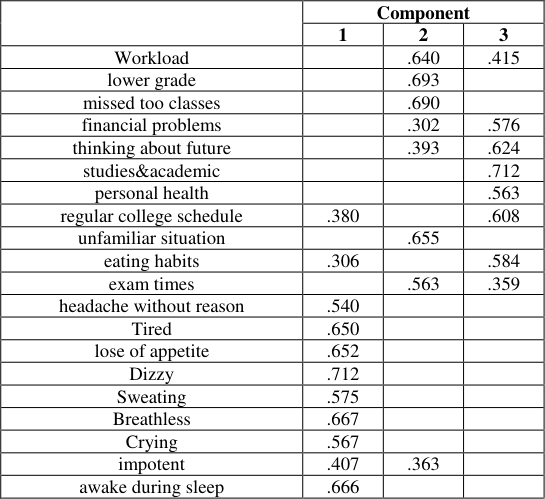 Table 10
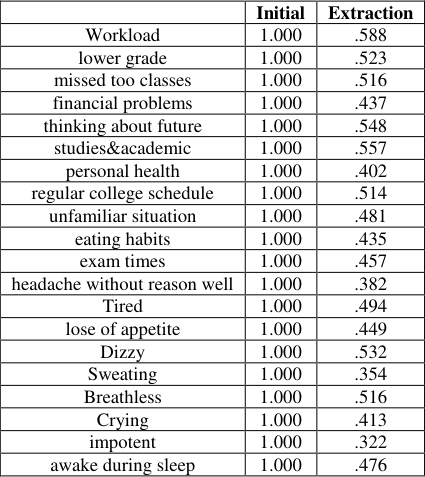 Table 11
Introduction
The BMI level of college students with respect to their stress level among various type of college institutions in Pondicherry were collected as samples and some statistical analysis tools were applied to focus on the following objectives: To find the type of Non-Vegetarian food mostly eaten by the college students. To classify the students based on BMI range from different type of institutions (Arts & Science, Engineering, and Medical). To find the average stress level among the college students based on the type of institution (Governmentor Private) To test whether there is any difference in BMI level based on diet type. To test whether there is any association between BMI range and the type of institutions (Arts & Science, Engineering and Medical) To test whether there is any association between stress level and the type of institutions (Arts & Science, Engineering and Medical) To check whether there is any association between BMI range and type of college1 (Government or Private). To check whether there is any correlation between the weight & time spent for computer. To find the factors influencing the Body Mass Index of the college students.
BMI Weight Categories
Depending on the height and weight, a person can belong to one of the following weight categories:
BMI
Weight Status Below 18.5 Underweight 18.5 -24.9 Normal 25 -29.9 Overweight 30.0 + Obese
The formula for BMI was developed by Belgium Statistician AdolpheQuetelet approximately 150 years ago. This was before the era of electronic calculators; any formula used to indicate weight status needed to be easy for physicians to manually calculate. Only the height and weight values of a person are needed in the equation.
Analysis Part 3.1 One-way ANOVA Aim
To test whether there is any difference in BMI among the type of institutions Hypothesis H0: There is no difference in BMI among the type of institutions H1: There is difference in BMI among the type of institutions From the above Multiple comparisons table, it is observed that all the p-values are less than 0.05, we reject H0 at 5% level of significance. Hence we conclude that the difference occurs between all types of institutions.
correlation Aim
To check whether there is any correlation between the weight & time spent for computer.
Hypothesis H0:
There is no correlation between the weight & time spent for computer. H1: There is correlation between the weight & time spent for computer. From the above correlation table, it is observed that p-value is less than 0.05, So we reject H0 at 5% level of significance. Hence we conclude that there is correlation between the weight & time spent for computer. Also it is observed that weight & time spent for computer are 35.6% positively correlated.
Multiple regression Aim
To find the factors influencing the Body Mass Index of the college students.
Regression
Regression
Factor Analysis Aim
To conduct factor Analysis on the data related to stress From the above Total variance explained table, it is clear that the variation is 46.986%.
Fig 1
The Scree plot depicts the presence of 3 Principal components with eigen values greater than one.
Conclusions
From the results of statistical analysis, 71% of the overweight students are observed from Engineering colleges and 56% of the students are obese from Engineering colleges. So there is a risk factor among engineering college students to expose to obesity. The BMI range, "Underweight" is observed more among Arts & Science college students and 55% students from Arts and Science colleges are underweight. Mental stress is more among college students than physical stress. Major causes of obesity is due to eating at fast food restaurants and eating outside foods. More time spends for Computer tends to gain weight of 35% and 15.6% of the college students in Pondicherry are following vegetarian diet whereas 84.4% are following non-vegetarian diets. Among the students who follows non-vegetarian diets, 33.2% use to eat all kind of non-vegetarian foods.
Reference
Reference
Figures and tables from the paper
| — | Sum of Squares | Df | Mean Square | F | Sig. |
|---|---|---|---|---|---|
| Between Groups | 596.157 | 2 | 298.078 | 19.011 | .000 |
| Within Groups | 3872.712 | 247 | 15.679 | ||
| Total | 4468.869 | 249 |
Table text extracted from the original PDF; superscript letters are shown inline. The original table image is below.
View original table image
| Model | — | Sum of Squares | df | Mean Square | F | Sig. |
|---|---|---|---|---|---|---|
| 1 | Regression | 113.182 | 10 | 11.318 | 2.691 | .015a |
| Residual | 147.209 | 35 | 4.206 | |||
| Total | 260.391 | 45 |
Table text extracted from the original PDF; superscript letters are shown inline. The original table image is below.
View original table image
| Model | — | Unstandardized Coefficients | — | Standardized Coefficients | t | Sig. |
|---|---|---|---|---|---|---|
| B | Std. Error | Beta | ||||
| 1 | (Constant) | 24.482 | 2.142 | 11.427 | .000 | |
| tv | .039 | .025 | .238 | 1.542 | .132 | |
| computer | -.023 | .024 | -.135 | -.963 | .342 | |
| Exercise | .024 | .043 | .082 | .551 | .585 | |
| games | -.025 | .045 | -.095 | -.562 | .578 | |
| study | .030 | .029 | .158 | 1.038 | .306 | |
| phystress | -.002 | .494 | -.001 | -.004 | .997 | |
| mentalstress | -.328 | .790 | -.103 | -.415 | .681 | |
| fastfood restaurant | 1.635 | .506 | .501 | 3.232 | .003 | |
| carbonated drinks | -.502 | .399 | -.200 | -1.258 | .217 | |
| outside food | .494 | .211 | .359 | 2.346 | .025 |
Table text extracted from the original PDF; superscript letters are shown inline. The original table image is below.
View original table image
| — | — | Computer | weight |
|---|---|---|---|
| Computer | Pearson Correlation | 1 | .356** |
| Sig. (2-tailed) | .000 | ||
| N | 250 | 250 | |
| Weight | Pearson Correlation | .356** | 1 |
| Sig. (2-tailed) | .000 | ||
| N | 250 | 250 |
Table text extracted from the original PDF; superscript letters are shown inline. The original table image is below.
View original table image
| — | Mean | Std. Deviation | Analysis N |
|---|---|---|---|
| Workload | 2.51 | 1.089 | 247 |
| lower grade | 2.27 | 1.084 | 247 |
| missed too classes | 2.14 | 1.055 | 247 |
| financial problems | 2.45 | 1.050 | 247 |
| thinking about future | 2.57 | 1.180 | 247 |
| Studies & academic | 2.36 | 1.026 | 247 |
| personal health | 2.31 | 1.026 | 247 |
| regular college schedule | 2.13 | 1.028 | 247 |
| unfamiliar situation | 2.32 | 1.044 | 247 |
| eating habits | 1.86 | .992 | 247 |
| exam times | 2.49 | 1.154 | 247 |
| headache without reason | 1.90 | 1.074 | 247 |
| Tired | 1.92 | 1.041 | 247 |
| lose of apetite | 1.66 | .957 | 247 |
| Dizzy | 1.63 | .919 | 247 |
| Sweating | 1.50 | .845 | 247 |
| Breathless | 1.47 | .785 | 247 |
| Crying | 1.85 | 1.011 | 247 |
| impotent | 2.15 | 1.080 | 247 |
| awake during sleep | 1.98 | 1.049 | 247 |
Table text extracted from the original PDF; superscript letters are shown inline. The original table image is below.
View original table image
| Kaiser-Meyer-Olkin Measure of Sampling Adequacy. | — | .862 |
|---|---|---|
| Bartlett's Test of Sphericity | Approx. Chi-Square | 1524.414 |
| Df | 190 | |
| Sig. | .000 |
Table text extracted from the original PDF; superscript letters are shown inline. The original table image is below.
View original table image
| Component | Initial Eigenvalues | — | — | Extraction Sums of Squared Loadings | — | — | Rotation Sums of Squared Loadings | — | — |
|---|---|---|---|---|---|---|---|---|---|
| Total | % of Variance | Cumulative % | Total | % of Variance | Cumulative % | Total | % of Variance | Cumulative % | |
| 1 | 6.085 | 30.425 | 30.425 | 6.085 | 30.425 | 30.425 | 3.726 | 18.628 | 18.628 |
| 2 | 2.114 | 10.570 | 40.995 | 2.114 | 10.570 | 40.995 | 2.838 | 14.189 | 32.817 |
| 3 | 1.198 | 5.991 | 46.986 | 1.198 | 5.991 | 46.986 | 2.834 | 14.169 | 46.986 |
| 4 | .997 | 4.987 | 51.974 | ||||||
| 5 | .955 | 4.774 | 56.748 | ||||||
| 6 | .929 | 4.643 | 61.391 | ||||||
| 7 | .809 | 4.045 | 65.436 | ||||||
| 8 | .805 | 4.025 | 69.461 | ||||||
| 9 | .744 | 3.722 | 73.183 | ||||||
| 10 | .666 | 3.328 | 76.511 | ||||||
| 11 | .611 | 3.053 | 79.564 | ||||||
| 12 | .601 | 3.005 | 82.568 | ||||||
| 13 | .582 | 2.910 | 85.478 | ||||||
| 14 | .519 | 2.597 | 88.075 | ||||||
| 15 | .489 | 2.443 | 90.518 | ||||||
| 16 | .479 | 2.395 | 92.913 | ||||||
| 17 | .446 | 2.228 | 95.142 | ||||||
| 18 | .373 | 1.864 | 97.006 | ||||||
| 19 | .336 | 1.680 | 98.686 | ||||||
| 20 | .263 | 1.314 | 100.000 |
Table text extracted from the original PDF; superscript letters are shown inline. The original table image is below.
View original table image
| — | Component | — | — |
|---|---|---|---|
| 1 | 2 | 3 | |
| Workload | .640 | .415 | |
| lower grade | .693 | ||
| missed too classes | .690 | ||
| financial problems | .302 | .576 | |
| thinking about future | .393 | .624 | |
| studies&academic | .712 | ||
| personal health | .563 | ||
| regular college schedule | .380 | .608 | |
| unfamiliar situation | .655 | ||
| eating habits | .306 | .584 | |
| exam times | .563 | .359 | |
| headache without reason | .540 | ||
| Tired | .650 | ||
| lose of appetite | .652 | ||
| Dizzy | .712 | ||
| Sweating | .575 | ||
| Breathless | .667 | ||
| Crying | .567 | ||
| impotent | .407 | .363 | |
| awake during sleep | .666 |
Table text extracted from the original PDF; superscript letters are shown inline. The original table image is below.
View original table image
| — | Initial | Extraction |
|---|---|---|
| Workload | 1.000 | .588 |
| lower grade | 1.000 | .523 |
| missed too classes | 1.000 | .516 |
| financial problems | 1.000 | .437 |
| thinking about future | 1.000 | .548 |
| studies&academic | 1.000 | .557 |
| personal health | 1.000 | .402 |
| regular college schedule | 1.000 | .514 |
| unfamiliar situation | 1.000 | .481 |
| eating habits | 1.000 | .435 |
| exam times | 1.000 | .457 |
| headache without reason well | 1.000 | .382 |
| Tired | 1.000 | .494 |
| lose of appetite | 1.000 | .449 |
| Dizzy | 1.000 | .532 |
| Sweating | 1.000 | .354 |
| Breathless | 1.000 | .516 |
| Crying | 1.000 | .413 |
| impotent | 1.000 | .322 |
| awake during sleep | 1.000 | .476 |
Table text extracted from the original PDF; superscript letters are shown inline. The original table image is below.