
Research article · 2019 · Full text
International Journal of Statistics and Applied MathematicsEffect of sampling bias on the family of exponential random graph models
Volume 4(2) · Pages 31–33
Research areasBig Data Technologies and Applications
Abstract
Author-writtenThere is increased use and application of exponential random graphs emanating from use of big data and other techniques. This study sought to establish how sampling bias affects the exponential random graphs. This study was guided by the following objectives: to specify and estimate exponential random graph models with biased sampling, to determine the maximum likelihood estimate for family of exponential random graphs with sampling bias., to determine the suitable sampling method for exponential random graphs and to use the model effect in real life data; a case of opinion polls in Kenya. The study used R software for data analysis from IPSOS Synovate on opinion polls of 2017 in Kenya and realized that there is an intractable Pseudo likelihood for the family of exponential random graphs which was analyzed using the Markov Chain Monte Carlo simulation approach. The study revealed that gender and political affiliation affected the voting pattern of a person in an election at a rate 90.07% and 95.72% respectively. The study recommends use of Metropolis Hastings Monte Carlo simulation in handling the exponential random graphs.
Summary
Source-checkedPlain-language reading of the full paper, prepared with AI and checked against the text. Each point links to the authors' own words.
Why it matters
- Sampling bias occurs when study design or data collection procedures disproportionately favor or disfavor specific individuals or classes. View evidence ↗
- The increase in available network data and scientific interest in distributed systems has driven the development of statistical models for network structure. View evidence ↗
- A common challenge in network modeling is that while models are often designed for entire networks, the available data usually consists only of a sampled sub-network. View evidence ↗
The question
- The study aimed to determine the effect of sampling bias on exponential random graphs (ERGMs). View evidence ↗
- The research objectives included specifying and estimating ERGMs with biased sampling, determining maximum likelihood estimates, identifying suitable sampling methods, and applying the model to Kenyan opinion poll data. View evidence ↗
What they did
- The study used 2017 Kenyan presidential candidate opinion poll data collected by IPSOS Synovate. View evidence ↗
- Data analysis was performed using R software, employing a Markov Chain Monte Carlo (MCMC) simulation approach to handle intractable pseudo-likelihoods. View evidence ↗
- The analysis assessed several variables, including voter registration status, household economic conditions, security issues, and presidential vote preferences. View evidence ↗
What they found
- The study found that political affiliation (95.72%) and gender (90.07%) significantly affected individual voting patterns. View evidence ↗
- There was a positive correlation of 83.46% between edges and the fixed.0.25 variable. View evidence ↗
- Political affiliation showed a strong positive correlation with sex at 86.71%. View evidence ↗
- Auto-correlation analysis showed that increasing lags led to a decrease in the correlation coefficient, with values dropping from 0.755 to 0.652. View evidence ↗
What it means
- The authors recommend using Metropolis-Hastings Monte Carlo simulations for managing exponential random graphs. View evidence ↗
- The authors conclude that while the ERG approach can explore invisible network statistics, the resulting distributions are dependent on the chosen model. View evidence ↗
- The authors note a limitation where the model may faithfully reproduce its own specifications without necessarily representing the actual population. View evidence ↗
Visual summary
3 visualsIllustrations explain the paper; charts are replotted from the paper's own table values.
Network Sampling Bias Concept
AI-generated conceptual illustration (a complex network of interconnected nodes and edges). It explains the idea and does not show study data.
View source evidence ↗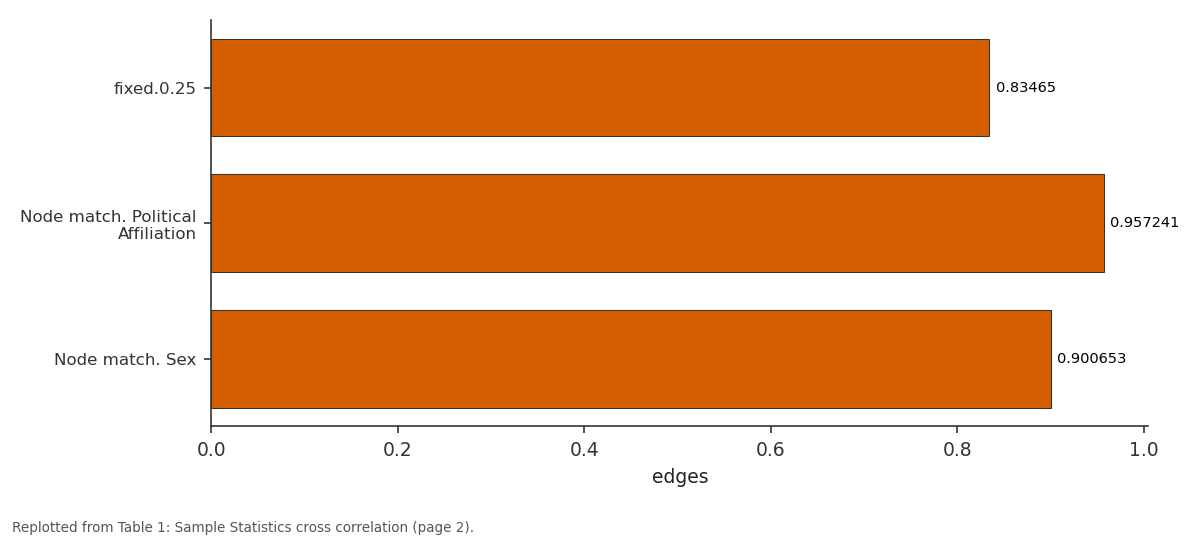
edges: fixed.0.25 vs Node match. Political... vs Node match. Sex
Replotted from Table 1 (page 2) of the original paper. Every bar is the paper's own table value.
View source evidence ↗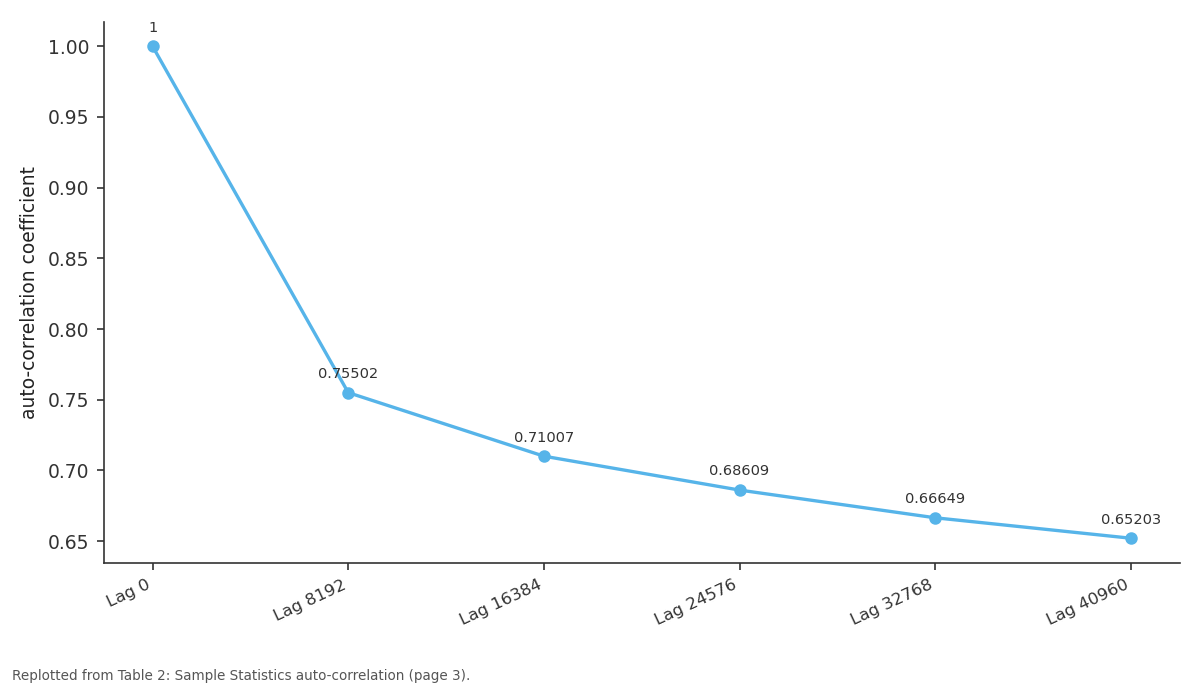
Edges: Lag 0 vs Lag 8192 vs Lag 16384 vs Lag 24576 vs Lag 32768
Replotted from Table 2 (page 3) of the original paper. Every bar is the paper's own table value.
View source evidence ↗Figures & tables
From the original paper Table 1
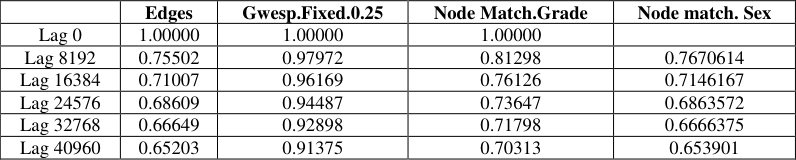 Table 2
Introduction
Common causes of sampling bias lies in the design of the study or in the data collection procedure, either of which may favor or disfavor collecting data from certain classes or individuals or in certain conditions. Sampling bias is also particularly prominent whenever researchers adopt sampling strategies based on judgment or convenience, in which the criterion used to select samples, is somehow related to the variables of interest. For example, in opinion poll, a researcher collecting opinion data may choose, because of convenience, to collect opinions mostly from college students because they happen to live nearby, and this will further bias the sampling toward the opinion prevalent in the social class living in the neighborhood. This procedure is intended to complement the likelihood approach developed by [1] by providing a practical means of estimation when the size of the complete network is unknown and/or the complete network is very large. We report the outcome of a simulation study with a known model designed to assess the impact of initial sample size, population size, and number of sampling waves on properties of the estimates. We conclude with a discussion of the potential applications and further developments of the approach. As noted by [2] , a growing availability of network data and of scientific interest in distributed systems has led to the rapid development of statistical models of network structure. Typically, however, these are models for the entire network, while the data consists only of a sampled sub-network. Parameters for the whole network, which is what is of interest, are estimated by applying the model to the sub-network. This assumes that the model is consistent, or, in terms of the theory of stochastic processes, that it defines a projective family. The class of exponential random graph models (ERGMs), that show apparent trivial condition to have been violated by many popular and scientifically appealing models, and that satisfying it drastically limits ERGM's expressive power [2] . These study actually uses ERGMs in case where sampling is biased and shows whether the parameter to be estimated are consistent as a common property.
Estimation of parameters in exponential random graph model, also known as the p_ model, using frequentist Markov chain Monte Carlo (MCMC) methods is the easiest and most accurate method since some likelihood are intractable. The exponential random graph model is simulated using Gibbs or Metropolis-Hastings sampling. Our study considered estimation procedures that are based on the Robbins-Monro algorithm for approximating a solution to the likelihood equation [3] . One of the major problem with exponential random graph models is the fact that such models can have, for certain parameter values, bimodal (or multimodal) distributions for the sufficient statistics such as the number of ties. The bimodality of the exponential graph distribution for certain parameter values seems a severe limitation to its practical usefulness [4] . in his mathematical analysis of the Engel demand model in the exponential form observed properties of this exponential model. For the analysis of the income-demand elasticity of the developed exponential form, the model offers the static hyperbolic function:
The derived hyperbolic function of the income-demand elasticity falls digressively and the simulated values tend to the zero level. In analyzed time period (1995-2000), the income-demand reactions were simulated in the elastic form with the values from 1.3866 to 1.1340. The average level of the analyzed income demand elasticity between the observed years reached the value of 1.2121, thus the 1% rise in the real level of the quarter households' incomes per capita led to the average increase in the average Czech household's demand for meat and meat products, including fish and fish products, of about 1.21%. The study seeks to use exponential model in electricity consumption modeling.
Methodology 2.1 Description of Data set used
The research questions were answered by utilizing the data on opinion polls in Kenya that was conducted in 2017 in regard to most preferred presidential candidate conducted by IPSOS Synovate. The survey assessed the social, economic, cultural and political aspects of voters in Kenya in readiness for the election. The following items were assessed Voter Registration Status, Household Economic Conditions, Kenya's Direction, Security Issues, and Presidential Election Vote-Preferences. This are the same item that were evaluated during the study.
Model Building 2.2.1 Estimation of Exponential Random graphs with
Biased Sample [5] and [6] proposed the p_ model for social networks, generalizing the Markov graph distribution of [7] , also called the Exponential Random Graph Model, ERGM;
Where 𝑘(𝜃) = ∑ exp {𝜃 𝑡 g(𝑧)
𝑎𝑙𝑙 𝑝𝑜𝑠𝑠𝑖𝑏𝑙𝑒 𝑔𝑟𝑎𝑝ℎ𝑠 𝑧 } 𝜃is a parameter vector to be estimated 𝑔(𝑦) -user defined vector of graph statistics
Maximum Likelihood Estimation for the Family of Exponential Random Graphs with Bias
The log-likelihood function is estimated as:
MLE maximizes of the likelihood Many times likelihood is sometimes intractable. We use Pseudo likelihoods which is:
Pseudo likelihoods ignore the conditioning but assume instead that;
Pseudo likelihood equals ∏ exp {𝜃 𝑡 𝜎(𝑦 𝑜𝑏𝑠 ) 𝑖𝑗 }𝑦 𝑖𝑗 𝑜𝑏𝑠 1+exp {𝜃 𝑡 𝜎(𝑦 𝑜𝑏𝑠 ) 𝑖𝑗 } 𝑖≠𝑗 (5) The idea is to maximize a penalized likelihood which induces a bias in the score function in order to reverse the some of the anticipated bias in the maximizer. The penalized likelihood is:
The resulting maximizer is also the Bayesian maximum posterior estimator based on assigning a Jeffreys prior to the parameter. Lagging of the data further resulted in a strong positive relationship between the variables. Lagging at 0 the coefficient were 100% for all variables respectively. The increase in lags resulted in the decrease the correlation coefficient. 0.755, 0.71, 0.686, 0.666 and 0.652
Results
The MCMC sample statistics are varying randomly around the observed values at each step (so the chain is "mixing" well) and the difference between the observed and simulated values of the sample statistics have a roughly bell-shaped distribution, centered at 0. The saw tooth pattern visible on the degree term deviation plot is due to the combination of discrete values and small range in the statistics: the observed number of degree 1 nodes is 3, and only a few discrete values are produced by the simulations. So the saw tooth pattern is an inherent property of the statistic, not a problem with the fit. That additional feature of the network would also be reproduced. But starting with simple models can help to identify whether and how the aggregate statistics we observe from an egocentric sample deviate from those we would expect from the model.
Conclusions
Conclusions
Recommendations
If we take all of the observed statistics without a saturated model, we cannot reject the hypothesis that this model produced the network we sampled from. ERG approach can be used to explore network statistics that are not visible but it must always be remembered that the distributions we will produce are based on our model. They faithfully reproduce the model, but that does not mean that the model faithfully represents the population. These results show computational algorithms in ERGM use MCMC to estimate the likelihood function that is a dependent term in the model. The process involves simulating a set of networks to use as a sample for approximating the unknown component of the likelihood the 𝑘(𝜃) term in the denominator.
Acknowledgement
Acknowledgement
Figures and tables from the paper
| — | Edges gwesp. | fixed.0.25 | Node match. Political Affiliation | Node match. Sex |
|---|---|---|---|---|
| edges | 1.0000000 | 0.8346505 | 0.9572414 | 0.9006526 |
| gwesp.fixed.0.25 | 0.8346505 | 1.0000000 | 0.8550279 | 0.779703 |
| Node match. Political Affiliation | 0.9572414 | 0.8550279 | 1.0000000 | 0.8670579 |
| Node match. Sex | 0.9006526 | 0.779703 | 0.8670579 | 1.0000000 |
Table text extracted from the original PDF; superscript letters are shown inline. The original table image is below.
View original table image
| — | Edges | Gwesp.Fixed.0.25 | Node Match.Grade | Node match. Sex |
|---|---|---|---|---|
| Lag 0 | 1.00000 | 1.00000 | 1.00000 | |
| Lag 8192 | 0.75502 | 0.97972 | 0.81298 | 0.7670614 |
| Lag 16384 | 0.71007 | 0.96169 | 0.76126 | 0.7146167 |
| Lag 24576 | 0.68609 | 0.94487 | 0.73647 | 0.6863572 |
| Lag 32768 | 0.66649 | 0.92898 | 0.71798 | 0.6666375 |
| Lag 40960 | 0.65203 | 0.91375 | 0.70313 | 0.653901 |
Table text extracted from the original PDF; superscript letters are shown inline. The original table image is below.
View original table image
References
7 in the original paper- Snijders TAB, Pattison PE, Robins G, Handcock MS. New specifications for exponential random graph models. Sociological Methodology, 2006, 99-153.
- Cosma Rohilla Shaliziand, Alessandro Rinaldo. Consistency under Sampling of Exponential Random Graph Models. Carnegie Mellon University Research Showcase @ CMU, 2012, arXiv:1111.3054v3. [math.ST] 30
- Snijders TAB. MCMC Estimation of Exponential Random Graph Models. Journal of Social Structure. 2002; 3:2.
- Pavel Syrovátka. Exponential model of the Engel curve: Application within the income elasticity analysis of the Czech households' demand for meat and meat products, Unpublished Ph.D., Mendel University of Agriculture and Forestry Brno, Zemědělská 1, 61300 Brno, Czech Republic, 2007.
- Snijders TAB, Pattison PE, Robins G, Handcock MS. New specifications for exponential random graph models. Sociological Methodology, 2006, 99-153.
- Wasserman S, Pattison P. Logit models and logistic regression for social networks: I. An introduction to Markov graphs and p_. Psychometrika. 1996; 61:401425.
- Frank O, Strauss D. Markov graphs. Journal of the American Statistical Association. 1986; 81:832-842.