
Research article · 2020 · Full text
International Journal of Statistics and Applied MathematicsMarkovian analysis of a birth-death process
Volume 5(2) · Pages 22–25
Research areasTransportation Planning and OptimizationTransportation and Mobility InnovationsAdvanced Queuing Theory Analysis
Abstract
Author-writtenMarkovian models basically refers to models which, largely, relies on the present state to predict the future. A birth process refers to the arrival of a customer to a system and a death process explains the departure of a customer from a system. This study modelled queues at the revenue collection points using the Markovian birth-death analytical models. The traffic intensity and waiting times were estimated from the secondary data collected from the revenue collection point. The focus was on Markovian queuing systems with infinite capacity that is M/M/m models, where m≥1. The queuing model employed at Bus Park Revenue collection point was identified to be M/M/2. The traffic intensity of the service station was estimated and it was discovered that the Birth rate > death rate, that is ρ2 =1.029412, indicating that the system was unstable. This indicated that the queue could grow indefinitely. As a result it was difficult to obtain other performance parameters. As a remedy, this study resorted to addition of a server with same rate of service, 70 customers/hr, to the system. This study assumed that the service distribution was the same for all the servers. On addition of a server the estimated number of customers in the system reduced significantly. After conducting queue analysis, this study concluded that the system at Bus Park Revenue collection point was not stable. This study recommended the addition of a server to the revenue collection point. Additionally, future researchers should conduct a non Markovian analysis of a birth-death process to determine if the same results could be realized.
Summary
Source-checkedPlain-language reading of the full paper, prepared with AI and checked against the text. Each point links to the authors' own words.
Why it matters
- In queuing theory, a birth process represents customers arriving at a system, while a death process represents their departure. View evidence ↗
- Queuing analysis is used by organizations to improve the quality of service delivery, as long queues are often perceived as a sign of inefficiency. View evidence ↗
- Markovian models are stochastic processes where future states depend only on the current state, not on past behavior. View evidence ↗
The question
- The study aimed to model queues at revenue collection points using Markovian birth-death analytical models to estimate traffic intensity and waiting times. View evidence ↗
What they did
- The research focused on M/M/m queuing systems, which are Markovian systems with infinite capacity and one or more servers. View evidence ↗
- The analysis used secondary data from the Bus Park revenue collection point, with an estimated arrival rate of 70 customers per hour and a service rate of 34 customers per hour per channel. View evidence ↗
- To address system instability, the study simulated the addition of servers with the same service rate to the system. View evidence ↗
What they found
- The initial system was identified as M/M/2 with a traffic intensity (ρ2) of 1.029412; because the birth rate exceeded the death rate, the system was unstable. View evidence ↗
What it means
- The authors concluded that an M/M/3 system with infinite capacity is the most suitable configuration for the Bus Park revenue collection point. View evidence ↗
- The study concluded that 3 servers allow the system to operate at an optimum rate where no server remains idle. View evidence ↗
- The authors recommend that future research employ non-Markovian methods to determine if similar results are obtained. View evidence ↗
- The authors suggest that future studies should investigate the service rate of servers and the resources provided to them, rather than just the number of servers. View evidence ↗
Visual summary
1 visualsIllustrations explain the paper; they do not show study data.

Impact of Server Addition on System Stability
AI-generated conceptual illustration (computer servers and a queue of digital data packets). It explains the idea and does not show study data.
View source evidence ↗Figures & tables
From the original paper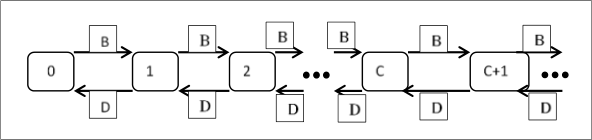 Figure 1
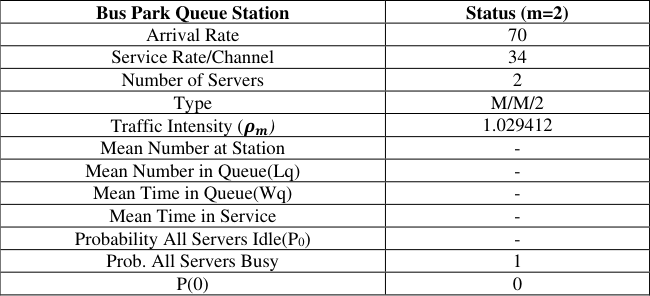 Table 1
 Table 2
Introduction
A Markovian process is a stochastic process with the property that the current/present state is not influenced by the previous/past states. In other words, the chance of any future behavior of processes, when its current/present state is known, is not altered by additional knowledge concerning its past behavior [1] . A birth-death process is a CTMC where the state transitions are only of two types, that is Births (inputs) and deaths (outputs). When births occur in a system with n objects, it is presumed that the state transitions from 𝑛 𝑡𝑜 𝑛 + 1 that is the state increase by one. When a death occurs, it is also presumed that the state transitions from 𝑛 𝑡𝑜 𝑛 -1 that is the state decrease by one [2] . Birth-Death processes have many applications in real life situation. The Birth -death process can be applied in epidemiological studies, demography, queuing theory, and in engineering sector. In a non-random environment, the birth-death process in queuing models tend to be long term averages, so the average rate of arrival is given as B and the average service rate given as D [3] . In M/M/s queuing systems the arrivals into a service facility are considered to be inputs (Births) and the numbers served from a service facility are considered to be outputs (Deaths) [4] . A birth-death process is a special kind of CTMC that has applications in queuing systems. If the arrivals to a queuing system are according to a Poisson process and the service times are exponentially distributed then the resulting queuing system is a birth-death process [2,3,5] . Most of the queuing models fit the birth-death process. A birth refers to a customer arrival-this leads to an increase in the number of customers in the system from n to n+1 and a death occurs when a customer leaves the system after being attended to leading to a decrease in the number of customers in the system from n to n-1. A queuing system based on the birth-death process is in state E n at time t if the number of customers is then n, that is N(t)=n [3,6] . Letter B and D in figure 2 indicates the birth and death rates respectively. The transition rates in the birth processes are triggered by the arrivals and the death processes are triggered by the service rendered by the server(s). The transitions occur between the neighboring states [3] . Birth and death processes may be applied in studying the evolution of certain bacteria in a system of an organization, the number of people with a certain disease in a defined population, the number of customers in a queue in a certain organization a good example is the supermarket, banks, school student finance, student mess in universities, number of vehicles in a queue and customers waiting to be shaved in a barber shop [1] . The aim of many business organizations is to provide quality services to their customers. Customers consider a system to be inefficient when they find long queues. The main aim of queuing analysis is to improve on the quality of service delivery rather than quantity in organizations [7] .
Methodology
According to [8] , the following cases may arise; if 𝑛 < 𝑚, then there will be no queuing customers but we will have (2 -𝑚) idle servers. The combine birth rate will be 𝐷 𝑚 = 𝑚 * 𝐷 and if 𝑛 ≥ 𝑚, then no server will be idle. The maximum number of public service vehicles waiting will be 𝑛 -𝑚. The combined input rate will be 𝐷 𝑚 = 𝑚 * 𝐷. M/M/c queuing system is a birth-death process since there are arrivals and departures from the system (Kulkarni, 2011). According to [2] , B n = B and
Substituting B i and D i to the steady-steady state equation
Where n refers to the number of vehicles in the system. We have:
Where m stands in for the number of servers in the system.
With 𝜌 𝑚 = 𝐵 𝑚 * 𝐷 (traffic intensity/utilization rate), P n can be re-written as;
The probability of vehicles queuing P w = the probability of an arriving vehicle finding all the servers busy is:
The expected number of vehicles (not in service) in queue L q ;
The average time spent by the vehicles in the system (W s ), this involves the queued plus the serviced vehicles:
The expected number of vehicles in the system:
Results
Results
Estimation of System Performance Parameters
This study assumed that the servers worked at the same rate and they were of the same distribution. Kisii County Government estimated arrival rate and service rates per hour specific for Bus Park revenue collection point are 70 customers and 34 customers respectively. The parameters were estimated as indicated below. The queuing system is classified as M/M/2. However, the utilization factor is 1.0294. The system was expected to be unstable hence lacking the steady state solutions.
Developing a multi-server model (𝒎 > 𝟐)
The traffic intensity = 1.0294 was used as a basis of determining the number of servers to be used at Bus Park revenue collection point. The inter-arrival and service time distribution is Markovian. Table 2 below represents the sensitivity analysis to the number of servers. The findings in table 2 indicate that the system stabilizes when a server is added. On addition of one sever the traffic intensity changes from 1.029412 to 0.6863 and the average waiting time in a queue becomes 0.0295 hours =1.77 minutes. On addition of two more servers the traffic intensity changes from 1.029412 to 0.5147 and the average waiting time becomes 0.0057 hours=21 seconds. It is evident from the table that when the number of servers is increased to 3 the queuing system becomes stable. This implies that D > B. Additionally, the Ls estimated at 3.0922 customers while L q becomes 1.0333 customers. This shows that the number of vehicles waiting in a queue reduced significantly. The P 0 increases when a server is added hence were indicating an increase in the chance of a customer being served immediately. The P w decreased from 1 to 0.4724 indicating an improving system when we have additional servers. To affirm the choice of 3 servers, the least number expected in the system is 3 customers in to keep the servers busy. In a system with 𝝆 𝟑 = 0.6863, L s = 3.0922 customers hence meeting the minimum requirement of customers in the system. Therefore this study concluded that the system suitable for Bus Park revenue collection point is M/M/3 with infinite capacity and a waiting time of 1.77 minutes.
| M | B | D | 𝝆 𝒎 | Ls | Lq | Ws | Wq | P0 | Pw |
|---|---|---|---|---|---|---|---|---|---|
| 2 | 70 | 34 | 1.0294 | - | - | - | - | 0 | 1 |
| 3 | 70 | 34 | 0.6863 | 3.0922 | 1.0333 | 0.0883 | 0.0295 | 0.1019 | 0.4724 |
| 4 | 70 | 34 | 0.5147 | 2.259 | 0.2001 | 0.0645 | 0.0057 | 0.1223 | 0.1887 |
| 5 | 70 | 34 | 0.4118 | 2.1052 | 0.0464 | 0.0601 | 0.0013 | 0.1265 | 0.0663 |
Table text extracted from the original PDF; superscript letters are shown inline. The original table image is below.
View original table image
Conclusion
Since the traffic intensity = 1.0294 > 1, this study concluded that the system at Bus Park Revenue collection point was unstable. Therefore, it was not possible to estimate the performance parameters. On addition of a server to the queuing system the system traffic intensity = 0.6863. Thus this study concluded that the system stabilizes on addition of a server. This made it possible to estimate the performance parameters of the system. The number in the system after adding a server to the queuing system = 3 indicating that no server will be idle. Therefore, this study concluded that the system will operate at an optimum rate with 3 servers.
Recommendations
Since this study looked into Markovian methods, future researchers should look into other methods such as non-Markovian methods to estimate performance of queuing models. This study concentrated on the number of servers that could be added to the system to increase efficiency at the revenue collection point. Future studies should turn the attention to the speed/ service rate of servers and/ or the resources availed to the servers. Future researchers can employ other methods to analyze the flow of traffic like the microscopic and/ or macroscopic methods to determine if the traffic flow has a bearing in determining the service rate of the servers.
Acknowledgement
Several individuals gave me a hand in the preparation of this article. Your injections were crucial in the process of drafting this article. Special thanks to Kisii County government for allowing me to conduct my study. Thank you very much.
Figures and tables from the paper
| Bus Park Queue Station | Status (m=2) |
|---|---|
| Arrival Rate | 70 |
| Service Rate/Channel | 34 |
| Number of Servers | 2 |
| Type | M/M/2 |
| Traffic Intensity (𝝆 ) 𝒎 | 1.029412 |
| Mean Number at Station | - |
| Mean Number in Queue(Lq) | - |
| Mean Time in Queue(Wq) | - |
| Mean Time in Service | - |
| Probability All Servers Idle(P0) | - |
| Prob. All Servers Busy | 1 |
| P(0) | 0 |
Table text extracted from the original PDF; superscript letters are shown inline. The original table image is below.
View original table image
References
8 in the original paper- Howard M Taylor, Samuel Karlin. An introduction to Stochastic Modeling (3rd edition ed.). Carlifornia: Academic Press, 1998.
- Kulkarni V. Introduction to modeling and Analysis of Stochastic Systems (second edition ed.). Newyork: Springer Science + Business Media, 2011.
- Gargoyle I. Birth-Death process. Retrieved July 25, 2017, from Wikipedia: https://en.m.wikipedia.org/wiki/birth-deathprocess, 2016.
- Joshua OO. On Markovian Queuing Model as Birth-Death Process. Global Journal of Science Frontier Research, 2013, pp. 21-40.
- Spivey M. Retrieved July 20, 2013, from wordpress, 2013. https://mikespivey.wordpress.com/2013/11/08/birth-and-deathprocess-steady-state-probabilities/
- Augustine Dushime et al. Queuing model for healthcare services in public health facilities. International journal of mathematics and physical sciences, 2015, 77-93.
- Steve WNS. Applications of Queueing systems in real life situations (vol2). Chiccago: springer, 2014.
- Bonga WG. An Empirical Analysis of Queuing Theory and Customer Satisfaction: Application to Small and Medium Enterprises, 2013, 1-57.