
Research article · 2020 · Full text
International Journal of Geography Geology and EnvironmentQuality of life in Bulandshahr district: A spatial analysis
Volume 2(1) · Pages 39–43
Research areasPsychological Well-being and Life Satisfaction
Abstract
Author-writtenThis paper is based on secondary data taken from the district handbook of Bulandshahr (census, 2011).This paper shows the quality of life with the spatial variation in tehsils. There are 7 tehsils in Bulandshahr District and the variation made on the basis of z-score technique. Z-score is the technique that measures the quality of life in different regions. The quality of life has measured on the basis of basic amenities like household, water facility, electricity and bank services. In the different tehsils of Bulandshahr District perform the level of Composite score represents the quality of life. The composite score shows the different variations in respect to quality of life according to Tehsil wise, Debai represents the high level of quality and the five other tehsils namely, Sikandrabad, Siana, Anupshahr, Khurja and Bulandshahr have medium level of the quality of life. While, only one Shikarpur has low level of quality of life. Thus, the overall performance of the district represents the moderate level of quality. Because the majority of the district shows medium quality of life.
Summary
Source-checkedPlain-language reading of the full paper, prepared with AI and checked against the text. Each point links to the authors' own words.
Why it matters
- Basic amenities such as housing conditions, drinking water, and sanitation are believed to contribute to health improvements and determine a society's overall quality of life. View evidence ↗
- Urban planning and management focus on improving facilities and services that meet socio-economic needs to raise the general quality of life. View evidence ↗
The question
- The study aims to analyze the current quality of life and development progress in the Bulandshahr district, specifically focusing on spatial variations. View evidence ↗
What they did
- The research utilized secondary data sourced from the 2011 census district handbook of Bulandshahr. View evidence ↗
- Quality of life was measured using four specific indicators: permanent houses, drinking water, banking services, and power supply. View evidence ↗
- The researchers used z-scores to calculate a composite score for each tehsil, categorizing them as low (≤ -0.5), medium (-0.5 to 0.5), or high (≥ 0.5). View evidence ↗
What they found
- Water facility access was high (>0.5 z-score) in Anupshahr and Debai, medium (-0.5 to 0.5 z-score) in Shikarpur and Bulandshahr, and low (< -0.5 z-score) in Sikandrabad, Siana, and Khurja. View evidence ↗
- Overall quality of life was high in Debai, medium in Sikandrabad, Siana, Anupshahr, Khurja, and Bulandshahr, and low in Shikarpur. View evidence ↗
- The overall performance of the Bulandshahr district is characterized as having a medium quality of life. View evidence ↗
What it means
- The authors conclude that the government should provide special attention and care to the regions identified as having a low level of quality of life. View evidence ↗
Visual summary
2 visualsIllustrations explain the paper; charts are replotted from the paper's own table values.
Z-Score Categorization Logic
AI-generated conceptual illustration (A geographical map of Bulandshahr district divided into administrative tehsils). It explains the idea and does not show study data.
View source evidence ↗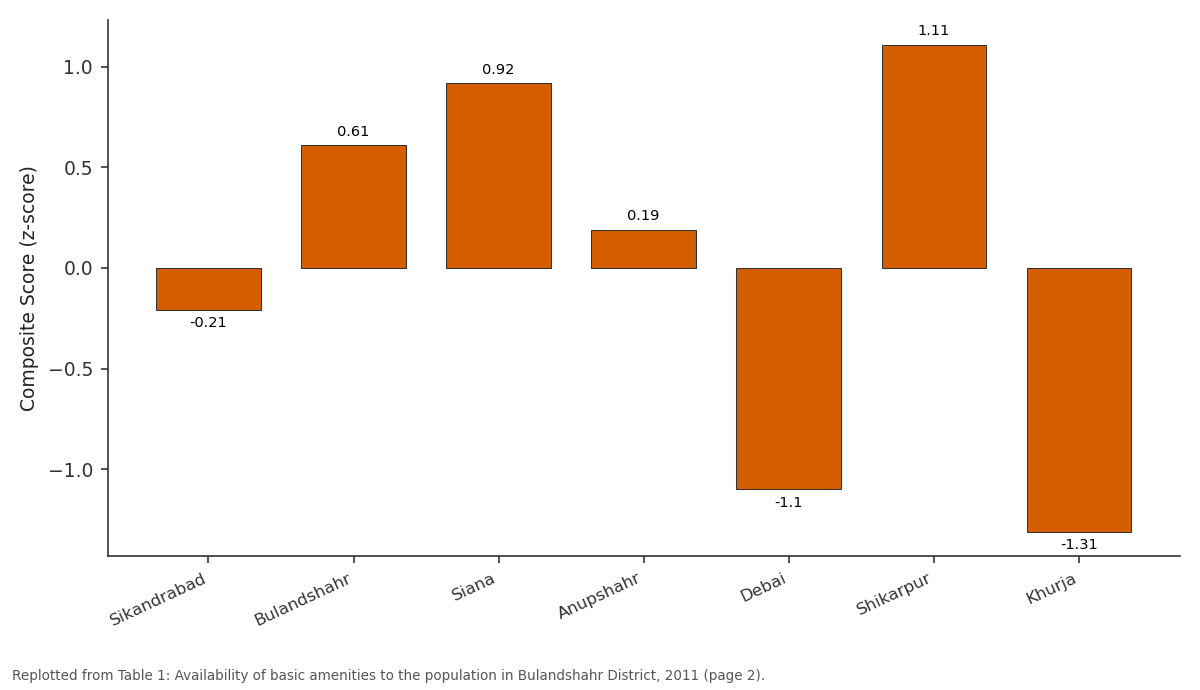
Electricity (z-score): Sikandrabad vs Bulandshahr vs Siana vs Anupshahr vs Debai
Replotted from Table 1 (page 2) of the original paper. Every bar is the paper's own table value.
View source evidence ↗Figures & tables
From the original paper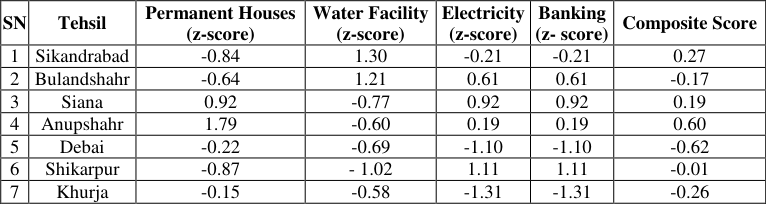 Table 1
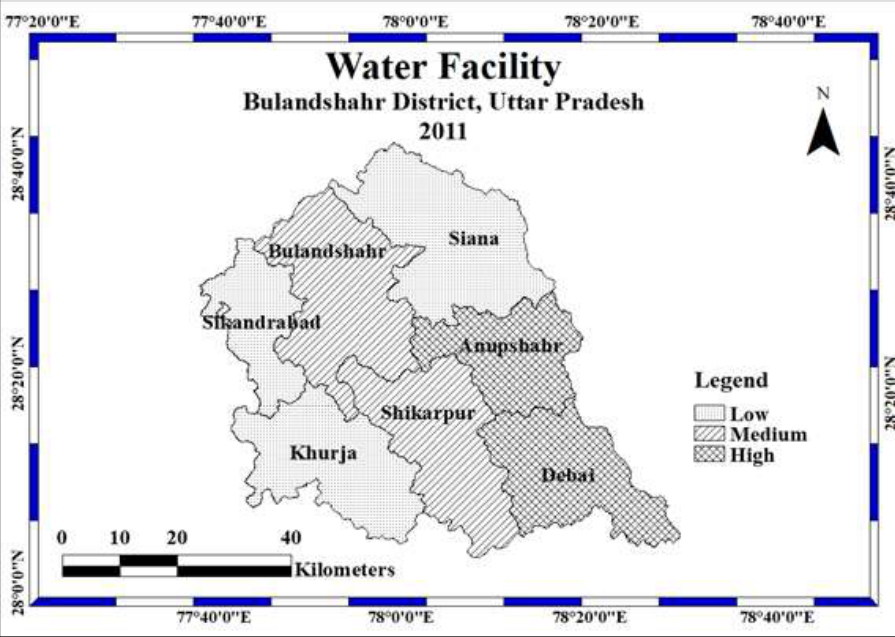 Figure 2
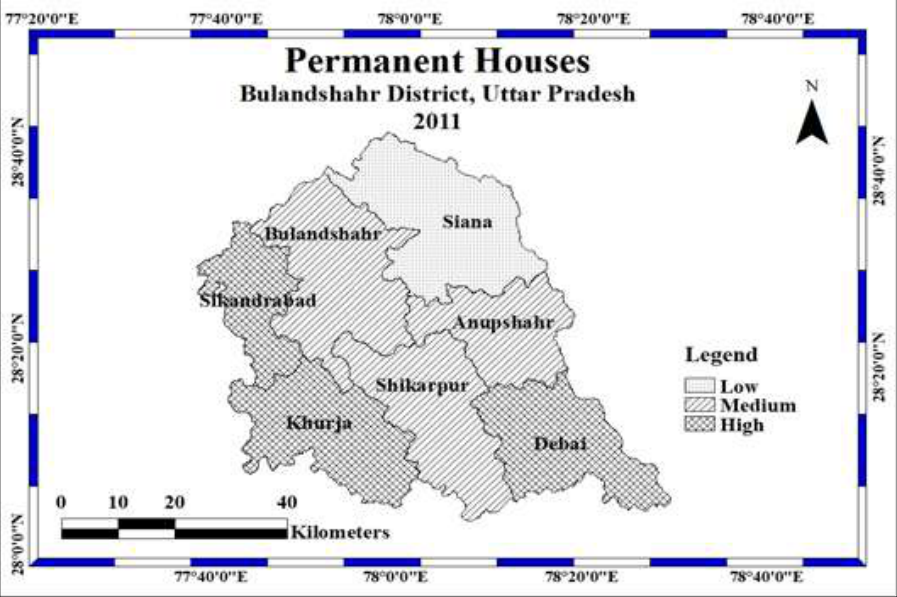 Figure 1
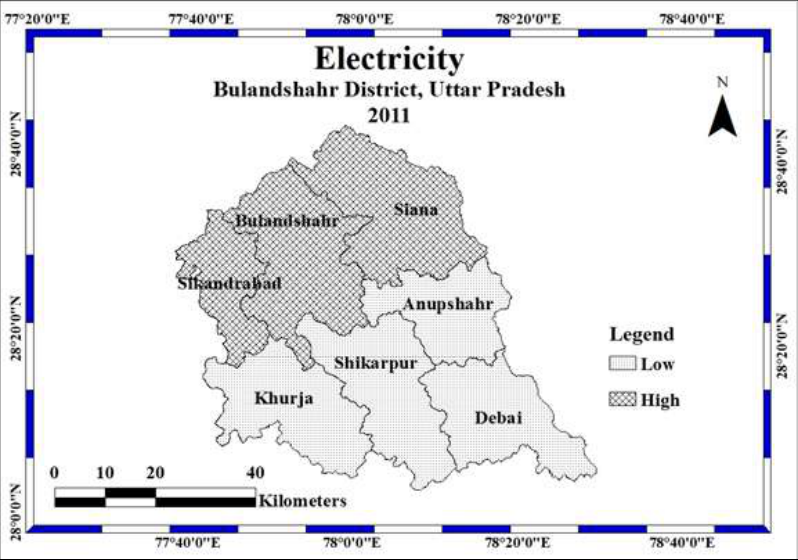 Figure 4
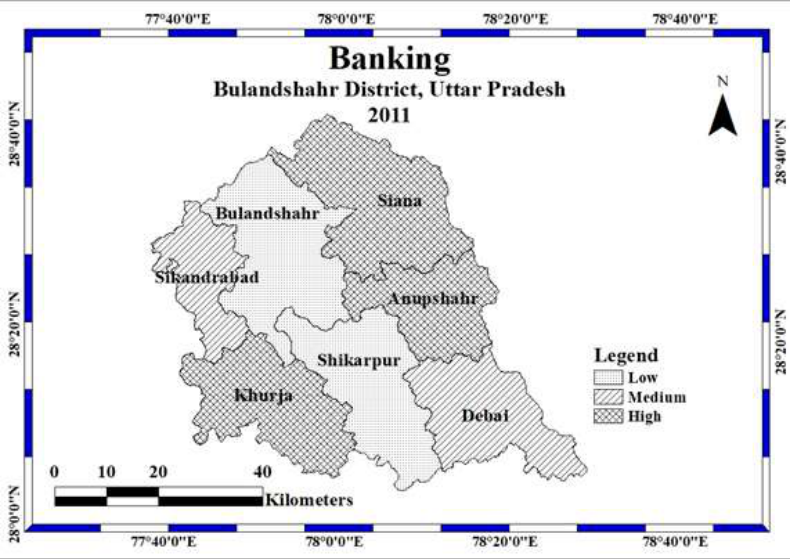 Figure 3
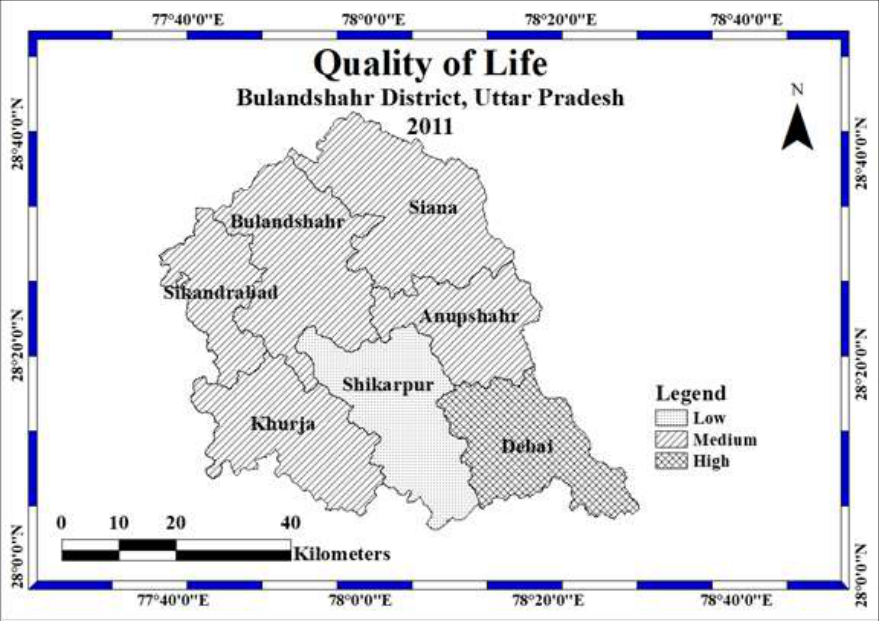 Figure 5
Introduction
Housing satisfaction is influenced by a broad array of objective and subjectively perceived conditions (Theodori, 2001) [1] . According to Ogu (2002) [2] the concept of housing or residential satisfaction is often employed to evaluate residents perceptions of and feelings for their housing units and the environment. Nayar, K.R. (1997) [3,8] has correlated the housing amenities to health improvements and examined the conventional idea that health promoting factors such as housing conditions, availability of drinking water, sanitary facilities etc, could contribute to health improvement among the population sometimes even more significantly than health services. The study indicates a definite contribution of housing conditions including sanitary facilities in health improvement. Liu (1999) [4] found that both physical and social factors influence the residential satisfaction. A customer satisfaction is mainly depends on cleanliness and maintenance of the flat. Nowadays, cities have become the target of quality of life measurement since they exhibit contemporary culture, ranging from technological development to social progress. Indeed, the process of urban planning and management is aimed at raising quality of life, especially with regard to improvement of facilities and services that fulfill socio-economic needs such as education, health, housing, entertainment, and safety. The recent trend of the household in availability of modern style that tend to dominant significance in the human life. The dependency ratio realized on the exist between the resources and the overall human development. it is unadventurously believed that the basic amenities belong to the housing conditions, availability of drinking water, sanitation facilities, etc. might be contribute to the health improvement of the people and determine the quality of life of the society. Objectives 1. To analyze the current status of the district with respect to quality of life. 2. To find out the progress of development in Bulandshahr District. 3. To show the spatial variation in respect of quality of life.
Study Area
Bulandshahr district is situated between Ganga and Jamuna rivers located between 28.4º and 28.0º north latitudes and between 77.0º and 78.0º east longitudes. Its geographical area is 4322 sqkm and constitutes 1.47 per cent of the total area of the U.P. State.
The district has 7 Tehsils, 16 blocks and 1242 inhabited villages and have a total population of 34.99 lakh as per the 2011 census. The population residing in urban areas is 24.79 percent (Census, 2011). The sex ratio which was 896 was below the state average. The total literacy level is 68.88% (census, 2011) per cent is higher than the state average.
Data Base and Methodology
The data is taken from districts census handbook, Bulandshahr, 2011. So, this paper is based on secondary source. On the basis of census data on percentage of population served by the basic amenities like permanent houses, drinking water, electricity and banking facilities in Bulandshahr district at Tehsil level. To analyze the quality of life in Bulandshahr district, we have taken four indicators like permanent houses, drinking water, banking and power supply. In this paper we use some kind of standard score using the method of z-scores. The original data which has to be manipulated into a transformation of Z-score results that its becomes zero and standard deviation becomes unity It is categorically denoted by Z. CSS = Zij/N Where, CS is composite score, N refers to the number of indicators (variables). The values have a positive score expressed as the high level of development. Whereas, the values have negative score termed as low level. The basic amenities like permanent houses, drinking water, banking and power supply. The composite scores of the tehsils analyzed on the basis of quality of life. Therefore, the district categorized into three levels, low (-0.5 and below), medium (-0.5 to 0.5) and high (0.5 and above) on the basis of composite scores in each tehsils. In addition, the advanced cartographic techniques, GIS-Arc view (version10.2) have been applied to show the Tehsil wise variation in quality of life through map based on the important amenities of Bulandshahr district. The analyses of the study that shows the quality of life in Bulandshahr district has not better rather it would say that the medium level of category becomes much more in comparison in high level of quality. Although, the only region (Shikarpur) has shown in all accessibilities have low level of quality. However, we find that the contiguous regions having high availability of basic amenities as well as high quality of life. In the same way the tehsils fall under the medium and low availability of basic amenities represent in the medium and low quality of life but there the only one fall always in the low category (Shikarpur). Therefore, the Govt. should take care and the special attention to their low level regions.
Results and Discussion
Results and Discussion
Figures and tables from the paper
| SN | Tehsil | Permanent Houses (z-score) | Water Facility (z-score) | Electricity (z-score) | Banking (z- score) | Composite Score |
|---|---|---|---|---|---|---|
| 1 | Sikandrabad | -0.84 | 1.30 | -0.21 | -0.21 | 0.27 |
| 2 | Bulandshahr | -0.64 | 1.21 | 0.61 | 0.61 | -0.17 |
| 3 | Siana | 0.92 | -0.77 | 0.92 | 0.92 | 0.19 |
| 4 | Anupshahr | 1.79 | -0.60 | 0.19 | 0.19 | 0.60 |
| 5 | Debai | -0.22 | -0.69 | -1.10 | -1.10 | -0.62 |
| 6 | Shikarpur | -0.87 | - 1.02 | 1.11 | 1.11 | -0.01 |
| 7 | Khurja | -0.15 | -0.58 | -1.31 | -1.31 | -0.26 |
Table text extracted from the original PDF; superscript letters are shown inline. The original table image is below.
View original table image
References
9 in the original paper- Theodori GL. Examining the effects of community satisfaction and attachment on individual well-being, rural sociology. 2001; 66(4):618-628.
- Ogu V. Urban residential satisfaction and planning implications in a developing world context. 2002; 7:3753.
- Nayar KR. housing amenities and health improvement: Some findings, economic and political weekly. 1997; 32(22):1275-1279.
- Liu. Residential satisfaction in housing estates: A Hong Kong perspective automation in construction. 1999; 8(4):393-404.
- Smith DM. the geography of social well-being in the United States, McGraw-Hill Book Company, New York, 1973.
- Mukherjee R. The qualities of life, valuation in social research, Sage Publication, New Delhi, 1989.
- Sen A. Capability and well-being in nussbaum and Sen A. (EDS), the quality of life, Oxford: Clarendon Press, 1993, 30-53.
- Nayar KR. Housing amenities and health improvement, economic and political weekly. 1997; 32(22):1275.
- Roback J. Wages, rents, and the quality of life, journal of political and economy, 1985, 1257-77.