
Research article · 2019 · Full text
International Journal of Geography Geology and EnvironmentSocio-economic analysis of the rural outmigrants: a micro-level study of Mohammadi block, Kheri district, Uttar Pradesh, India
Volume 1(1) · Pages 58–65 · DOI: 10.22271/27067483.2019.v1.i1a.10 ↗
Research areasAgricultural Economics and PracticesSocial and Economic Development in IndiaCOVID-19 Pandemic Impacts
Abstract
Author-writtenRural migration is a multi-dimension phenomenon, which affects the livelihood of people living in a different ecological setting like an inter-woven thread of factors. Migration occurs when diverse factors operate together; as the process of migration is not uniform, rather vary from a place in temporal dimension as per locale's particular development milieu. In the present study, an attempt has been made to identify the demographic attributes of the population, socio-economic condition of the households of the rural outmigrants, and the problem faced by the households. The research work is based on primary sources of data generated through the field survey carried out during 2016 in Mohammadi Block of Kheri district in Uttar Pradesh, India. The selection of the respondents was based on stratified sampling technique taking a sample of 10 percent of the total villages from the block and 10 percent of households from every village. The study finds out that Islam religion was predominant among respondents, and agriculture was the vital livelihood source for most of the surveyed population. About 26 percent of the surveyed household were illiterate and about 30 percent of the population was landless. Moreover, 48 percent of the respondent had no toilet facilities in their premises and about 29 percent of the population was living in the kutcha houses.
Summary
Source-checkedPlain-language reading of the full paper, prepared with AI and checked against the text. Each point links to the authors' own words.
Why it matters
- Rural out-migration is a complex phenomenon that impacts not only the individuals moving but also their families, often increasing burdens on women and creating socio-economic insecurity. View evidence ↗
- The study area, Lakhimpur Kheri, is identified as a Minority Concentrated District that requires urgent aid to improve its amenities and living standards. View evidence ↗
What they did
- The researchers conducted a field survey in 2016 in the Mohammadi Block of Kheri district, Uttar Pradesh, India, using primary data. View evidence ↗
What they found
- Islam was the predominant religion among the sampled households, accounting for 64.54% of the population. View evidence ↗
- The most common family size among the sampled population was 4 to 6 members, representing 44.17% of households. View evidence ↗
- Overall illiteracy was 25.9%, with a significantly higher rate of 34.5% among females. View evidence ↗
- Agriculture was a primary livelihood, with 29.66% directly engaged in it and another 34.56% working as laborers, mostly in agricultural roles. View evidence ↗
- The majority of households reported a monthly income between 1,000 and 15,000 Rupees. View evidence ↗
- Sanitation was poor, with 48.08% of households lacking latrine facilities and relying on open spaces. View evidence ↗
- Land ownership was limited, with 30.43% of the sampled families being landless. View evidence ↗
- Financial insecurity was the most common problem faced by households, affecting 36.34% of respondents, particularly in nuclear families when the head migrated. View evidence ↗
- Outmigration contributed to educational disruption, with 12.62% of children dropping out of school due to lack of fees or the absence of their fathers. View evidence ↗
What it means
- The authors conclude that to reduce forced migration, the government should generate local employment by enhancing agro-allied, non-farming, and small-scale industrial activities. View evidence ↗
- The authors recommend improving the quality and level of rural education to create awareness and generate new local opportunities. View evidence ↗
Visual summary
3 visualsIllustrations explain the paper; charts are replotted from the paper's own table values.
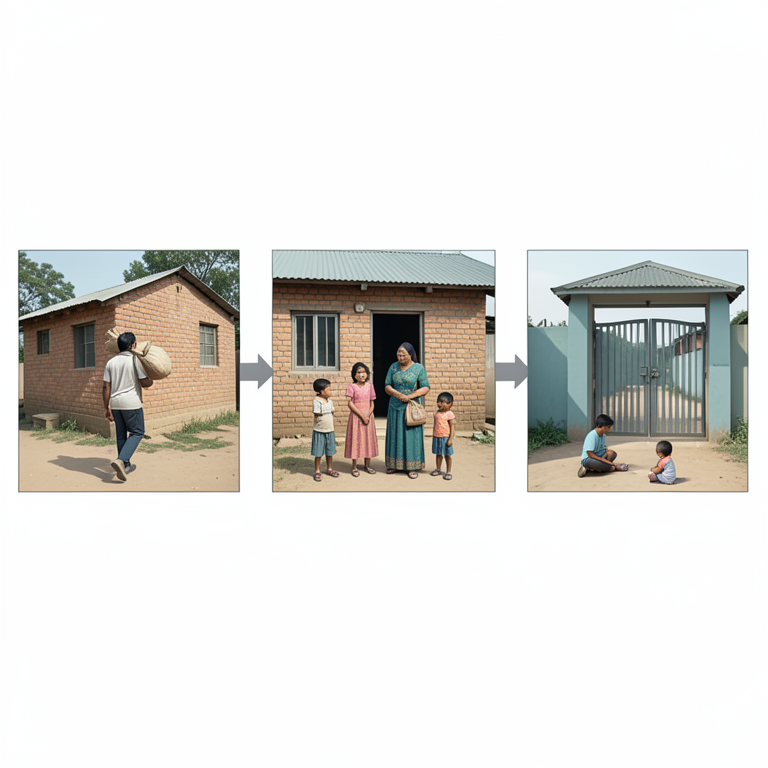
The Cycle of Rural Outmigration Hardship
AI-generated conceptual illustration (Rural Indian village households in Uttar Pradesh). It explains the idea and does not show study data.
View source evidence ↗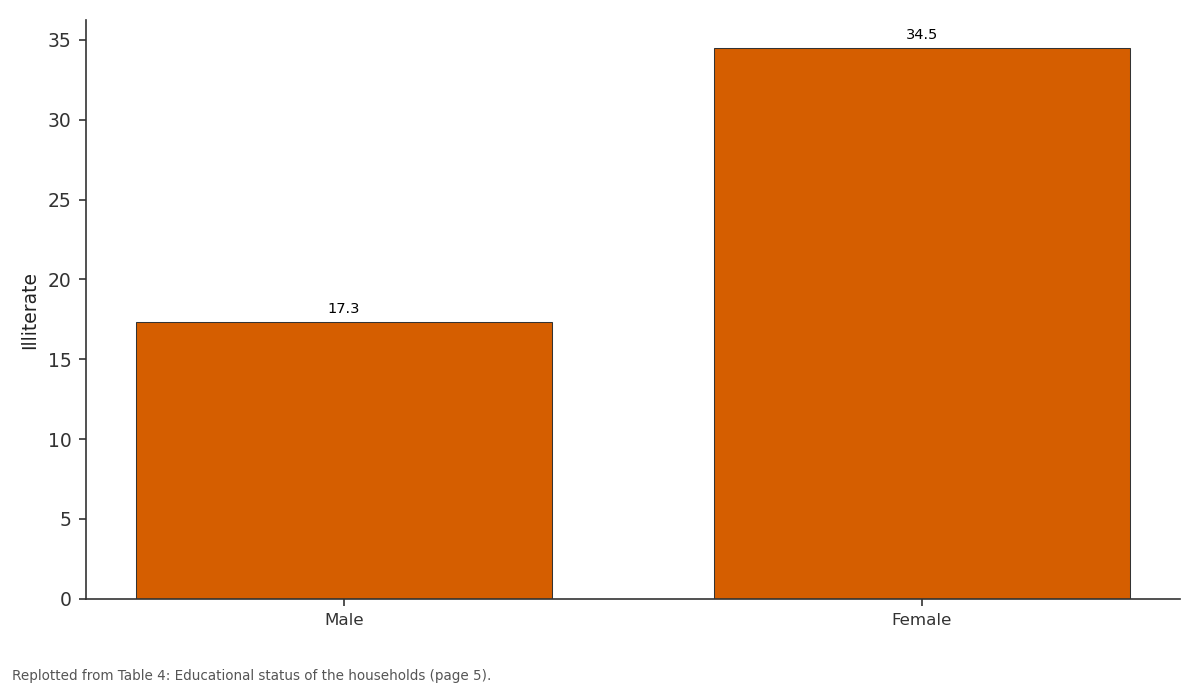
Illiterate: Male vs Female
Replotted from Table 4 (page 5) of the original paper. Every bar is the paper's own table value.
View source evidence ↗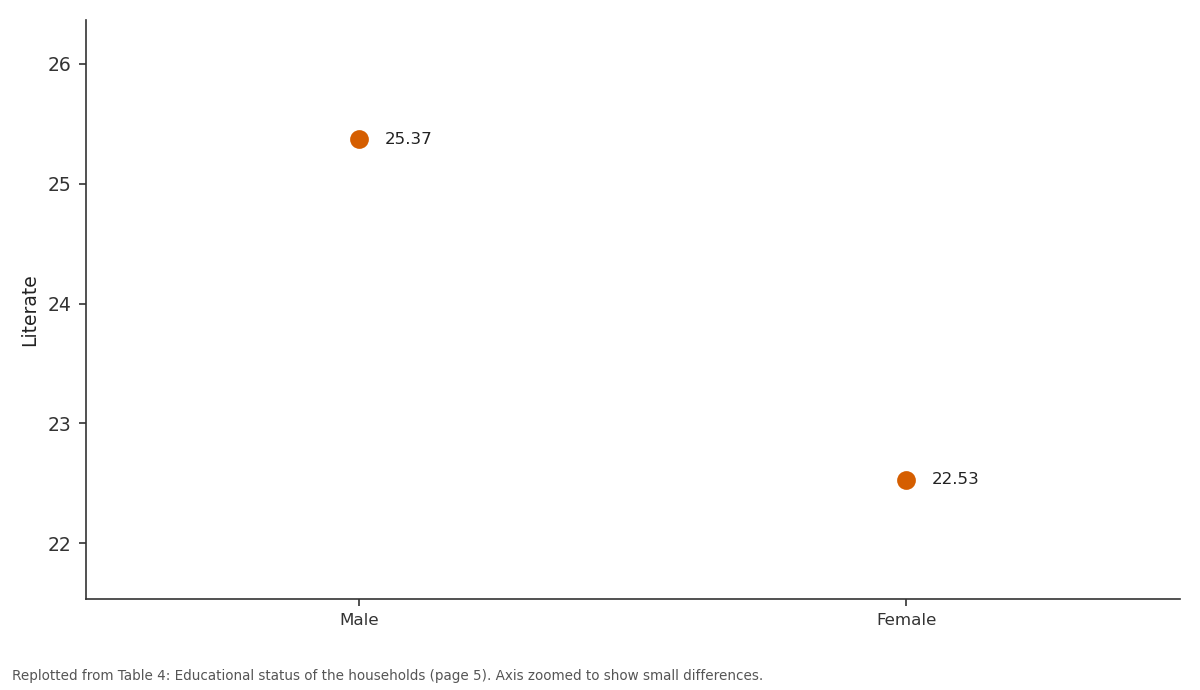
Literate: Male vs Female
Replotted from Table 4 (page 5) of the original paper. Every bar is the paper's own table value.
View source evidence ↗Figures & tables
From the original paper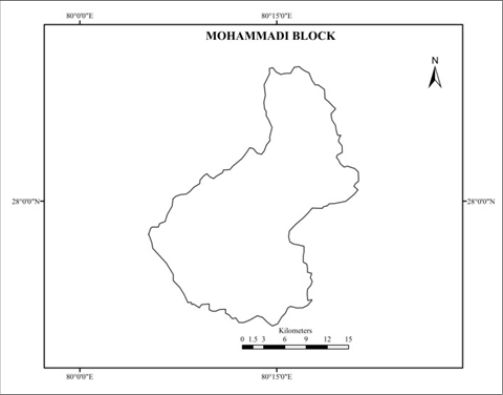 Figure 1
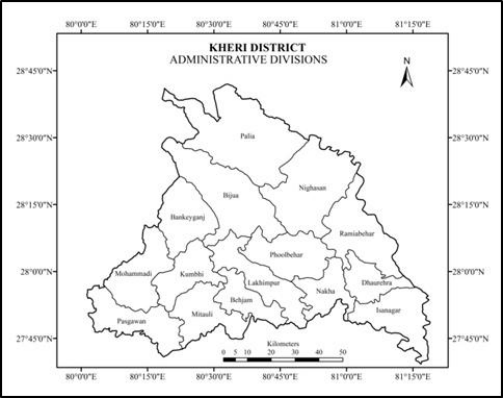 Figure 1
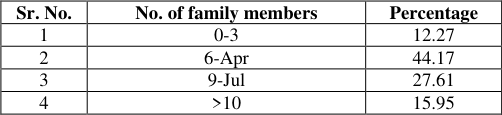 Table 1
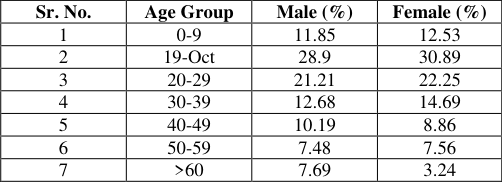 Table 2
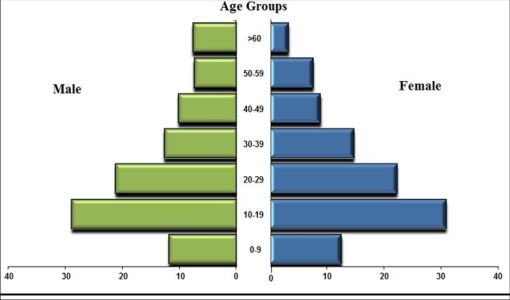 Figure 4
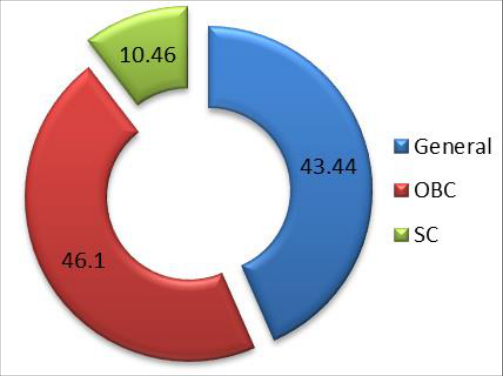 Figure 3
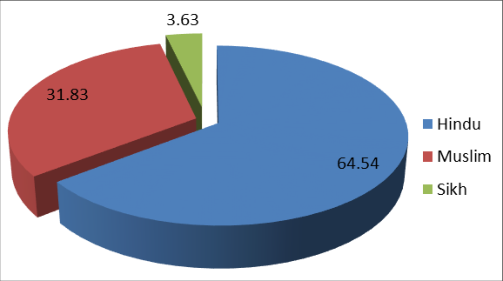 Figure 2
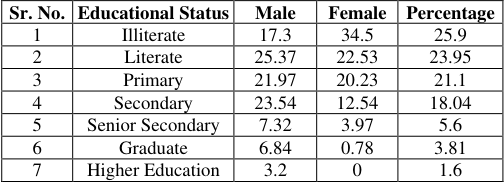 Table 4
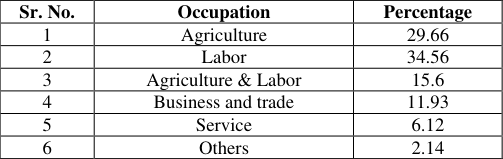 Table 3
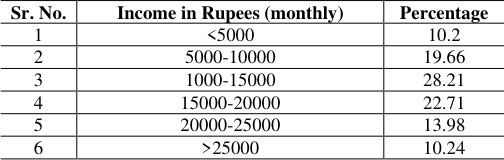 Table 5
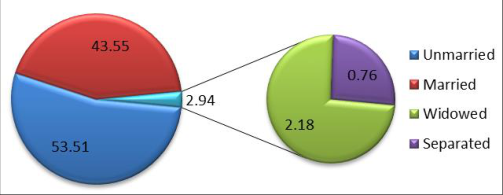 Figure 5
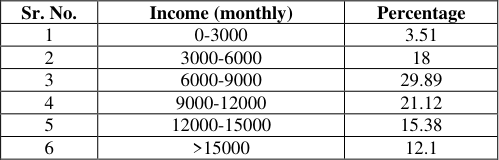 Table 6
 Table 7
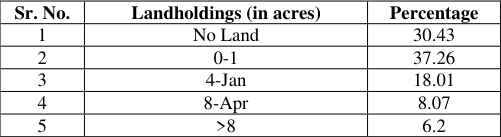 Table 9
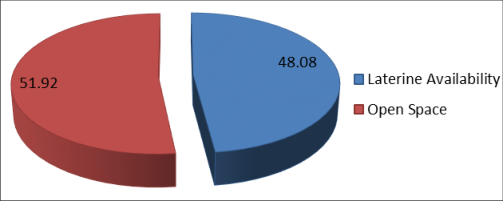 Figure 7
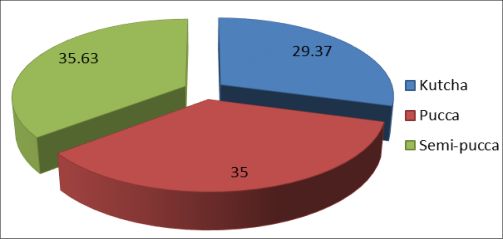 Figure 6
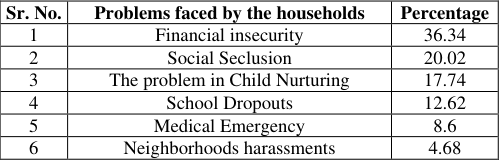 Table 10
Introduction
Migration is a complex, multicausal, and nonlinear demographic phenomenon that has occurred throughout human history at a variety of scales (Adepoju, 2008) [1] . In other words, Migration refers to the movement of the individual or group of people from one place to another place for a definite purpose, taking up permanent or semi-permanent residence, usually across a political boundary. It may be for a short distance or long distance. Migration is one of the fundamental anthropological phenomena to be found practically in all human societies. Besides birth, marriage, and death migration is omnipresent. The earliest human societies as hunters and collectors were even on the permanent move. Until today nomadic societies kept these features of unsettled life with all its advantages and risks (Széll, 1998). The migration is not just a process of the shifting from one place to another place rather it is a process that gives the change in the structure of the population (Bhende and Kanitkar, 1978) [4] , and it donates a lot for the understanding of the space-content and space-relations of a specific geographical milieu. Migration embraces three types of changes i.e. change in the area of out-migration, changes of in-migration and change in the migrants themselves (Ghosh, 1985) [5] . Migration is the purposive shift in order to enhance the perceived spatial diversity, therefore, the premises for the explanation of the spatial pattern of migration must lie in those patterns of diversity that gave rise to it (White & Woods, 1980). Rural migration is one of the most dramatic changes in developing countries. In many cases, the problem arising from the migration in the industrial states were explored in many ways. The migration is characterized with the sharply higher rates of population growth, mass migration to the cities at a much earlier stage in industrial development, lagging agricultural production, and slow expansion in industrial employment (Adams, 1969) [2] . Studies of temporary migration in developing countries often focus on rural out-migration and are preoccupied with problems it may bring to cities (Yang, 1994) [6] . Rural out-migration not only affects the migrants itself but also the other people who are directly or indirectly related to them. It increased the responsibility of the family members, women's work burdens, creating socio-economic deprivation and insecure future and compounds their difficulties of basic Survival, except for a scope for their children to go to the big city or to the places of better opportunity areas (Jetley, 1987) [7] . Migration may happen for different reasons. But if we agree on a historical-materialist approach -and we will see that this is the only one which will allow us to grasp the phenomenon in all its depth and variety -then it is first of all for material reasons, i.e. to find the material base for the reproduction of the tribe, of the clan, of the society. In early times it was only collectives which migrated because for an individual it was much too risky to do so. This search for better reproduction facilities -due to climatic or demographic changes -put pressure on other populations if the move was not into socially empty spaces. This led to conflict, war, submission, development of class societies, flight, a mix of cultures, etc. But due to this conflictuous moves, the phenomenon of migration is mostly linked to negative stereotypes: 1. for those who move, they are forced to do so; 2. For those who are confronted with migrant tribes, groups, clans it is a danger (Szell, 1998) [13] .
It is for these reasons that policies to regulate and discourage rural-urban migration are often considered. The urgency or otherwise of such steps would, however, depend on the estimated or perceived magnitude of these effects. In general, rural-urban migration would need to be discouraged if (i) such migration is very high causing disruption in productive activities in the rural areas; (ii) inflow into urban areas is far in excess of the demand for labour beyond what the native urban population can supply; and (iii) destination pattern of migration in terms of size-class of towns and cities to which rural people migrate), is concentrated mainly in favour of large cities. It is important to examine these aspects in order to understand the problem of rural-urban migration in a proper perspective (Papola, 1998) [14] .
Literature Review
Taeuber (1941) [15] presented an overall summary of the conceptual development of rural migration. In his study, he highlighted the fact that the population of cities is increasing, it is because of two reasons-first the high birth rates in the cities and second is the high influx of rural migrant in the cities in the search of employment. Moreover, Schultz (1971) [16] attempted to explore the determinants of internal migration. He estimated migration rate for various groups in the population to identify who migrate and where. He hypothesized that migration is, largely the result of purposeful behavior. Similarly, Wegner (1995) put forward that from the past, the general boredom and low standard of living often served as primary motivations to leave the city. Manner (2003) [18] carried out a study on the migrant/non-migrant fertility differentials and found out that non-migrant had more fertility levels rather than those of migrants. This study was concerned to construct a theoretical model based on the human capital approach, which can explain the interrelationship between migration and fertility. Similarly, Lindstorm (2003) also accomplished a study about the reproductive behavior of the rural migrant in Guatemala.
The results in the Guatemala context shows that the higher fertility of rural-urban migrant women compared to urban native women can be accounted for by differences in the ethnic, educational, and marital composition of these two groups. In addition, to this Omariba and Boyle (2010) [20] examine the intensity of rural-urban migration and child health in some less developed countries. The study showed that children of rural-urban migrants born before migration enjoyed the best survival prospects. Richards and Vanwey (2015) [21] examined outmigration from two sites in Para state in the Brazilian Amazon. The study focused on the migration magnitude and the drivers of rural-migration in the nearby sites. Gautam (2017) examined the determinants of the seasonal migration in the context of climate change and migration's role in food security and livelihood resilience in the district of Humla, Nepal. The results suggested that rather than climate change impacts, structural poverty is the primary cause of seasonal migration in Humla, and the potential of remittances to allow farmers in this district to enhance their livelihood resilience is dismal. Luong (2018) [23] focused on the acceleration in the ruralurban internal migration and one-way flow of remittances to migrants' rural families. The study reveals that the economic and non-economic motivations varied from community to community in Vietnam.
Study Area
Study Area
Data Collection and Methodology
The socio-economic survey requires data of primary origin for its reliability and authenticity. For the collection of data, in general, three distinct tools are used in social research. They are Observation, Interview, and Schedule. They are comprehensively used to discover new facts and verify the old facts of the problems undertaken for the study. As the paper aims to evaluate the socio-economic conditions of families and the rural out-migration in the block, where secondary data related to various socio-economic indicators are not available, it is totally depended on the primary source of data, and a socio-economic survey has been conducted during 2016 for this purpose.
A method of random stratified sampling has been taken into
Religious Composition
In India, religion is considered as the way of life, a tradition, which, for centuries shaped the thought, the culture, the outlook and the socio-economic life of the people. In this way, religion occupies a central position in order to achieve the socio-economic development of the society. Figure 2 depicts the religious composition of the households of the rural outmigrants. It has been found out in the survey that Muslims are dominant in the study area for 64.54 percent of the total sampled households were the followers of Islam religion. However, Hindu religion was second religion to be followed by a share of 31.83 percent of sampled population and Sikhs comprises of 3.63 percent of the surveyed population. An interesting fact has been pointed out during the field visits that mostly Sikhs in the study area are migrated from Pakistan at the time of partition and most of them were settled in Jhalas (farmsteads). The cast dichotomy in the Mohammadi block is one of the significant social elements that shape the social structure and regulate the occupational structure of the people. The study examined that 43.44 percent of the population belongs to the general category (Figure 3). The general category consists of all the upper sub-castes among all the religions i.e. Pathan and Sheikh in Muslims, Brahmin, and Rajpoot Among Hindus. However, Other Backward Caste (OBC) is the leading caste group (46.1%) in the sampled population, consisting of Julaha, Darji, Saain, Quraishi, among Muslims and Kisan, Rathore, Kurmi among Hindus. Moreover, 10.46 percent of the population was in Scheduled Caste that includes basically Kachchi, Chamaar, Pasi, Kumhar, etc.
Family Size
Family size is one of the important elements that motivated the migration of family members. It has been pointed out in the field survey that the bigger size of the family generally is highly inclined towards the migration for economic benefits. Table 1 shows the size of the family in the sampled population. 12.27 percent of the sampled households had a family size of fewer than 3 members. Moreover, the leading family size was 4 to 6 members that consisted of 44.17 percent of the sampled population. These two groups were generally representing the nuclear family type, while, family size more than 6 are mostly joint families. 27.61 percent of the families were reported to have a family size of 7 to 9 members. In addition to this, 15.95 percent of the sampled households were more than 10 family members.
| Sr. No. | No. of family members | Percentage |
|---|---|---|
| 1 | 0-3 | 12.27 |
| 2 | 6-Apr | 44.17 |
| 3 | 9-Jul | 27.61 |
| 4 | >10 | 15.95 |
Table text extracted from the original PDF; superscript letters are shown inline. The original table image is below.
View original table image
Age and Sex Structure
Structural composition of ages, both males and females, always exerts the socio-economic landscape of a population. It helps in understanding the socio-physical strength of the population. Figure 4 shows that the juvenile population is predominant in the study area. The age-sex pyramid is tapering with the height which means the population has shrunk with bigger age group. Exceptionally, the age group of 0-9 has less population than the bordering age-group, which means the children numbers are not rather high. However, the important thing that has been recorded, was the positive sex ratio (females outnumbers male) in the study area up to the age group of 40, after 40 the sex ratio is negative. Moreover, The male senile population is higher than the female senile population. Table 3 demonstrates the occupation adopted by the households of rural out-migrants in Mohammadi block. Being a rural field survey, the predominant occupation was agriculture that was adopted by 29.66 percent of the population. It can be marked that 34.56 percent of the population was labour, but mostly they are directly or indirectly work in agriculture. So, they can be categorized as agriculture workers. Only a small chunk of the population (11.93%) was engaged in business and trade, it was noted that all these activities were related to agriculture or basic needs. Agriculture workshops, shops of fertilizers, insecticides, pesticides and chemicals, medical shops, provision stores, and many small businesses were found in the study area. Being a very low literacy rate in the study area, a very small size of the sampled population (6.12 percent) was engaged in services. Moreover, 2.14 percent of the population was engaged in other activities.
| Sr. No. | Occupation | Percentage |
|---|---|---|
| 1 | Agriculture | 29.66 |
| 2 | Labor | 34.56 |
| 3 | Agriculture & Labor | 15.6 |
| 4 | Business and trade | 11.93 |
| 5 | Service | 6.12 |
| 6 | Others | 2.14 |
Table text extracted from the original PDF; superscript letters are shown inline. The original table image is below.
View original table image
Occupational Structure
Occupational Structure
Marital Status
Marriage is an important institution of the society conforming the biological, physiological as well as psychological health of the population. Although its definition and process vary from society to society, the fundamental concepts remain the same in all societies. 5 representing the marital status of the population reveals that 53.51 percent of the surveyed population was unmarried. Whereas, 43.55 percent of respondents were registered as married. In addition to this, 2.18 percent sampled respondents were widowed and 0.76 percent were separated due to various causes.
Educational Status
Literacy, the ability to read, write and understand own mother language, plays a significant role ordaining the level of social awareness as well as it is a significant indicator in determining the standard of living of the families. 4 depicts the educational status of the households of the rural migrants. It has been found out that 25.9 percent of respondents were illiterate. Illiteracy is abundant among the females, 34.5 percent of the females were reported illiterate. Women education is suffering from a number of social evils. It has been observed that 23.95 percent of the respondents were literate who can read and write in any language with understanding. If we consider the primary education level, the male and female had about equal literacy. But in the higher standard of education, the literacy rate among the females had a declining trend. Overall, the educational level in the block was pathetic. The primary education is, although satisfactory because most of the villages had primary schools. But there is a lack of senior secondary schools, degree colleges, and professional colleges, so the educational status is very low in higher classes as well as the dropout rate is very high.
Income
Income is the barometer to fathom the economic prosperity of a family or a nation. Here, the monthly income is calculated to draw the economic status of households. Table 5 shows that the majority of the families fell under the monthly income between 1000 and 15000. While the families having income between 15000 and 20000 were 22.71 percent and between 5000 and 10000 monthly income consists of 19.66 percent of households. It has been marked out that the income of the households is proportional to the agriculture landholdings. Generally, the families having big landholdings have higher incomes while the families having small landholding or landless families had a very meager source of incomes. However, the monthly income less than 5000 and more than 25000 had a similar composition of about 10 percent each. Table 6 analyses the income of the male migrants while table 5 shows the income of the households of the outmigrant. Thus, from the table, it is revealed that 3.52 percent of the migrated workers were earning below 3000 Rs. per month, 18 percent were earning between 3000-6000 Rs. per month, 29.89 percent lies between 6000 and 9000 per month, 21.12 percent fall between 12000 and 15000 Rs. Per month, while only 12.1 percent of the male workers are earning more than 15000 per month out of which most of them were skilled workers. It should be kept in mind that the annual income of the migrants was sampled, then it was calculated as monthly income to show in the table. The annual income of migrant was calculated because, most of them do not migrate for a year but they migrate seasonally, often in agricultural offseason. Therefore, it is difficult for them to give the data of their income monthly.
| Sr. No. | Income (monthly) | Percentage |
|---|---|---|
| 1 | 0-3000 | 3.51 |
| 2 | 3000-6000 | 18 |
| 3 | 6000-9000 | 29.89 |
| 4 | 9000-12000 | 21.12 |
| 5 | 12000-15000 | 15.38 |
| 6 | >15000 | 12.1 |
Table text extracted from the original PDF; superscript letters are shown inline. The original table image is below.
View original table image
| Sr. No. | Income in Rupees (monthly) | Percentage |
|---|---|---|
| 1 | <5000 | 10.2 |
| 2 | 5000-10000 | 19.66 |
| 3 | 1000-15000 | 28.21 |
| 4 | 15000-20000 | 22.71 |
| 5 | 20000-25000 | 13.98 |
| 6 | >25000 | 10.24 |
Table text extracted from the original PDF; superscript letters are shown inline. The original table image is below.
View original table image
Income of Male Migrants
Income of Male Migrants
Housing
House refers to all human structures that mean for a living, storing, protecting oneself and performing economic activities. As far as the housing is concerned figure 6 shows that 35.63 percent of the houses were semi-pucca. These houses were made of brickfield, mud, straw, etc. Usually, during the survey, it was found that the semi-pucca houses had a pucca room and kutcha boundary, or pucca walls with a roof of straw and thatches. The pucca houses had all the premises made of pucca brickfields. Indira Awas Yojana (Later Pradhanmantri Gramin Awas Yojana) supported the poor to build their pucca houses by financial assistance. Besides this, there is still kutcha housing in the study area. 29.37 percent of the sampled household was living in the kutcha houses. These houses are unhygienic because these houses are made of mud, straw, thatches, and grass.
Latrine Availability
It is depicted from the figure 7 that only 51.92 percent of the sampled population has the latrine facility within the house or outside the house. The rural people prefer latrine outside the boundary of the house if space is available. It is a very disappointing fact revealed during a survey that 48.08 percent of households had no latrine facility and they are using the open spaces for the toilet. It is observed during the survey that Muslim households have more availability of latrines than that of the Hindu households.
Drinking Water Availability
Water, the ambrosia of life, is needed for survival. The availability of adequate and pure water signifies the developed socio-cultural health of the population. While the scarcity of proper drinking water resembles socio-political conflicts. Table 8 shows the means of cooking in the selected study area. Means of cooking is a significant sign of the health of the female population of any particular area. It has been found that woods are the most important mean of cooking that account for 40.32 percent and 33.33 percent of the respondent used cow dung for making food, cow dung is only available to that household who have the cattle. Only 14.78 percent of the respondents had got L.P.G. (Liquid Petroleum Gas) for cooking. Moreover, 4.57 percent of households also use an electric heater and 7 percent of households used a straw, wastes of crops like sugarcane, mustard, groundnut, wheat, and wheat.
Agriculture Landholding
Agriculture Landholding is the best barometer to measure the economic status of the farmers. In the study, most of the population derives its livelihood from agriculture. 9 demonstrates the size of landholdings of the households and 30.43 percent of the families are reported landless. They had no land to do agriculture. They did agriculture on another land by contract farming or as an agriculture worker on sharing basis or on daily wages. However, 37.26 percent of households had less than 1 acre of land. They are the marginal farmers, the agriculture output is very nominal, commonly confined to domestic use. 18.01 percent of the respondent were reported to have agricultural landholding between 1 and 4 acres. The agriculture output throughout the block is high but it might be higher rather than this if the landholdings were large. The data reveals that 8.07 percent of the sampled households had the landholding between 4 and 8 acres and 6.20 percent of the respondent were the big farmers, having the landholding more than 8 acres. Table 10 shows the problems faced by the household of the outmigrant after the migration of their family members. It is pointed out during the survey that most of the problems are faced by nuclear families. There is no such problems in joint families because these families had a good number of persons to sustain the family. On the other hand, in a nuclear family, if the head of the family was migrated for economic benefit for few months or only for a month, his family had to suffer a lot after his migration. It has been reported that 36.34 percent of the respondents were facing the problem of money if the head of the nuclear family was migrated. They got money when he returned home after months or a month. They did not adopt any banking system or digital system to send their remittances to home. Consequently, the children were not well nourished due to lack of money. The mothers, as well as children, suffered from health issues (8.6 percent) because they could not find anyone to help them properly while medical emergencies. In addition to this, some children left schools due to unavailability of fees or due to the absence of their fathers (12.62 percent). Moreover, nuclear families also suffered from social problems like social seclusion (20.02 percent) and 4.68 percent of the respondents complained about their neighbours for harassment.
| Sr. No. | Problems faced by the households | Percentage |
|---|---|---|
| 1 | Financial insecurity | 36.34 |
| 2 | Social Seclusion | 20.02 |
| 3 | The problem in Child Nurturing | 17.74 |
| 4 | School Dropouts | 12.62 |
| 5 | Medical Emergency | 8.6 |
| 6 | Neighborhoods harassments | 4.68 |
Table text extracted from the original PDF; superscript letters are shown inline. The original table image is below.
View original table image
Conclusion and Suggestion
Analysis of the study shows that the mainstream of the households of rural out migrant were the followers of Islam religion and Hinduism, some of the respondents were following the Sikhism. Their caste composition was largely Other Backward Caste (OBC) followed by General category and Scheduled Caste (SC). The family size was widely bigger in most of the cases. The study pointed out that juvenile and senile dependency was a common feature of the household. Most of the population was engaged in agriculture directly or indirectly, either daily wage labour was another choice to earn a livelihood. Slightly, more than half of the population was unmarried, only a few respondents were found widowed or separated. About 25 percent of the respondents were illiterate, moreover, the educational status was found very poor in the study area. About half of the population had an income between 8000 and 16000 rupees per month per household. Regards to the only male migrant workers, about half of the migrants were earning between 6000 and 12000 rupees per month. Housing is one of the basic needs as 35 percent of the population had pucca houses, 35.63 percent had semi-kutcha houses while 29.37 percent had kutcha houses. The results reveal that only 52 percent of the respondents had latrine facilities the rest of them use open spaces for the toilet. Moreover, the drinking water is available within premises to more than 80 percent of the population with their private handpump. About 40 percent of the population used woods and cow dung for the cooking, LPG and Electric heater was partially used. However, 30 percent of the sampled population was landless while about 37 percent of the respondents were marginal farmers who owned less than 1 acre of land. Though the migration is beneficial for the origin place as well as for the destination place economically, it is harmful to both places socially. So, the movement of the people should be in a systematic manner. The haphazard migration is not good for the harmony in the society, this type of migration is not good for the social fabric of society. It should be noted that migration in rural areas always happens to fulfill their economic needs. Therefore, if they get the opportunity for regular work with good wages at their place of origin, they would not move to the urban agglomeration for jobs. The first step to stop such migration is to enhance the agro-allied, agro-ancillary activities, non-farming activities, and small-scale industrial activities for generating employment opportunities in the origin place. The animal husbandry, poultry farming, pisciculture, sericulture, horticulture, floriculture, piggery, apiculture, silviculture, etc. are required to intensify in the rural areas in order to engagement of the more rural labour force in such activities to increase their income. Secondly, the level and quality of education in rural areas should be improved to make people aware of the opportunities and to generate new opportunities. Thirdly, the government plans and schemes should be efficiently implemented and diffused to all the areas.
Figures and tables from the paper
| Sr. No. | Age Group | Male (%) | Female (%) |
|---|---|---|---|
| 1 | 0-9 | 11.85 | 12.53 |
| 2 | 19-Oct | 28.9 | 30.89 |
| 3 | 20-29 | 21.21 | 22.25 |
| 4 | 30-39 | 12.68 | 14.69 |
| 5 | 40-49 | 10.19 | 8.86 |
| 6 | 50-59 | 7.48 | 7.56 |
| 7 | >60 | 7.69 | 3.24 |
Table text extracted from the original PDF; superscript letters are shown inline. The original table image is below.
View original table image
| Sr. No. | Educational Status | Male | Female | Percentage |
|---|---|---|---|---|
| 1 | Illiterate | 17.3 | 34.5 | 25.9 |
| 2 | Literate | 25.37 | 22.53 | 23.95 |
| 3 | Primary | 21.97 | 20.23 | 21.1 |
| 4 | Secondary | 23.54 | 12.54 | 18.04 |
| 5 | Senior Secondary | 7.32 | 3.97 | 5.6 |
| 6 | Graduate | 6.84 | 0.78 | 3.81 |
| 7 | Higher Education | 3.2 | 0 | 1.6 |
Table text extracted from the original PDF; superscript letters are shown inline. The original table image is below.
View original table image
| Sr. No. | Status | Percentage | Source of water | Percentage |
|---|---|---|---|---|
| 1 | Within House | 82.21 | Private Hand pump | 86.5 |
| 2 | Outside House | 17.79 | Public Hand pump | 13.5 |
Table text extracted from the original PDF; superscript letters are shown inline. The original table image is below.
View original table image
| Sr. No. | Landholdings (in acres) | Percentage |
|---|---|---|
| 1 | No Land | 30.43 |
| 2 | 0-1 | 37.26 |
| 3 | 4-Jan | 18.01 |
| 4 | 8-Apr | 8.07 |
| 5 | >8 | 6.2 |
Table text extracted from the original PDF; superscript letters are shown inline. The original table image is below.
View original table image
References
23 in the original paper- Adepoju A. Migration in sub-Saharan Africa. Current African, 2008, (3).
- Adams DW. Rural Migration and Agricultural Development in Colombia, Economic Development and Cultural Change. 1969; 17(4):527-539.
- White P, Woods R. (ed.). The Geographical Impact of Migration, In: The geographical impact of migration, 1980, pp. 42-56.
- Bhende AA, Kanitkar T. Principles of Population Studies, 1978, pp. 355-387.
- Ghosh BN. Fundamentals of Population Geography, New Delhi: Sterling Publishers Pvt. Ltd, 1980.
- Yang X. Urban Temporary Out-Migration under Economic Reforms: Who Moves and for What Reasons, Population Research and Policy Review. 1994; 13(1):83-100.
- Jetley S. Impact of Male Migration on Rural Females, Economic and Political Weekly. 1994; 22(44):WS47WS53.
- Chandna RC. Geography of Population: Concepts, Determinants and Patterns, New Delhi: Kalyani Publishers, 2005.
- Lipton M. Migration from Rural Areas of Poor Countries: The Impact on Rural Productivity and Income Distribution, World Development. 1980; 8(1):1-24.
- Clarke JI. Population Geography, 1981, pp. 131-137.
- Oberoi AS, Singh HKM. Causes and Consequences of Internal Migration: A study in the Indian Punjab, Indian Economic Review New Series. 1984; 19(2):247-251
- Brown LA, Lawson VA. Migration in Third World Settings; Uneven Development and Conventional Modelling; A Case Study of Costa Rica, Annals of the Association of American Geographers. 1985; 75(1):2947.
- Szell G. Migration and Globalisation, Conference: International Workshop on Migration & Racism, At Nicosia/Cyprus, 1998.
- Papola TS. Rural-Urban Migration: Problem of SocioDemographic Regulations, Indian Journal of Industrial Relations. 1988; 24(2):230-237.
- Taeuber C. Rural-Urban Migration, Agriculture History. 1941; 15(3):151-160.
- Schultz TP. Rural-Urban Migration in Columbia, The review of Economics and Statistics. 1971; 53(2):157163.
- Wegren SK. Rural Migration and Agrarian Reforms in Russia: A Research Note, Europe-Asia Studies. 1995; 47(5):877-888.
- Manner CK. A Model of Rural-Urban Migration and Fertility, The journal of Developing Areas. 2003; 37(1):55-71.
- Lindstrom DP. Rural-Urban Migration and Reproductive Behavious in Guatemala, Populatio Research and Policy Review. 2003; 22(4):351-372.
- Omariba DW, Boyle MH. Rural-Urban Migration and Cross-National Variation in Infant Mortality in Less Developed Countries, Population Research and Policy Review. 2010; 29(3):275-296.
- Richards PD, VanWey LK. A second Act in Rural Migration in Western Para: Rural Out-migration and the Amazon Colonization, Journal of Latin American Geography. 2015; 14(2):53-75.
- Gautham Y. Seasonal Migration and Livelihood Resilience in the face of Climate Change in Nepal, Mountain Research and Development. 2017; 37(4):436445.
- Luong HV. The Changing Configuration of RuralUrban Migration and Remittances Flows in Vietnam, SoJourn: Journal of Social Issues in Southeast Asia. 2018; 33(3):602-646.