
Research article · 2019 · Full text
International Journal of Statistics and Applied MathematicsEfficient scheme of classifier on land use pattern
Volume 4(2) · Pages 38–43
Research areasRemote Sensing in AgricultureSoil and Land Suitability AnalysisRemote Sensing and Land Use
Abstract
Author-writtenRemote sensing is the collection and interpretation of information about an object, area, without being in physical contact with the object. Major Application of remote sensing in field of agriculture are in management of land and water resources, area estimation and monitoring, crop nutrient deficiency detection, soil mapping etc., The scope of the present study is land use and land pattern classification using digital image classification methods, their comparisons and accuracy assessment. The Machine learning algorithms are played vital role to achieve efficient pattern classifications. The supervised classifier is identifying the classes using trained set while in an unsupervised classification the classifier itself develops the spectral classes. Test imagery were obtained through Sentinel-2B Satellite on 15th January 2018. Maximum Likelihood Supervised Classification and Unsupervised Classification were performed using ERDAS 2015 imagine processing. Classification accuracy validations of supervised classes were expressed using confusion matrix. The measures such as F-measure value, Kappa coefficients estimated. The test of significance of the Kappa coefficient was performed using Z- test. Maximum likelihood classification out performed with highest overall accuracy of 72.99 percent. This study helps the farmers and policymakers using early and accurate estimates of yields, managing resources, and estimate area of crop production.
Summary
Source-checkedPlain-language reading of the full paper, prepared with AI and checked against the text. Each point links to the authors' own words.
Why it matters
- Remote sensing is highly valuable in agriculture for tasks such as monitoring area, managing water and land resources, and detecting nutrient deficiencies in crops. View evidence ↗
- Integrating Geographic Information Systems (GIS) and remote sensing is critical for food security, which is threatened by rising population density and limited crop yields. View evidence ↗
The question
- The study aims to classify land use and land patterns using digital image classification methods and compare their accuracy. View evidence ↗
What they did
- The research was conducted in the Ambaji Durga Hobli region of Chintamani Taluk, located in the Chikkaballapur district of Karnataka, India. View evidence ↗
- The study utilized satellite imagery from the Sentinel-2B satellite captured on January 15, 2018. View evidence ↗
- The land use pattern was classified into eight distinct categories: agricultural crops, horticultural crops, grazing land, forest, water bodies, roads, build-ups, and others. View evidence ↗
- The researchers used ERDAS 2015 software to perform both Maximum Likelihood Supervised Classification and Unsupervised Classification. View evidence ↗
- Accuracy was validated using confusion matrices, F-measure values, and Kappa coefficients, with the significance of the Kappa coefficient tested via a Z-test. View evidence ↗
What they found
- Maximum Likelihood classification achieved a significantly higher overall accuracy of 72.99% compared to the 52.55% accuracy of Unsupervised classification. View evidence ↗
- The Kappa coefficients for Maximum Likelihood (0.68) and Unsupervised classification (0.46) both indicated moderate agreement. View evidence ↗
- Chi-square tests for goodness of fit indicated that the Maximum Likelihood algorithm results were closer to ground truth values than the Unsupervised method. View evidence ↗
- The classifier demonstrated high precision for specific land types, achieving over 95% accuracy in classifying agricultural crops. View evidence ↗
What it means
- The authors conclude that the Maximum Likelihood classification algorithm is superior because it converges more significantly to actual land classes. View evidence ↗
- The authors state that high-accuracy classification helps policymakers and farmers estimate crop yields and areas before harvest, which aids in resource management and cost reduction. View evidence ↗
- The authors suggest that future work should extend the study to larger geographic areas, such as entire taluks or districts. View evidence ↗
Visual summary
3 visualsIllustrations explain the paper; charts are replotted from the paper's own table values.
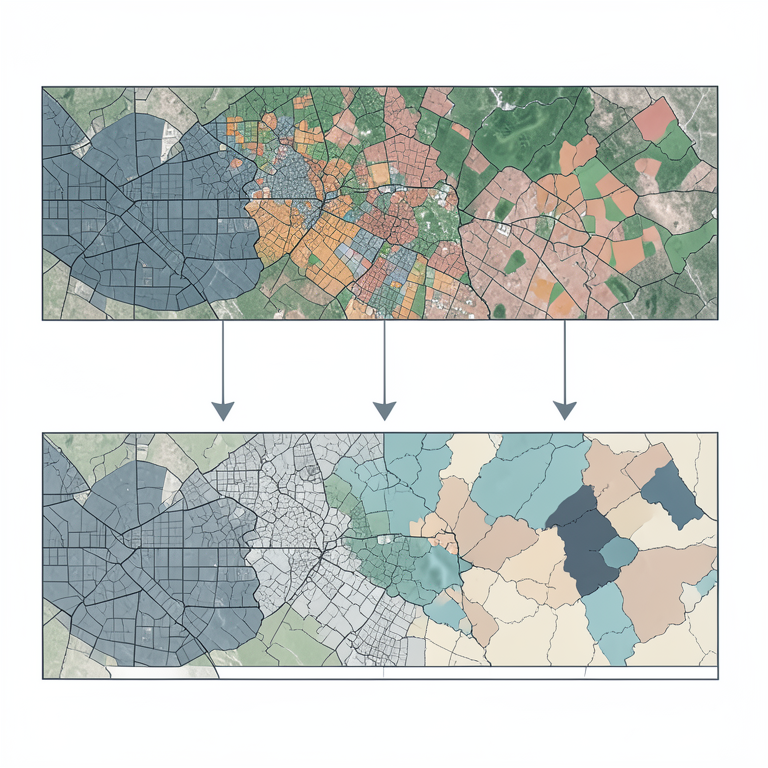
Comparison of Classification Approaches
AI-generated conceptual illustration (satellite imagery of a mixed landscape with forests, urban areas, and farmland). It explains the idea and does not show study data.
View source evidence ↗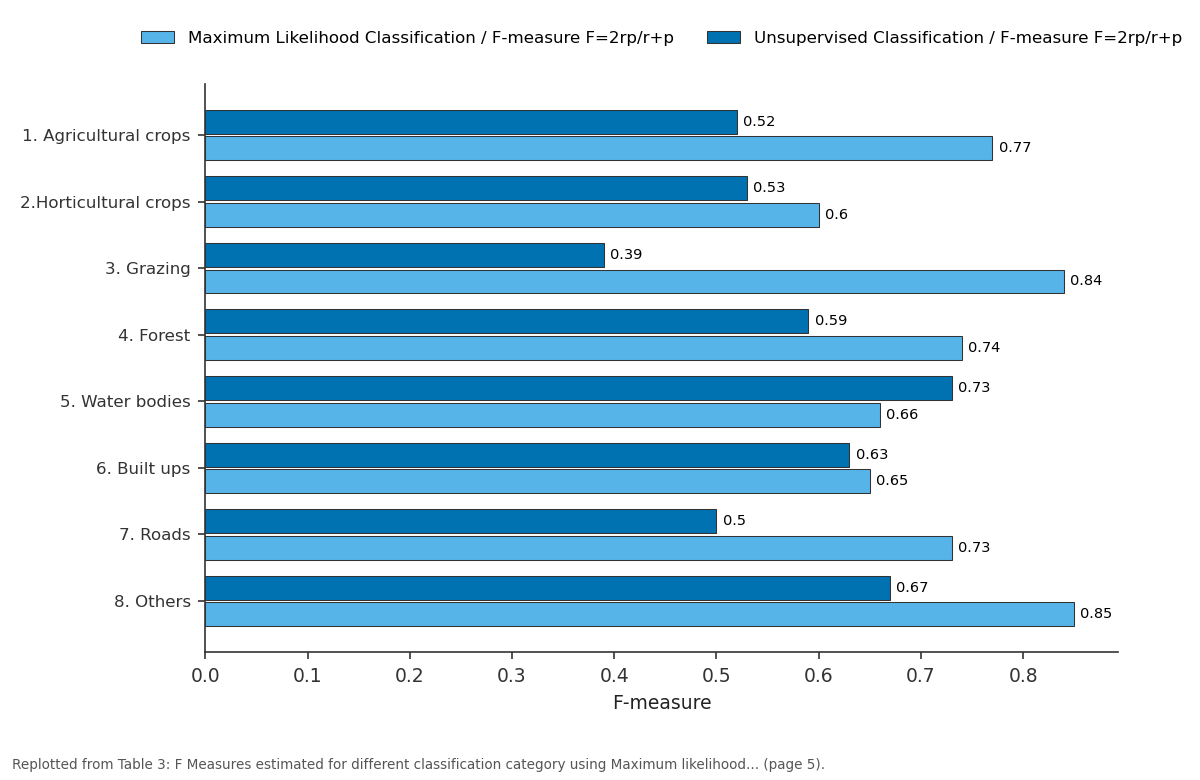
Maximum Likelihood Classification /... and Unsupervised Classification / F-measure...: 1. Agricultural crops vs 2.Horticultural crops vs 3. Grazing vs 4. Forest vs 5. Water bodies
Replotted from Table 3 (page 5) of the original paper. Every bar is the paper's own table value.
View source evidence ↗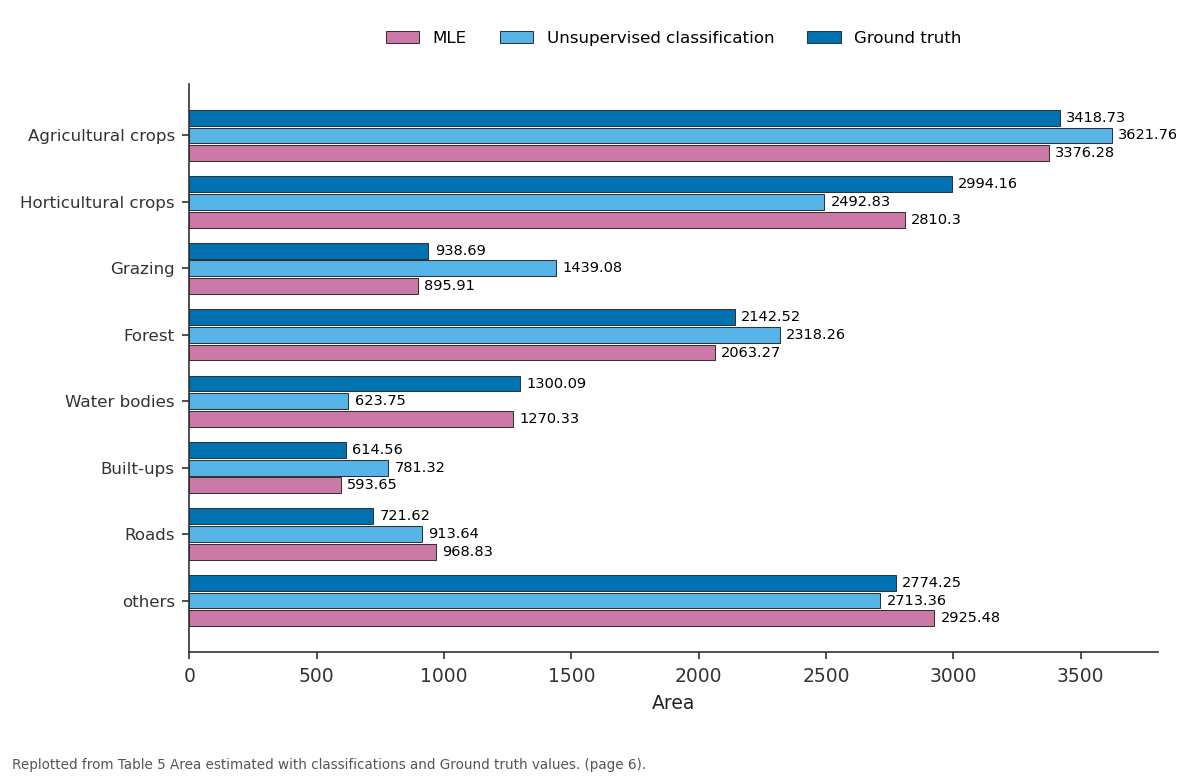
MLE and Unsupervised classification and more: Agricultural crops vs Horticultural crops vs Grazing vs Forest vs Water bodies
Replotted from Table 5 (page 6) of the original paper. Every bar is the paper's own table value.
View source evidence ↗Figures & tables
From the original paper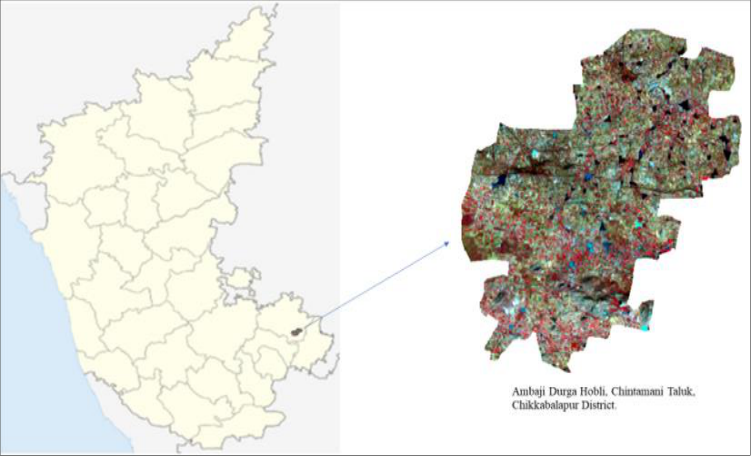 Figure 1
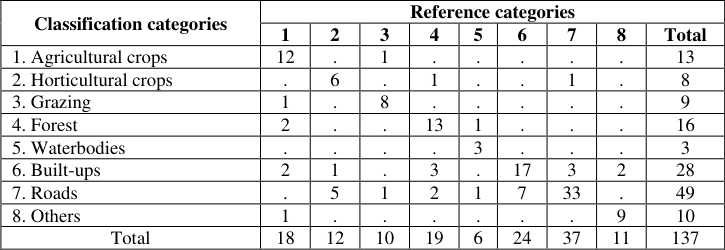 Table 1
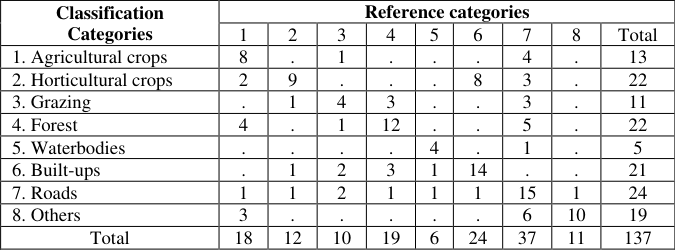 Table 2
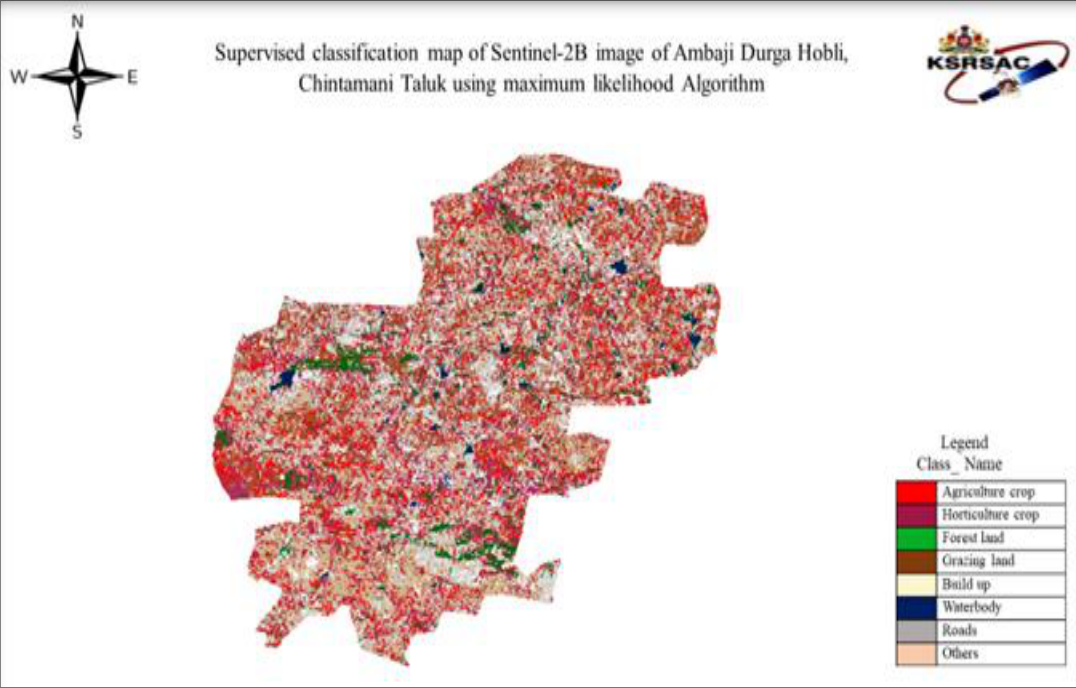 Plate 1
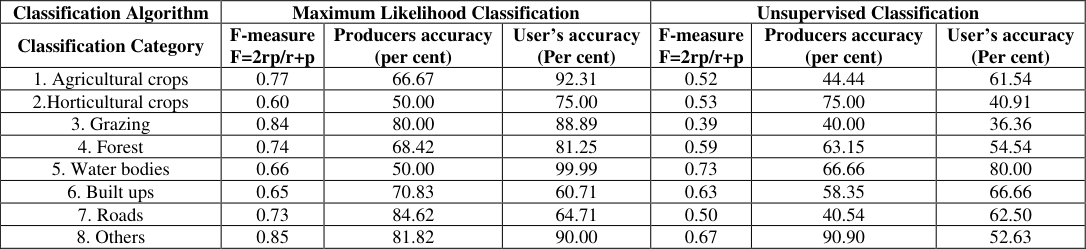 Table 3
 Table 4
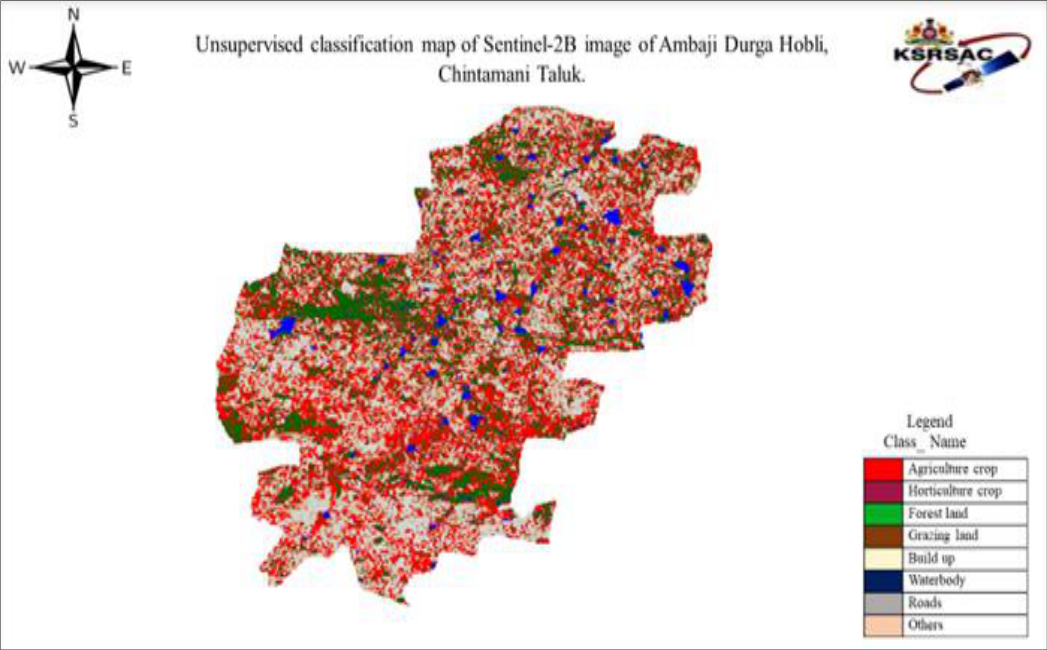 Plate 2
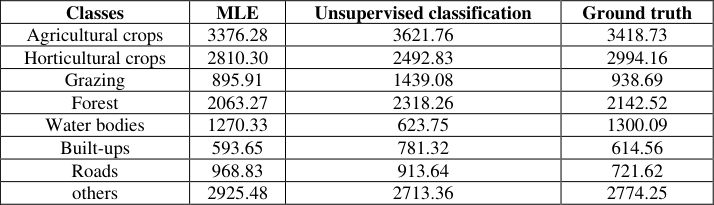 Table 5
 Table 6
Introduction
Remote sensing can be defined as the collection and interpretation of information about an object, area, or event without being in physical contact with the object. Every object has its own in nature of unique property of absorbing, reflecting and emitting electromagnetic energy in different bands of spectrum depending on their material type and conditions. Remote sensing imagery has several applications in mapping land-utilize and land cover, agriculture, soils mapping, ranger service, city planning, archeological examinations, military perception, and geomorphological studying, among different uses. For instance, foresters use aerial photos for preparing forest cover maps, finding conceivable access streets, and estimating amounts of trees reaped. The geographic information system (GIS) is a computer-based tool that allows you to create, manipulate, analyze, store and display information based on its location. GIS makes it possible to integrate different kinds of geographic information, such as digital maps, satellite imageries and global positioning system data (GPS), along with associated tabular database information. GIS and Remote Sensing play significant roles in securing the future of our food production and our population. The importance of food security is directly linked to increases in population density, limitations on agriculture crop yields, and the spread of food deserts. Using GIS, can incorporate all of this information into a single system and execute common database operations.
Review of literature
Balak Ram and Kolarkar (1993) [1] have studied Land-use changes in several parts of arid Rajasthan were recognized and mapped on the investigation, semi-detailed and detailed levels using multidate remotely-sensed data, maintained with field check and secondary information's. During the past three years, the net sown area in arid Rajasthan has increased by 36% while current and long fallows have declined by 29% and 41%, respectively.
The net irrigated area has increased by 140%. Forest and pastures develop highly dishonored though their areas have increased to some amount. Shamsudheen et al. (2005) [6] have studied land use /land cover mapping for Kumata taluk of Uttar Kannada of Karnataka. The IRS ID LISS III image was used. To perform supervised maximum likelihood classification. The accuracy of classification was evaluated using stratified sampling method. An overall accuracy of 75 percent was obtained. Richards et al. (2006) [5] have studied Remote sensing digital image analysis provides the nonspecialist with an introduction to quantitative estimation of satellite and aircraft derivative remotely retrieved data. It focuses is on those procedures that seem now to have become part of the set of tools frequently used to achieve thematic mapping. Perumal and Bhaskaran (2010) [4] have studied that Remote sensing image classification is one among the most significant application in remote sensing. an effective classifier is needed to classify the remote sensing imageries to extract information. They are experimenting with both supervised and unsupervised classification. Here we compare the different classification methods and their performances. It is found that Mahalanobis classifier performed the best in our classification. Patil S.S et al. (2014) [3] based on the requirements. Here we compare various researcher's comparative results on satellite image classification methods. Kiran (2017) [2] have studied about the classification of satellite imagery. The satellite image was collected through IRS P-6 LISS-IV on 14th November 2015 for Shettikere hobli, Chikkanayakanahalli Taluk. Maximum likelihood classification, Minimum distance to means classification, Mahalanobis distance classification, and Spectral correlation mapper classification and unsupervised classification were performed. Maximum likelihood classification was found to be best with a highest overall accuracy of 74.16 percent followed by minimum distance to mean 70.00 percent, and Unsupervised classification 46.66 percent were observed.
Material and methods
Material and methods
Description of the Study Area
The study area consists of Ambaji Durga Hobli of Chintamani Taluk of chikkaballapur district of Karnataka state. The area lies between 13°24'37.96"N latitude and 78°3'21.64"E longitude.
Details of image data
Data was taken from sentinel -2B Satellite image of 15 th January 2018 is used for the study. The geometrically adjusted images are found from Karnataka state remote sensing application center (KSRSAC) Government of Karnataka, Bengaluru-560097. Sentinel-2B is a European optical imaging satellite that started on 7 March 2017. The satellite holds wide swath high-resolution multispectral imager with 13 spectral bands. It will provide information for farming| and forestry, amongst others allowing for prediction of plants yields. The spatial resolution of the imageries is 10 meters. The images were recorded in three spectral bands, Blue (0.490-0.52µm), Green (0.560-0.58µm), and Red (0.665-0.688µm) and near Infrared (0.842-0.86µm). ArcGIS and ERDAS software used for structures extraction and study.
Details of Land Use Pattern Classes Considered
In the current study, a broad land use pattern classification system is adopted with eight categories for each training area as follows. 1) Agricultural crops 2) Horticultural crops 3) Grazing land 4) Forest 5) Water bodies 6) Roads 7) Build-ups 8) Others
Methods of Image Classification
Image classification is the process of separating the image into diverse areas with some similarities and labelling the regions using additional ground truth information. In the present study, both supervised and unsupervised methods are used for image classification. The supervised classifier is identifying the classes using trained set while in an unsupervised classification the classifier itself develops the spectral classes. In the research two algorithms are being used for a supervised classification and unsupervised classification algorithms. The Maximum-likelihood algorithm the classification is performed by Variance and Covariance matrix of training set. A digital image in spectral bands are represented by pmatrices of order M x N, where M represents the number of rows and N signifies the number of the number of columns in the image. Every pixel location (i, j) there is a p-dimensional measurement vector.
, Representing the digital values in the p-spectral bands. It is assumed that their m land cover classes represented by ω 1 , ω 2 , . . .., ω m in the underlying image and the goal of classification is to designate each pixel based on the observations to its class.
Maximum Likelihood Classification Algorithm
Maximum Likelihood Classification is performed, an optional output confidence raster can also be produced. This raster shows the levels of classification confidence. Let μ 1 , μ 2 ... μ m and Σ 1 , Σ 2 ... Σ m represents the population mean vectors and population variance-covariance matrices for m classes respectively. The observation vector Xr at pixel r belongs to class c is distributed as a multivariate normal distribution with mean vector μ c and covariance matrix Σ c . Then Given the likelihood of pixel r fitting to class c, Taking natural log, we have
Unsupervised Classification
Every pixel in an image coordinated to an isolated cluster to find out which set as being most similar to it and it is closet too. Colors are then determined to each class, and the clusters are interpreted after classification based on information of the image or by ground truthing.
Classification of Accuracy Assessment
Classification accuracy is estimated using testing data, i.e., the spatial data consisting of pixels for which the correct classification is known but not used in generating training statistics. Comparison between the classification obtained by the method under consideration and the accurate classification using test data is made, a count of some pixels correctly classified and misclassified are recorded for each class in an error matrix.
The error matrix is a rectangular array of numbers in rows and columns which express the number of pixels assigned to a particular category comparative to the actual category as verified by test data set. While Kappa coefficient (K) is the measure of agreement of accuracy. It provides a difference measurement between the observed agreement of two maps and agreement that is contributed by chance alone. The overall accuracy is generally expressed as a percent, with 100% accuracy being a perfect classification where all reference site was classified correctly. Overall accuracy is the easiest to analyze and understand but ultimately only provides the map user and producer with basic accuracy information.
Chi-square (𝛘𝟐) test for goodness of fit:
When the data consist of frequencies in discrete categories, the χ 2 test may be used to determine the significance of differences between two independent groups. The null hypothesis is that the two samples of frequencies come from the same population. The values of 𝜒 2 are distributed approximately as chi-square with (r-1) (k-1) degrees of freedom, where r = number of rows and k =number of columns.
Results and discussion
The results are obtained from the satellite image with efficient land use classification by different algorithms and measure the accuracy assessment of classification are presented as following subsections. 1. Collection and digitization of satellite image 2. Classification of pixel data of satellite image with different algorithms 3. Validate the Classification by Kappa Coefficient.
Collection and digitization of satellite image
To achieve the objectives stated in chapter 1, the satellite image of study area collected from KARSAC which is obtained by remote sensing through the sentinel-2B satellite image on 15 th January, 2018. The results obtained by applying the methods as described in the III chapter are conferred below. It is a secondary source data. By using sentinel-2B remote sensing satellite they are collecting the data. Sentinel-2B is the state-of-the-art satellite for the multi-spectral land observation mission with 13 spectral bands in that only 3 are visible infrared bands (red, green, and infrared).
Classification of data with different algorithms
The basic steps for supervised classification as revealed in chapter III under Section 3.2.1 is as followed. Once the groups of interest are defined sample of homogeneous pixels are selected as training sites of each group by drawing polygons on the false color composite images. These training sites are used to produce statistical descriptors for each land use land cover class. The statistics obtained for the training sites of each class for the study area is presented in the Tables
Maximum Likelihood Classification
Each pixel is classified into training site which one of the land use classes defined in chapter III the resulted classified image is in plate-1. Set of color coding are given to distinguish the corresponding land categories.
Unsupervised Classification
In this study, unsupervised classification clustering algorithm were used. The Unsupervised classification is performed using 28 clusters and 95 percent confidence threshold, for the study area. The clusters are built, each spectral class is analyzed individually to identify the class type. The spectral classes belonging to the same class type are combined. Final classification map is obtained for eight land use classes. The classified image is presented in Plate-2 for Ambaji Durga Hobli, Chintamani Taluk. Table 2 reviled the confusion matrix of unsupervised classification distribution of classes in different categories.
| Classification Categories | Reference categories | — | — | — | — | — | — | — | — |
|---|---|---|---|---|---|---|---|---|---|
| 1 | 2 | 3 | 4 | 5 | 6 | 7 | 8 | Total | |
| 1. Agricultural crops | 8 | . | 1 | . | . | . | 4 | . | 13 |
| 2. Horticultural crops | 2 | 9 | . | . | . | 8 | 3 | . | 22 |
| 3. Grazing | . | 1 | 4 | 3 | . | . | 3 | . | 11 |
| 4. Forest | 4 | . | 1 | 12 | . | . | 5 | . | 22 |
| 5. Waterbodies | . | . | . | . | 4 | . | 1 | . | 5 |
| 6. Built-ups | . | 1 | 2 | 3 | 1 | 14 | . | . | 21 |
| 7. Roads | 1 | 1 | 2 | 1 | 1 | 1 | 15 | 1 | 24 |
| 8. Others | 3 | . | . | . | . | . | 6 | 10 | 19 |
| Total | 18 | 12 | 10 | 19 | 6 | 24 | 37 | 11 | 137 |
Table text extracted from the original PDF; superscript letters are shown inline. The original table image is below.
View original table image
Validate the Classification by Kappa Coefficient
Test of significance is performed for Kappa coefficients of each method. Test of significant difference between Kappa coefficients of different methods. Table 4 shows the test of significance of kappa coefficient at 1 percent level. All these classification algorithms show a variance of kappa value is less than 0.01 it means significance of kappa confident of all classified algorithms are significance at one percent level for the image. The validity of classification accuracy was assessed using Kappa statistics which measures the degree of concordance. The Kappa coefficient for all classification significantly differ from random assignment shows Table 4.
| Classification Algorithm | Kappa (K) | Variance of K | p-Value | Overall accuracy |
|---|---|---|---|---|
| Maximum Likelihood | 0.68 | 0.00172 | < 0.01 | 72.99 |
| Unsupervised | 0.46 | 0.00213 | < 0.01 | 52.55 |
Table text extracted from the original PDF; superscript letters are shown inline. The original table image is below.
View original table image
Area estimated with classifications and Ground truth values
The Maximum likelihood classification is achieved the estimation of categories which is found to be more significant on truth observation in case of most of the classes compare to unsupervised classification. Shows Table 5 In this technique we are comparing the significant difference between the ground truths frequencies with the frequencies obtained with the two classification algorithms to each result is presented in below table.
| Classes | MLE | Unsupervised classification | Ground truth |
|---|---|---|---|
| Agricultural crops | 3376.28 | 3621.76 | 3418.73 |
| Horticultural crops | 2810.30 | 2492.83 | 2994.16 |
| Grazing | 895.91 | 1439.08 | 938.69 |
| Forest | 2063.27 | 2318.26 | 2142.52 |
| Water bodies | 1270.33 | 623.75 | 1300.09 |
| Built-ups | 593.65 | 781.32 | 614.56 |
| Roads | 968.83 | 913.64 | 721.62 |
| others | 2925.48 | 2713.36 | 2774.25 |
Table text extracted from the original PDF; superscript letters are shown inline. The original table image is below.
View original table image
Table 6 shows a test of significance of chi-square for the study area of the satellite image maximum likelihood classification algorithm nearer to the ground truth value. It found that highest probability (2.02E-16) and unsupervised classification shows (1.32E-54) of p-values.
| Classifiers | Chi square value | p- value |
|---|---|---|
| Maximum Likelihood | 520.12** | 2.02E-16 |
| Unsupervised | 207.98** | 1.32E-54 |
Table text extracted from the original PDF; superscript letters are shown inline. The original table image is below.
View original table image
Conclusion
Maximum likelihood classification algorithm on satellite imageries out performs in statistically significantly converging to actual classes. Kappa coefficient derives the significantly different from a random assignment. The classifier achieved more than 95% classification accuracy in agricultural crops. Unsupervised classification methods govern spectral classes automatically, but generally, show the restricted capacity to precisely partition the landscape into normal classes. Maximum likelihood classification algorithm is observed to be best with a highest overall accuracy of 72.99 percent for a study area. It classified is based on variancecovariance matrices for each class. Unsupervised classification depends on the purpose of study and condition of the selected area. It has an overall accuracy of 52.55 percent for the study area. For validation purpose, we use chisquare test for goodness of fit. Both the tests are found that Maximum likelihood is very near to the ground truth observation near to the ground truth observation. Higher accuracy would help to increasing yields, managing resources, reduction of input cost and prediction of future outcomes and also policymaker to estimate crops yield and area before harvest.
The future line of work
The study can be extended to large area say for taluk, districts, classification according to the land use and land cover status, was helped to control and supervision the main quantity about land use types and the implementation of the plans and also it helps to the policymaker to estimate crops yield and area before harvest. Agriculture industry also using GIS techniques for increasing yields, managing resources, reduction of input cost and prediction of future outcomes.
Figures and tables from the paper
| Classification categories | Reference categories | — | — | — | — | — | — | — | — |
|---|---|---|---|---|---|---|---|---|---|
| 1 | 2 | 3 | 4 | 5 | 6 | 7 | 8 | Total | |
| 1. Agricultural crops | 12 | . | 1 | . | . | . | . | . | 13 |
| 2. Horticultural crops | . | 6 | . | 1 | . | . | 1 | . | 8 |
| 3. Grazing | 1 | . | 8 | . | . | . | . | . | 9 |
| 4. Forest | 2 | . | . | 13 | 1 | . | . | . | 16 |
| 5. Waterbodies | . | . | . | . | 3 | . | . | . | 3 |
| 6. Built-ups | 2 | 1 | . | 3 | . | 17 | 3 | 2 | 28 |
| 7. Roads | . | 5 | 1 | 2 | 1 | 7 | 33 | . | 49 |
| 8. Others | 1 | . | . | . | . | . | . | 9 | 10 |
| Total | 18 | 12 | 10 | 19 | 6 | 24 | 37 | 11 | 137 |
Table text extracted from the original PDF; superscript letters are shown inline. The original table image is below.
View original table image
References
6 in the original paper- Balak Ram, Kolarkar AS. Remote sensing application in monitoring land-use changes in arid Rajasthan. Int. J Remote sens. 1993; 14(17):3191-3220.
- Kiran KS. Pattern classification scheme for remote sensing satellite imagery. M. Sc. (Agri.) Thesis (Unpub.), Univ. Agric. Sci., Bengaluru, 2017.
- Patil SS, Sachidanad UB, Angadi, Prabhuraj DK. Machine Learning Technique Approaches verses Statistical methods in Classification of multispectral remote sensing data using Maximum Likelihood Classification. Int. J Adv. Remote Sensing and GIS. 2014; 3(1):525-531.
- Perumal K, Bhaskaran R. Supervised Classification Performance of Multispectral Images. J of computing. 2010; 2:2151-9617.
- Richards JA. Remote Sensing Digital Image Analysis, Springer-Verlag Berlin, 2006, 240.
- Shamsudheen M, Dasog GS, Tejaswini B. Land use /land cover mapping in the coastal area of North Karnataka using remote sensing. J Indian Soci. Of Remote Sens. 2005; 33(1):155-1.
Cited by 2
From OpenAlex, OpenCitations and reference lists read by Scinovex
- Land Cover and NDBI analysis to map built up area in Iskandar Malaysia ↗
Muhammad Yazrin Yasin, Jamalunlaili Abdullah, Norzailawati Mohd Noor, Mariney Mohd Yusoff · IOP Conference Series Earth and Environmental Science · 2020
Abstract The growth of Iskandar Malaysia as a regional development corridor is inescapable large and rapid. The study area has been transformed from predominantly agricultural and forest land prior to 1990s into the second largest and third most urbanized area in peninsular Malaysia. The aim of this paper is to map Iskandar land cover change from 1991 to 2019 using…
❝ 2PDF - Cloud resources analysis and prediction system using Deep Neural network ↗
N. Subalakshmi, M. Jeyakarthic · International Journal of Cloud Computing and Database Management · 2020
Deep Neural Network classifier is one of the Deep Learning models for categorizing the exactness of systematic scaling orders in the groupings as an Administration (IaaS) layer of cloud computing. The hypothesis in this research is that calculation precision of scaling orders can be improved by demonstrating a reasonable time-arrangement expectation calculation dependent on the presentation plan after some time.…
❝ 1PDF