
Research article · 2018 · Full text
International Journal of Statistics and Applied MathematicsGuaranteed reliability sampling (GRS) plans for intermittent sampling inspection based on Lomax failure model
Volume 3(2) · Pages 355–362
Research areasAdvanced Statistical Process MonitoringStatistical Distribution Estimation and ApplicationsReliability and Maintenance Optimization
Abstract
Author-writtenIn this article an algorithm is proposed to guarantee reliability on the products during testing and hence a decision is made on batches based on the results of type-I censoring. The operating reliability rate for intermittent testing is derived and the necessary proofs are given. The efficiency measure values are compared with existing reliability sampling plans. It is found when the reliability increases then the probability of rejection decreases which is satisfactory for producers. Consumers are also happy with the new algorithm since a guaranteed reliability is obtained through these reliability sampling plans. Tables are constructed to facilitate easy implementation of reliability plans. Illustrations are presented so as to select the relevant reliability sampling plans.
Summary
Source-checkedPlain-language reading of the full paper, prepared with AI and checked against the text. Each point links to the authors' own words.
Why it matters
- Reliability sampling plans are commonly used in life testing to decide if a batch of products is acceptable. View evidence ↗
- Standard intermittent testing often fails to provide customers with a guaranteed reliability value for the products in a lot. View evidence ↗
- The Lomax distribution, a second-kind Pareto distribution, is frequently used in reliability engineering for life testing. View evidence ↗
The question
- The authors aim to develop Guaranteed Reliability Sampling (GRS) plans specifically based on the Lomax life distribution. View evidence ↗
What they did
- The proposed plan involves drawing a random sample of size n and subjecting them to a life test for a specified time t using type I censoring. View evidence ↗
- A batch is accepted if the number of successful specimens (S) is greater than or equal to a critical value x*, and rejected otherwise. View evidence ↗
- The authors used a MATLAB program to simulate cumulative failure rate values based on the scale (λ) and shape (α) parameters of the Lomax distribution. View evidence ↗
What they found
- The study found that as the reliability of the lot increases, the probability of rejecting the batch decreases. View evidence ↗
- At a termination time t/λ of 0.0038 and reliability of 0.9924, the minimum sample size required varies from 132 for C=1 to 1323 for C=10. View evidence ↗
- Comparative analysis shows that GRS-Lomax plans require smaller sample sizes than ordinary log-logistic plans. View evidence ↗
What it means
- The authors conclude that GRS plans are advantageous because they assure reliability before acceptance and reduce testing costs by using fixed termination times. View evidence ↗
- The authors recommend GRS-Lomax plans for quality control sections due to reduced sample sizes and lower inspection costs. View evidence ↗
Visual summary
1 visualsIllustrations explain the paper; charts are replotted from the paper's own table values.
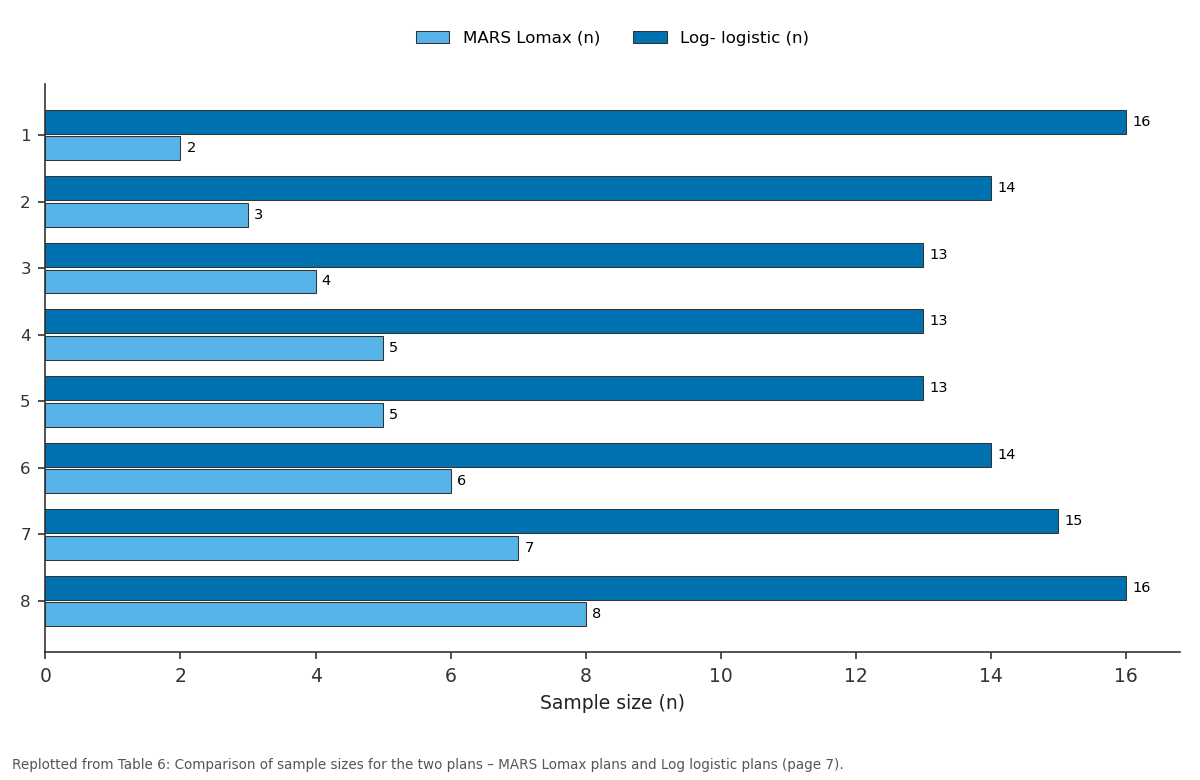
MARS Lomax (n) and Log- logistic (n): 1 vs 2 vs 3 vs 4 vs 5
Replotted from Table 6 (page 7) of the original paper. Every bar is the paper's own table value.
View source evidence ↗Figures & tables
From the original paper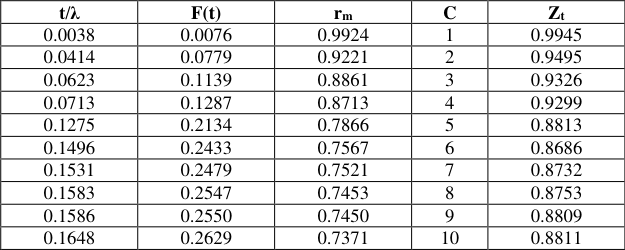 Table 1
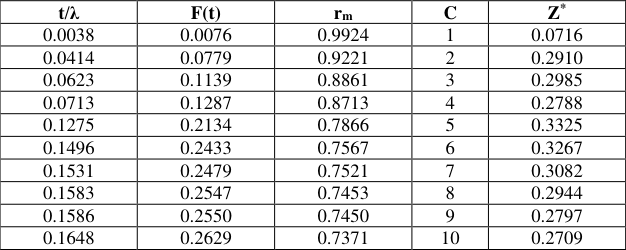 Table 2
 Table 3
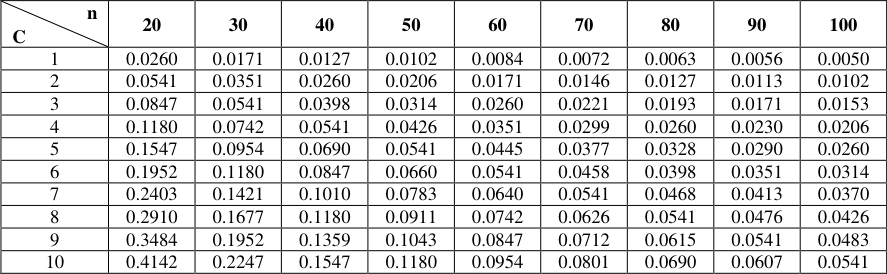 Table 4
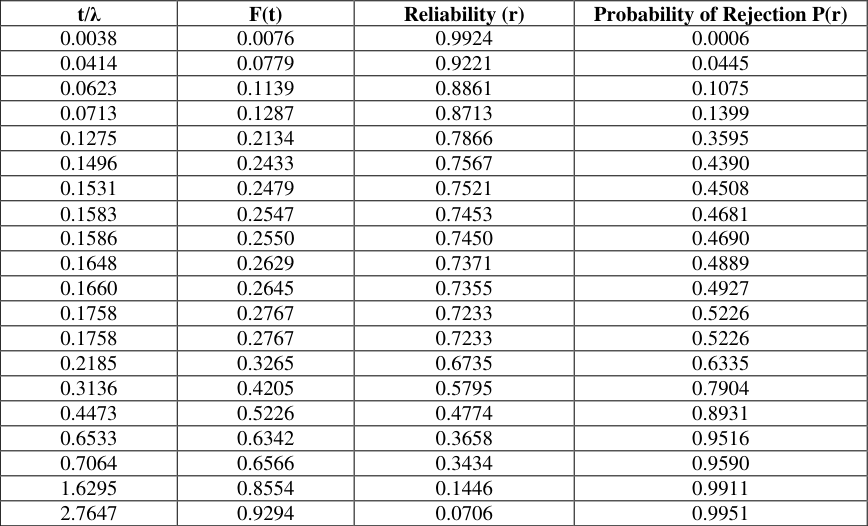 Table 5
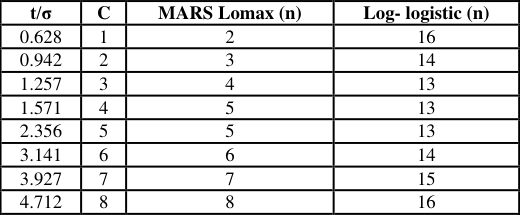 Table 6
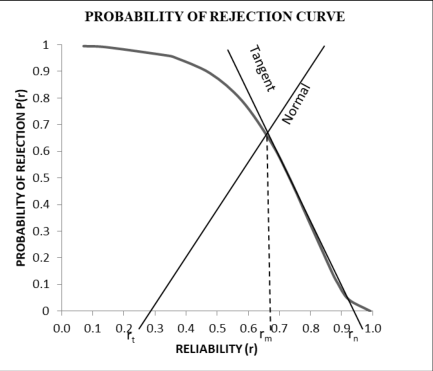 Figure 1
Introduction
Reliability sampling plans are widely utilised in life testing experiments to determine the acceptability of a lot or a particular batch in a testing process. In reliability sampling plans, a set of test units are chosen randomly and they are subjected to certain test procedures. Then based on the results the set of units or batches are either accepted or rejected. But there is no guarantee for the reliability of the units in the lot during intermittent testing. Customer does not have the knowledge about the reliability of the products. Hence to offset the disadvantages in reliability sampling plans, guaranteed reliability sampling plans are being developed. In this article, a special type of reliability sampling plans called, Guaranteed Reliability Sampling (GRS) plans are developed based on Lomax life distribution. Reliability models are generally defined by life time random variables and their corresponding distributions. The intermittent testing reliability sampling plans are being designed with the assumption that the life of the units follows a Lomax distribution. Lomax distribution is a Pareto distribution of second kind and is used in life testing experiments in the recent years because of wide applications in reliability engineering. In the lifetime context the main advantages of the Lomax model is that it belongs to the family of decreasing failure rate, for details please refer Chahkandi and Ganjali [1] . It arises as a limiting distribution of residual lifetimes during wear and tear period, see, Balkema and de Hann [2] . It was originally introduced for modelling business failure data and now it has wide variety of applications in quality and life testing arena. Hence Lomax failure distribution is augmented in determination of minimum assured reliability before disposing the lots or batches. Devaarul [3] developed new type of Reliability Sampling Plans based on exponential model. Devaarul and Jemmy Joyce [4] have developed reliability sampling plans based on minimum angle technique. Suresh and Devaarul [5] developed maximum acquired reliability sampling plans. Lomax [6] introduced this distribution in the analysis of business failure data. Kim and Yum [7] suggested that a reduction in testing effect and administrative convenience may be obtained by using intermittent inspection whereby items are inspected only at certain points of time. Park and Yum [8] developed Reliability Acceptance Sampling Plans assuming that degradation tests are conducted at the use with two accelerated stress conditions. Kantam and Rosaiah [9] suggested acceptance sampling plans based on life tests when the failure density model of the products is half the logistic distribution. Kantam, Rosaiah, and Rao [10] studied the acceptance sampling based on life tests when the failure density model of the products is a log-logistic distribution. Mughal et al. [11] developed economic reliability group acceptance sampling plans for life times following a Marshal-Olkin extended distribution. Lio, Sai and Wu [12] developed acceptance sampling plans from truncated life tests based on the Burr type XII percentiles. Al-Awadhi and Ghitany [13] has derived a discrete distribution called Poisson Lomax, based on mixing a Poisson parameter with Lomax distribution. Childs, Balakrishnan, and Moshref [14] derived some recurrence relations for the single and the product moments of order statistics from n independent and non-identically distributed Lomax and right-truncated Lomax random variables. Hassan and Al. Ghamdi [15] determined optimal times of changing stress level for simple stress level under a cumulative exposure model using Lomax distribution for a wide range of values of the model parameters. Cramer and Schmiedt [16] developed progressively type-II censored competing risks data from Lomax distributions. Soundarrajan [17] has developed MAPD single sampling inspection by attributes plan. Fertig and Mann [18] discussed life test sampling plans for two parameter Weibull populations. Bassiouny, Abdo and Shahen [19] proposed a new generalization of Lomax
The cumulative distribution function (cdf) of Lomax distribution is given by,
where λ is the scale parameter and α is the shape parameter.
Formulation of the plan
Let r m be the reliability of each component in the lot. Let n denote the number of units tested in time period t and x, 0 ≤ x ≤ n, denote the number of successful units at time period t. Thus r m is the chance that any item tested during period t will result in a success, or it is reliable towards success such that r m = 1-F(x, λ, α) = 1-p. In sampling plan literature, the probability of acceptance of the batch or process if r m is reliability is given as
When x is the minimum number of survival units required in the sample before acceptance of the batch then the probability of rejection is given by
If α, β and r m are known, one can determine the smallest value of n , and the largest value of x t such that the batch is accepted if the number of survival S = x t ≥ x t * . But in testing, the reliability r m may or may not depend on time t and is unknown. Hence to overcome this disadvantage, r m is determined using simple calculus.
Algorithm for sentencing a batch or process
Step 1: Draw a random sample of size n and put them into life test for specified time t (type I censoring)
Step 2: Count the number of specimens successful in the test. Let it be S.
Step 3: If S ≥ x * accept the batch or lot.
Step 4: If S< x * reject the batch or lot.
Step 5: Rejected lots are sent to rework or scrap section.
Designing GRS Plans
The Probability of rejection of batches if r m is reliability with type II probabilities is defined as
When 'c'is the acceptance number and n is the sample size then the tangent to the probability of rejection curve at the deflection point touches the x-axis at
The root of the above equation is obtained by equating 0
therefore the point at which the tangent touches the x-axis is given by
Similarly, If 'c' is the acceptance number and n is the sample size then the normal to the probability of rejection curve at the deflection point touches the x-axis at
Equation of normal
Equation of the normal passing through
The root of the above equation is obtained by equating 0
At the deflection point, n(1-r m )=np = C (16) therefore, the point at which the normal touches the x-axis is given by
Differentiating Equation ( 9) with respect to p twice and equating to zero, we get
The Guaranteed reliability in the lot is obtained from Equation ( 19), Since
Operating reliability rate at normal point
Operating reliability rate at normal point
Let the operating reliability rate of the normal be
Let the operating reliability rate of the normal be
Selection of Termination Time
The parameters of the heavy tailed distribution are λ and α in case of Lomax distribution. Hence the cumulative failure rate values are simulated using MATLAB program for the known Scale and Shape parameters of the Lomax distribution. Twenty random values were generated and hence the corresponding F(t) values are obtained using equation (2). Thereafter r m is obtained from equation (6). For the specified shape parameter the different tables are constructed in order to make easy selection of reliability sampling plans. The following are the steps involved in simulating values using MATLAB program:
Step 1: The random number for Lomax distribution works in the randraw.m option.
Step 2: In the MATLAB command window type the following script: Y = randraw ('pareto2',[0,5,2.4], 20); The 'pareto2' option is used for Lomax distribution because Lomax is a pareto second type distribution.
Step 3: When executing the call in step 2, it produces 20 random numbers which has the scale parameter as 0.5 and shape parameter as 2.4.
Step 4: In order to get more random numbers the sample size could be increased.
Step 5: These random numbers so generated are taken as t/λ values and used for construction of tables.
Construction of tables (i) Table 1 & 2:
The operating reliability rates of tangent (Z t ) are obtained by using Equation (24) for the known survival units and are presented in Table 1. The operating reliability rates for the normal (Z * ) are obtained by using Equation ( 27)and are presented in Table 2.
| t/λ | F(t) | rm | C | Z* |
|---|---|---|---|---|
| 0.0038 | 0.0076 | 0.9924 | 1 | 0.0716 |
| 0.0414 | 0.0779 | 0.9221 | 2 | 0.2910 |
| 0.0623 | 0.1139 | 0.8861 | 3 | 0.2985 |
| 0.0713 | 0.1287 | 0.8713 | 4 | 0.2788 |
| 0.1275 | 0.2134 | 0.7866 | 5 | 0.3325 |
| 0.1496 | 0.2433 | 0.7567 | 6 | 0.3267 |
| 0.1531 | 0.2479 | 0.7521 | 7 | 0.3082 |
| 0.1583 | 0.2547 | 0.7453 | 8 | 0.2944 |
| 0.1586 | 0.2550 | 0.7450 | 9 | 0.2797 |
| 0.1648 | 0.2629 | 0.7371 | 10 | 0.2709 |
Table text extracted from the original PDF; superscript letters are shown inline. The original table image is below.
View original table image
| t/λ | F(t) | rm | C | Zt |
|---|---|---|---|---|
| 0.0038 | 0.0076 | 0.9924 | 1 | 0.9945 |
| 0.0414 | 0.0779 | 0.9221 | 2 | 0.9495 |
| 0.0623 | 0.1139 | 0.8861 | 3 | 0.9326 |
| 0.0713 | 0.1287 | 0.8713 | 4 | 0.9299 |
| 0.1275 | 0.2134 | 0.7866 | 5 | 0.8813 |
| 0.1496 | 0.2433 | 0.7567 | 6 | 0.8686 |
| 0.1531 | 0.2479 | 0.7521 | 7 | 0.8732 |
| 0.1583 | 0.2547 | 0.7453 | 8 | 0.8753 |
| 0.1586 | 0.2550 | 0.7450 | 9 | 0.8809 |
| 0.1648 | 0.2629 | 0.7371 | 10 | 0.8811 |
Table text extracted from the original PDF; superscript letters are shown inline. The original table image is below.
View original table image
(ii) Table 3& 4:
The required sample size n for making a decision with different r m and t/λ values are obtained for GRS plans by using Equation ( 22). The values are given in Table 3 along with the number of maximum allowable failures C and α=2. Substituting the r m values in Equation ( 2) the corresponding values of t/λ is calculated and given in the Table 4. (iii) Table 5: For the known t/λ values of r m are calculated using Equation ( 6) and there by the probability of rejection is calculated using Equation (9). From Table 5 one can find that whenever t/λ increases r m decreases. Hence the research is intended in finding the minimum reliability required for acceptance of a lot.
| t/λ | F(t) | Reliability (r) | Probability of Rejection P(r) |
|---|---|---|---|
| 0.0038 | 0.0076 | 0.9924 | 0.0006 |
| 0.0414 | 0.0779 | 0.9221 | 0.0445 |
| 0.0623 | 0.1139 | 0.8861 | 0.1075 |
| 0.0713 | 0.1287 | 0.8713 | 0.1399 |
| 0.1275 | 0.2134 | 0.7866 | 0.3595 |
| 0.1496 | 0.2433 | 0.7567 | 0.4390 |
| 0.1531 | 0.2479 | 0.7521 | 0.4508 |
| 0.1583 | 0.2547 | 0.7453 | 0.4681 |
| 0.1586 | 0.2550 | 0.7450 | 0.4690 |
| 0.1648 | 0.2629 | 0.7371 | 0.4889 |
| 0.1660 | 0.2645 | 0.7355 | 0.4927 |
| 0.1758 | 0.2767 | 0.7233 | 0.5226 |
| 0.1758 | 0.2767 | 0.7233 | 0.5226 |
| 0.2185 | 0.3265 | 0.6735 | 0.6335 |
| 0.3136 | 0.4205 | 0.5795 | 0.7904 |
| 0.4473 | 0.5226 | 0.4774 | 0.8931 |
| 0.6533 | 0.6342 | 0.3658 | 0.9516 |
| 0.7064 | 0.6566 | 0.3434 | 0.9590 |
| 1.6295 | 0.8554 | 0.1446 | 0.9911 |
| 2.7647 | 0.9294 | 0.0706 | 0.9951 |
Table text extracted from the original PDF; superscript letters are shown inline. The original table image is below.
View original table image
| n C | 20 | 30 | 40 | 50 | 60 | 70 | 80 | 90 | 100 |
|---|---|---|---|---|---|---|---|---|---|
| 1 | 0.0260 | 0.0171 | 0.0127 | 0.0102 | 0.0084 | 0.0072 | 0.0063 | 0.0056 | 0.0050 |
| 2 | 0.0541 | 0.0351 | 0.0260 | 0.0206 | 0.0171 | 0.0146 | 0.0127 | 0.0113 | 0.0102 |
| 3 | 0.0847 | 0.0541 | 0.0398 | 0.0314 | 0.0260 | 0.0221 | 0.0193 | 0.0171 | 0.0153 |
| 4 | 0.1180 | 0.0742 | 0.0541 | 0.0426 | 0.0351 | 0.0299 | 0.0260 | 0.0230 | 0.0206 |
| 5 | 0.1547 | 0.0954 | 0.0690 | 0.0541 | 0.0445 | 0.0377 | 0.0328 | 0.0290 | 0.0260 |
| 6 | 0.1952 | 0.1180 | 0.0847 | 0.0660 | 0.0541 | 0.0458 | 0.0398 | 0.0351 | 0.0314 |
| 7 | 0.2403 | 0.1421 | 0.1010 | 0.0783 | 0.0640 | 0.0541 | 0.0468 | 0.0413 | 0.0370 |
| 8 | 0.2910 | 0.1677 | 0.1180 | 0.0911 | 0.0742 | 0.0626 | 0.0541 | 0.0476 | 0.0426 |
| 9 | 0.3484 | 0.1952 | 0.1359 | 0.1043 | 0.0847 | 0.0712 | 0.0615 | 0.0541 | 0.0483 |
| 10 | 0.4142 | 0.2247 | 0.1547 | 0.1180 | 0.0954 | 0.0801 | 0.0690 | 0.0607 | 0.0541 |
Table text extracted from the original PDF; superscript letters are shown inline. The original table image is below.
View original table image
| t/λ | F(t) | rm | C=1 | C=2 | C=3 | C=4 | C=5 | C=6 | C=7 | C=8 | C=9 | C=10 |
|---|---|---|---|---|---|---|---|---|---|---|---|---|
| 0.0038 | 0.0076 | 0.9924 | 132 | 265 | 397 | 529 | 662 | 794 | 926 | 1059 | 1191 | 1323 |
| 0.0414 | 0.0779 | 0.9221 | 13 | 26 | 38 | 51 | 64 | 77 | 90 | 103 | 115 | 128 |
| 0.0623 | 0.1139 | 0.8861 | 9 | 18 | 26 | 35 | 44 | 53 | 61 | 70 | 79 | 88 |
| 0.0713 | 0.1287 | 0.8713 | 8 | 16 | 23 | 31 | 39 | 47 | 54 | 62 | 70 | 78 |
| 0.1275 | 0.2134 | 0.7866 | 5 | 9 | 14 | 19 | 23 | 28 | 33 | 37 | 42 | 47 |
Table text extracted from the original PDF; superscript letters are shown inline. The original table image is below.
View original table image
Reliability Curve for Lomax distribution
In support to Table 5 a graph is presented in Fig. 1 by taking the reliability of the lot or batch in x-axis and the probability of rejection in y-axis. In the Fig. 1the point at which the tangent touches the x-axis is taken as r t and the point at which the normal touches the x-axis is taken as r n . At the intersection of the tangent line, normal line and the reliability curve, a line is drawn towards the x-axis and the point is denoted by r m . This point r m is the Minimum Assured Reliability. From the Fig. 1 it can be observed that whenever the reliability of the lot increases, the Probability of rejection decreases.
Illustration 1
In an electric bulb manufacturing company if the consumer expects an operating reliability rate Z * as 0.3325 and if t/λ = 0.1275, determine the GRS -Lomax reliability sampling plan.
Solution:
From Table 1, the maximum allowable failures corresponding to the given operating reliability rate Z * = 0.3325 is C = 5.
From Table 3 the minimum sample size for the given t/λ and the corresponding survival unit C = 5 is n=23. Hence S = n-C = 17.
Hence the algorithm for sentencing the lot is as follows:
Step 1: Draw a random sample of size 23 and put them into life test for a specified time 13 hours (t/λ=0.1275) under type I censoring.
Step 2: Count the number of specimens successful in the test. Let it be S.
Step 3: If S ≥ 5, the lot is accepted.
Step 4: If S < 5, the lot is rejected. From Table 5, it is found that the Guaranteed Reliability is 0.7866 and the corresponding probability of rejection of the reliability sampling plan under Lomax distribution is 0.3595.
Comparative study (i) Table 6:
In the Table 6 the sample size values of two different plans namely GRS-Lomax plans and the ordinary log logistic plans are compared. It is evident from Table 6 that GRS plans require minimum sample sizes when compared to the Log-logistic plans. So these plans could be chosen to reduce the inspection cost and to get minimum assured reliability.
| t/σ | C | MARS Lomax (n) | Log- logistic (n) |
|---|---|---|---|
| 0.628 | 1 | 2 | 16 |
| 0.942 | 2 | 3 | 14 |
| 1.257 | 3 | 4 | 13 |
| 1.571 | 4 | 5 | 13 |
| 2.356 | 5 | 5 | 13 |
| 3.141 | 6 | 6 | 14 |
| 3.927 | 7 | 7 | 15 |
| 4.712 | 8 | 8 | 16 |
Table text extracted from the original PDF; superscript letters are shown inline. The original table image is below.
View original table image
Conclusion
In this article Guaranteed Reliability Sampling (GRS) plans using Lomax distribution have been developed for intermittent inspection. The drawback faced during the implementation of reliability sampling plans is eliminated by giving guaranteed reliability value to the customer. In industries once termination time is fixed, the reliability value fluctuates due to sporadic production and changes in number of failures. These drawbacks are eliminated in GRS Plans. The main advantage in GRS plan is that reliability is assured before accepting the lot or batches. Since the termination time is fixed based on past experience the cost of testing is also reduced. Another advantage is the reduction in the sample size which support lesser in cost of inspection. Hence one can make use of GRS-Lomax reliability sampling plans in any quality control section.
References
19 in the original paper- Chahkandi M, Ganjali M. On Some Lifetime Distributions with Decreasing Failure Rate", Computational Statistics and Data Analysis. 2009; 53:4433-4440.
- Balkema AA, De Hann. Residual Life at Great Age, Annals of Probability. 1974; 2:972-804.
- Devaarul S. Certain Studies Relating to Mixed Sampling Plans and Reliability Based Sampling Plans, Ph.D., Thesis, Department of Statistics, Bharathiar University, Coimbatore, Tamil Nadu, India, 2002.
- Devaarul S, Jemmy Joyce V. Designing and Selection of Reliability Sampling Plans Based on Minimum Angle Technique, International Journal of Mathematics and Computation. 2013; 20(3):60-65.
- Suresh KK, Devaarul S. Maximum Acquired Reliability Sampling (MARS) Plan", Far East Journal of Theoretical Statistics. 2003; 10(1):25-32.
- Lomax KS. Business failures: Another Example of the Analysis of Failure Data", Journal of the American Statistical Association. 1954; 49:847-852.
- Kim SH, Yum BJ. Comparisons of Exponential Life Test Plans with Intermittent Inspection", Journal of Quality Technology, 2000; 32:217-230.
- Park JI, Yum BJ. Design of Reliability Acceptance Sampling Plans Based on Accelerated Degradation Tests, Asia Pacific Management Review. 2001; 6(4):461-476.
- Kantam RRL, Rosaiah K. Half Logistic Distribution in Acceptance Sampling Based on Life Tests", IAPQR Transactions. 1998; 23(2):117-125.
- Kantam RRL, Rosaiah K, Rao GS. Acceptance Sampling Based on Life Tests: Log-Logistic Model", Journal of Applied Statistics. 2001; 28:121-128.
- Mughal AR, Aslam M, Hussain J, Rehman A. Economic Reliability group Acceptance Sampling Plans for Lifetimes Following a Marshall-Olkin Extended Distribution, Middle Eastern Finance and Economics. 2010; 7:87-93.
- Lio YL, Tsai TR, Wu SJ. Acceptance sampling plans from truncated life tests based on the burr type XII percentiles Journal of the Chinese Institute of Industrial Engineers. 2010; 27(4):270-280.
- Al-Awadhi SA, Ghitany ME. Statistical Properties of Poisson-Lomax Distribution and its Application to Repeated Accidents Data", Journal of Applied Statistical Science. 2001; 10:365-372.
- Childs A, Balakrishnan N, Moshref M. Order Statistics from Non-identical Right Truncated Lomax Random Variables with Applications, Statistical Papers, 2001; 42:187-206.
- Hassan AS, Al-Ghamdi AS. Optimum Step Stress Accelerated Life Testing for Lomax Distribution, Journal of Applied Sciences Research. 2009; 5:2153-2164.
- Cramer E, Schmidt AD. Progressively Type-II Censored Competing Risks Data from Lomax Distributions", Computational Statistics and Data Analysis. 2011; 55:1285-1303.
- Soundararajan V. Maximum Allowable Percent Defective (MAPD) Single Sampling Inspection by Attributes Plan, Journal of Quality Technology. 1975; 7(4):173-177.
- Fertig KW, Mann NR. Life Test Sampling Plans for Two Parameter Weibull Populations, Technometrics. 1980; 22:165-177.
- Bassiouny AH, Abdo NF, Shahen HS. Exponential Lomax Distribution, International Journal of Computer Applications. 2015; 121(13):24-29.