
Research article · 2020 · Full text
International Journal of Geography Geology and EnvironmentForest fire occurrence, distribution and future risks in Arghakhanchi district, Nepal
Volume 2(1) · Pages 10–20
Research areasFire effects on ecosystems
Abstract
Author-writtenForest fire has proved to be a major uncontrolled disaster which causes imbalances in ecosystem and endangers the biodiversity but the research related to this is very limited so far in Nepal. Thus, this study was objectively carried out to identify the occurrence and distribution of forest fire and its drivers and risk zone applying spatial analysis. MODIS hotspot satellite data from 2002 to 2018 and other variables were integrated using geo spatial technique. The topographic and land cover related data archived from International Center for Integrated Mountain Development and Land Processes Distributed Active Archive Center from NASA official website. The forest fire point and burnt area related shape file archived from the MODIS data as data sources for this study. The layers of each variable were prepared and overlaid on it to assess the forest fire risk zone. Altogether 120 GPS points collected from field and 12 focus group discussion was done to find the fire risk zone. The collected data were analyzed using ArcGIS. The result shows those total 391 hotspots were recorded by MODIS satellite from 2002 to 2018. Out of this, the highest fire count was in Sitganga municipality with 284. Total 121 in forest fire occurrence was in 2016 but single event was recorded in 2002. It was about 2, 51, 722.31 ha area burnt between 2002 to 2018. The forest area close to settlement area and road less than 1000 m was more prone to the forest fire. Fire occurrence was the highest 168 in broadleaved closed forest. The highest 77 fire incidents were recorded in southern aspect. The highest fire incidents was recorded at higher than 35 degree but very less number of fires occurred in slope less than 5%. Temperature range greater than 33 °C is more prone to fire, which recorded about 106 in number. It showed that, Sitganga and Sharada municipality are at the highest risk of fire zone. This study will help to establish the baseline data for monitoring the forest fire.
Summary
Source-checkedPlain-language reading of the full paper, prepared with AI and checked against the text. Each point links to the authors' own words.
Why it matters
- Forest fires are significant uncontrolled disasters in Nepal that threaten biodiversity and ecosystem balance, yet they remain under-researched. View evidence ↗
- Arghakhanchi district is identified as one of the eighteen districts in Nepal with a very high risk of forest fires. View evidence ↗
The question
- The study aimed to use spatial analysis to identify the occurrence, distribution, drivers, and risk zones of forest fires in the Arghakhanchi district. View evidence ↗
What they did
- The researchers integrated MODIS hotspot satellite data spanning from 2002 to 2018 with other variables using geospatial techniques. View evidence ↗
- Field data collection included 120 GPS points and 12 focus group discussions to help determine fire risk zones. View evidence ↗
- A forest fire risk zone (FFRZ) model was developed using a weighted overlay of land cover (LC), temperature (LST), slope (S), distance from roads (DR), distance to settlements (DS), aspect (A), and elevation (E). View evidence ↗
What they found
- Between 2002 and 2018, the MODIS satellite recorded a total of 391 hotspots in the district. View evidence ↗
- Sitganga municipality experienced the highest number of fire incidents, with 284 recorded counts. View evidence ↗
- Broadleaved closed forests were the most affected land class, with 168 fire occurrences. View evidence ↗
- The southern aspect was the most prone to fire, recording 77 incidents. View evidence ↗
- Fire incidents were most frequent on slopes greater than 35 degrees, while slopes less than 5% had very few fires. View evidence ↗
- Temperatures exceeding 33 °C were associated with higher fire risk, recording approximately 106 incidents. View evidence ↗
- Forest areas located within 1000 meters of roads and settlements were more susceptible to fire. View evidence ↗
- The risk zonation analysis identified Sitganga and Sharada municipalities as being in the highest risk zones. View evidence ↗
What it means
- The authors conclude that maintaining a proper database and detailed record-keeping is essential for the effective management of forest fires. View evidence ↗
Visual summary
1 visualsIllustrations explain the paper; they do not show study data.
Fire Risk Model Components
AI-generated conceptual illustration (The landscape of Arghakhanchi district, Nepal). It explains the idea and does not show study data.
View source evidence ↗Figures & tables
From the original paper Table 1
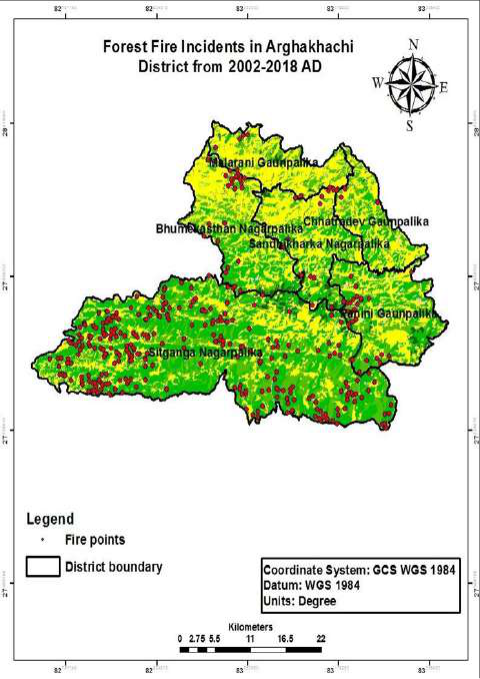 Figure 1
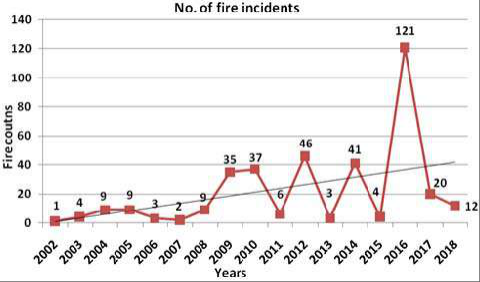 Figure 2
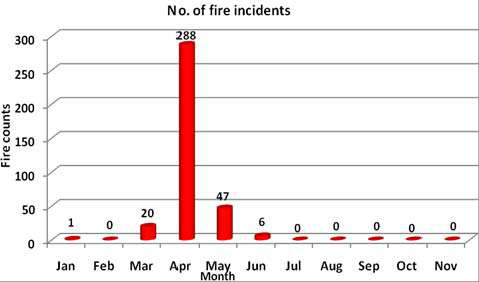 Figure 3
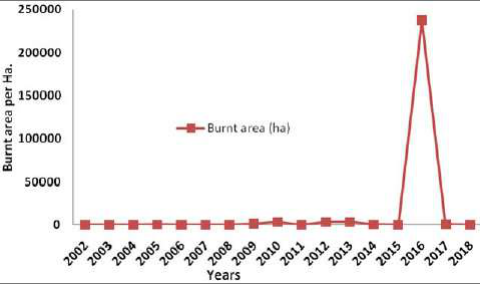 Figure 4
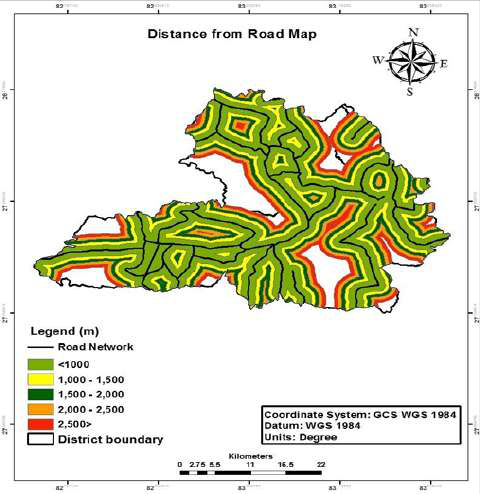 Figure 5
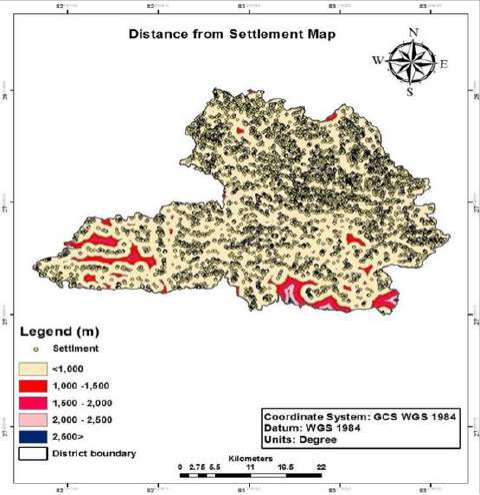 Figure 6
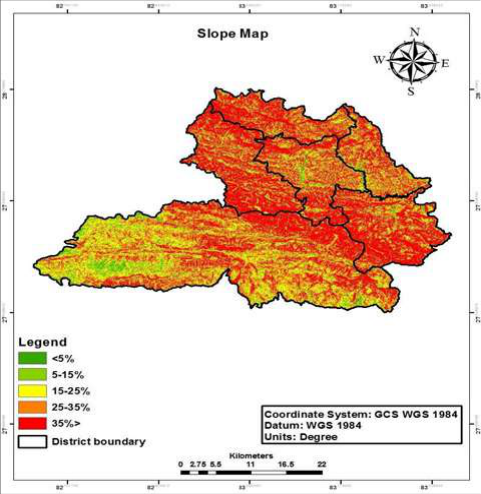 Figure 7
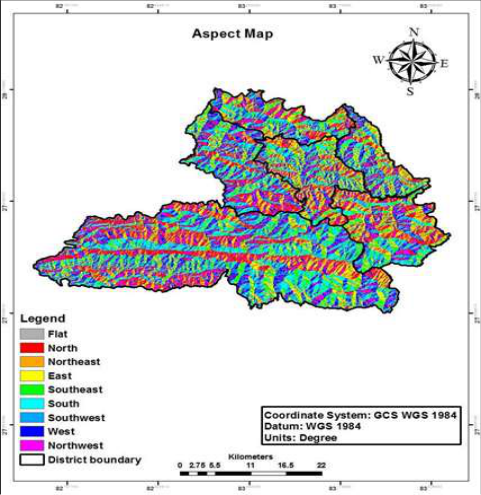 Figure 8
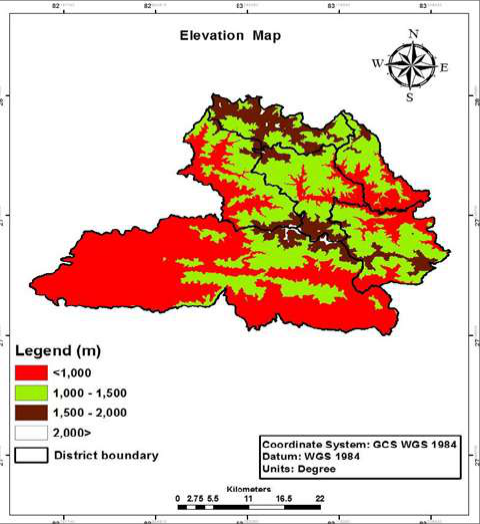 Figure 9
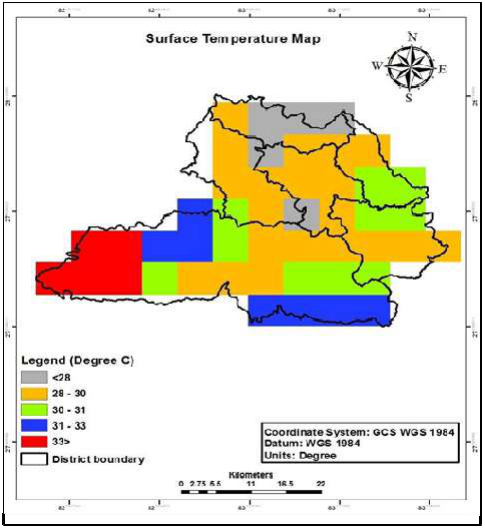 Figure 9
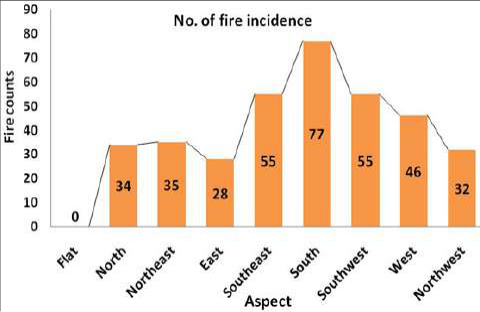 Figure 11
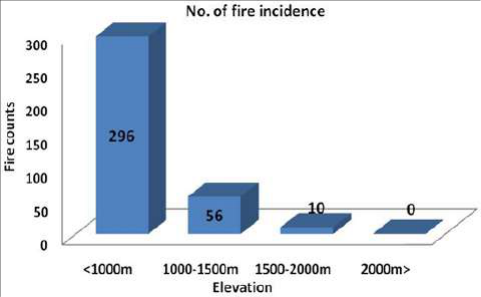 Figure 12
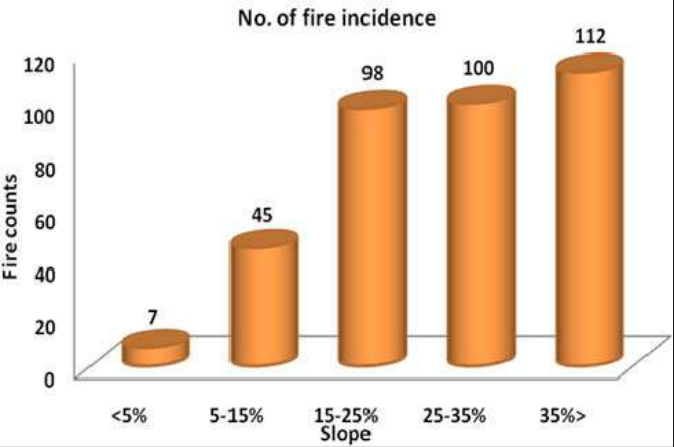 Figure 13
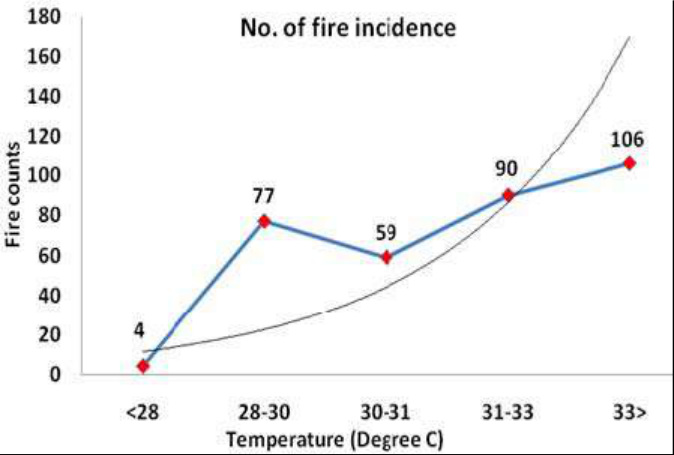 Figure 14
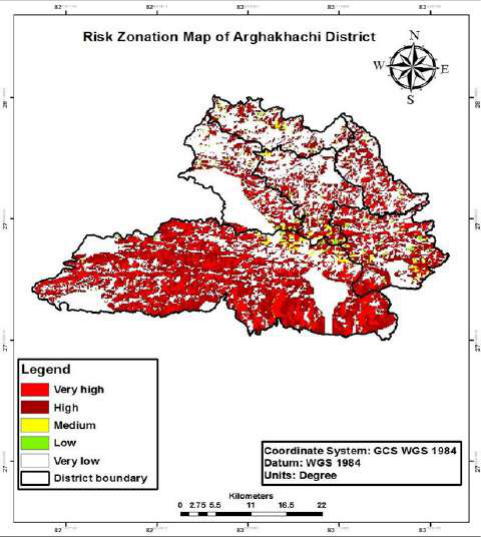 Figure 15
Introduction
Forest fire has proved to be major uncontrolled disaster that occurs in nature which causes imbalances in ecosystem and endangers the biodiversity by reducing the floral and faunal wealth. Fires in forests and outside forest have strong influences on natural resources, human health, weather and climate (Eiji at el 2007) [32] . Fire is a major factor in shaping the history of vegetation in most of the terrestrial environment in the world and if properly used fire can be an ecological tool of great value (Odum and Barrett, 2010) [60] but when it uncontrolled it becomes too destructive. Especially wildfires are creating major risk to the biodiversity, forests and forest products. Fire and its impacts can be viewed as desirable or non-desirable, based on the compatibility with overall objectives (Wade & Lundsford, 1990) [83] . Department of Forest (DoF) and International Centre for Integrated Mountain Development (ICIMOD), jointly have developed a fire detection and monitoring system for Nepal using Moderate Resolution Imaging Spectroradiometer (MODIS) data with the support of United States Agency for International Development (USAID) and National Aeronautics and Space Administration (NASA) (ICIMOD, 2012) [50] . The Government of Nepal (GoN) has prepared Forest Fire Management Strategy (FFMS) 2010 aiming to proceed through the strategy and control forest fire incidence in the country. It also identifies that there is the lack of coordination between the concerned stakeholders (GoN, 2011). Arghakhanchi district is recognized as the fire prone area in Nepal but there is no any research related to this so far. So, this study is an attempt to map fire-prone forest areas in Arghakhanchi district using Geographic Information System (GIS) and to assess the management practices and its success and failure. Incidence of forest fire in the district from 2002-2018were acquired from the Fire Information for Resource Management System (FIRMS) and ICIMOD Nepal, which integrates remote sensing and GIS technologies to deliver global MODIS hotspot fire location and fire risk zone information to natural resource managers and other stakeholders around the world. This study also utilized the data given by MODIS to find fire areas in forest so that effective ground verification was carried out on forest of Arghakhanchi district and data given by NASA is merged to obtain high accuracy and valid result. Arghakhanchi district is highly threatened by fire and also it is one of the eighteen districts of Nepal with very high fire risk zone (Martin et al, 2017) [57] . In this case of Arghakhanchi until now no studies on fire behavior from forest fires have been conducted. Hence, this study will help to establish baseline data of forest fire information, understanding the causes of forest fire drivers, hotspot of fire risk zonation, seasonality and create fire risk zonation map and their temporal and spatial pattern that helps to local authorities.
Research Methodology
The study was carried out in whole area including (3municipalities and 3 rural municipalities) of Arghakhanchi district. The geographical location of the district is Latitude28 0 00'1.80''N latitude and 83 0 14'28.
Primary data collection:
The primary information was collected by using PRA tools like Focus Group Discussion and direct field observation at the selected high forest fire prone area of study area.
Focus Group Discussion: Total 12 focus group discussion with different community forest groups alone with the representative from local government was carried out in the district. Purposive sampling was done to select the sites and groups. To select it, at first MODIS data was overlayed in the district and on the basis of frequency of occurrences of forest fire provided by the MODIS data, five risk categories will be made, i.e very high, high, medium, low and very low. 2 focus group discussion was made on each risk categories.
Ground Truth Verification:
To check the accuracy of the MODIS data, random fire points from different community forest along with the attributes like fire occurred date, time and month was recorded.
MODIS data: Information for Resource Management
System (FIRMS) provides information on active fires using the Moderate Resolution Imaging Spectroradiometer (MODIS) instrument on board NASA's Aqua (evening) and Terra (morning) Satellite (NASA/University of Maryland, 2002). Furthermore, ICIMOD also provides the information of active forest fire in Nepal. MODIS data from NASA's Terra (Afternoon) and Aqua (Morning) earth monitoring satellites, and provides the processed data to universities and research institutes as part of the academic frontier project. The MODIS active fire product detects fires in 1km x 1km pixels that are burning at the time of overpass under relatively cloud-free conditions (Giglio et al., 2003; Giglio, 2007) [48,49] . In concern to Nepal, it does not have own reliable information, tools and technology for the detection and monitoring due to which MODIS vector data will be downloaded from NASA's official website. The forest fire point and burnt area related shape file archived from the MODIS data as data sources for this study.
Required data for fire risk zone model: The data which was necessary were obtained from different websites, institutions and organizations. Historical fire data of the Arghakhanchi district was selected from NASA forest fire data. Land cover (2010) and Road Network were obtained from ICIMOD, Forest type and settlements of Arghakhanchi district were obtained from Department of Forest Research and Survey (DFRS). District boundary was obtained from Department of Survey; ASTER Digital Elevation Model (DEM) was obtained from LP DAAC NASA's website and Slope and Aspect was prepared from ASTER DEM using ArcGIS 10.5. These data was used for fire risk zone modeling.
Ground verification: Data given by NASA (MODIS active historical fire data) was verified by doing random verification in certain areas of the district for the valid result. Altogether 120 GPS points collected from field.
Desk review:
The collected related district annual management plans, progress reports and related literatures published on various journals were reviewed through desk review process. The other relevant information was collected from Divisional Forest Office, District Coordination Committee, Department of Forest, previous records, maps, publications, reports of other line agencies, published or unpublished and other relevant literatures from websites was reviewed as secondary data for better understanding, interpretation, and analysis of the research.
Fire sensitive or risk zonation: Kernel density model was used to find out the high, medium and low risk or sensitive zone of the district. It is necessary to estimate density to know where the fire incidence is more concentrated. Kernel density calculates magnitude per unit area from point using kernel function to fit smoothly tapered surface to each point.
Fire risk modeling involved several steps: Several studies have proposed the integration of variables into a single fire model (Hernandez et al., 2006; Carrão et al., 2003; and Jaiswal et al., 2002) [53] . Several types of factors and parameters are required for forest fire risk zone modeling. In delineating forest fire risk zone mapping, all seven thematic layers of parameters such as slope, landcover, aspect, distance from roads, distance to settlements, and elevation. Chuvieco and Congalton (1989) [17] suggest a hierarchical scheme of fire rating which was followed in this study. Layers of importance from highest to lowest were as follow: land cover, vegetation, slope, aspect, temperature, Proximity to roads, proximity to settlements and elevation (Chuvieco and Congalton, 1989) [17] . These all parameters were correlated to historical fires data. Aspect of the DEM (digital elevation model) and Euclidean distance of road to forest fire occurrence in the study area were calculated. Based on the MODIS active fire historical fire data from 2002 to 2018, the classes of the different cause factors (distance of settlement, aspect, and land cover) were reclassified based on the risk they represent. To rank the classes of the input layers according to their importance to their importance as being vulnerable to fire, the forest fire hotspot and the reclassified data were overlaid to identify classes of particular layer with more frequent fire incidents. Classes with high fire occurrence were assigned a higher rank and classes with less positive relation to fire occurrence were ranked lowest. The classes of each dataset were ranked in a scale of 1-5, particualry1 being the highest ranking, 2 as high; 3as medium; 4as low and 5as the very low. Once all layers were reclassified and each assigned a rank, a model was developed to overlay this data according to defined weights in order to produce a fire risk map of Arghakhanchi district. Using the Spatial Analyst (Weighted Overlay) tool in ArcGIS model builder the input layers have been given weights that all add up to 100%. In order to obtain effective and more accurate conclusions mathematical operations in GIS analysis formed. The fire risk model can be summarized in the following equation:
Where FFRZ are forest fire risk zone index, where LC indicates land cover variables with 5 class, S indicates slope variables with 5 classes. A indicates aspect variables 5 classes, E indicates elevation variables of distance from roads and settlement .Finally, a FFRZ map was produced based on these analyses by using ARC GIS software. The relative weights for variables were chosen based on the literature ( [17,53,76] and ratings among the different classes within each variable were chosen based on historical data analysis. Based on literature review, advisor's advice, consultant suggestion, land cover was weighted the highest, followed by slope, aspect, elevation and distance to roads, settlements. Each layer was assigned a scale starting with 1, 2, 3, 4 and 5 with 1 being the highest risk and 5 as the lowest risk.
Land cover was evaluated first as an estimate of fuel available for a fire. Weighting of the classes in the land cover layer were determined by the moisture; the dryer the vegetation, the higher the risk of flammability. Temperature layer was evaluated .It was divided into five categories. Temperature greater than 33 °C was given the highest weight 31-33 °C was given the high rank, temperature 30-31 °C was ranked as medium group. Temperature between 28-30 °C was ranked as low group and finally temperature less than 28 °C was given the very low category. Slope was the third factor to be evaluated. Weighting was determined by the fact fire travels more rapidly up slope. The slope layer was divided into five groups: less than 5% as very low risky, slope 5%-15% as a low, slope range 15% to 25% (medium), slope 25% to 35% (High) and slope greater than 35% (very high risky). The distance from roads was evaluated since nearby areas have a higher risk of a fire. The buffer layer was divided into five groups. The areas within a Euclidean distance of less than 1000 meters was noted as very high, between 1000 to 1500meters was assigned high risk, between 1500 to 20000 meters was noted medium risk, between 2000 to 2500meter was assigned low risk and areas with a distance greater than 2500 meters were identified as very low risk. The fifth layer evaluated was proximity analysis. Proximity to settlements had a similar weighting as the distance from settlement. Proximity was divided into five groups. Areas less than 1000m as very high risk, 1000m to 1500m as high, 1500m to 2000m as medium, 2000m to 2500m as low and areas within a distance greater than 2500 meters as very low risk. Elevation layer was evaluated. This layer was divided into Four categories. Areas with an elevation less than 1000m was assumed as very high risk and areas between (1000-1500)m was assumed as high, elevation 1500m to 2000m where assumed as medium and. Finally Elevation greater than 2000m was assummed as very low. Aspect layer was evaluated. It was divided into seven categories. South aspect was given the highest weight due to a higher insolation. Southeast and South west was weighted as high risk, while East and West were weighted as medium risk, Northwest and Northeast where weighted as low risk and Northeast and North where weighted as very low risk. The following table shows different risk classes with different values range of different parameters. These tables are used in the reclassification of different risk maps in the models (Table 1).
| Land Cover | Temp 0C | Slope percent | Distance to Road (m) | Proximity to Settlement (m) | Elevation (m) | Aspect |
|---|---|---|---|---|---|---|
| Broad leaved Closed Forest | >33 (1) | >35 (1) | <10000 (1) | <1000 (1) | <1000 (1) | South (1) |
| Broadleaved Open Forest | 31-33 (2) | 25-35 (2) | 1000-1500 (2) | 1000-1500 (2) | 1000-1500 (2) | South west and south east (2) |
| Grassland | 30-31 (3) | 15-25 (3) | 1500-2000 (3) | 1500-2000 (3) | 1500-2000 (3) | West and East (3) |
| Shrub Land | 28-30 (4) | 5-15 (4) | 2000-2500 (4) | 2000-2500 (4) | >2000 (5) | North west and North east (4) |
| Barren Land | <28 (5) | <5 (5) | >2500 (5) | >2500 (5) | North (5) |
Table text extracted from the original PDF; superscript letters are shown inline. The original table image is below.
View original table image
Results
Results
Spatial and Temporal Distribution Pattern of Forest Fire Occurrence and Burnt Area:
The result shows those total 391 hotspots were recorded by MODIS satellite from 2002 to 2018. Out of total detection, about 362 fires were recorded with greater than 30% confidence. Fire distribution pattern for the last 17 year are presented which shows that Sitganga municipality accounted to have highest fire count with about 284 and it was followed by Bhumekasthan municipality and Panini rural municipality which is 27 and 26 in numbers. Sandhikharka municipality accounted about 13 and Malarani rural municipality account about 9 numbers of fire incidents in District. whereas the least fire count is seen in Chhatradev rural municipality which is about 3 in numbers which is shown in fig 1.
Month wise fire incidents
There was a large variation in the monthly pattern of fire occurrence; with April being the most significant having highest numbers of fire. Generally, two months April and May are the peak months of fire occurrence in the district while March has significantly few fires than January and June and the remaining months have no fire occurrence, however the district has not seen fire in the months February, July, August, September, October and November (Figure 2 & 3).
Spatial and temporal distribution of burnt area
Result showed that, a total of 251,722.31 ha area was burnt throughout the study period. The maximum number of forest fire was in 2016. The area was burnt extremely higher in 2016 covering 94.37% (figure 4). Driving Factors of Wildfire Incident: Distance from settlement map: Anthropogenic variable such as increased proximity to settlement has been identifies as increasing the risk of forest fire ignition (Sowmya and Somashekar, 2010). Here, the result too shows the same. The forest area close to settlement area less than 1000 m was more prone to the forest fire than the forest of distance with 1000m far. It is so because the settlement areas act as promoter and barrier of the fire. This study also shows that the forest, close to the settlement area was more prone of fire (figure 5). [17,53] . Hence for slope study, DEM was used and slope was extracted using GIS. The surface slope in this study ranges varies from less than 5 degree to greater than 35 degree so this area is high prone to fire (Figure 7). Aspect Map: Aspect was generated using DEM and has been classified into nine classes such as shown in figure . South and southwest aspects are said to be favourable for fire to start and spread as it receives higher solar radiation which creates lower humidity and higher fuel and soil temperature (Pyne et al., 1996, Chavan et al., 2012, Yakubu et al., 2015 et al., 2012, Yakubu). [18] to generate the risk model. Hence elevation in this model has been used assuming that it has direct relation with humidity and fuel combustion. In this study the elevation ranges from 1000m to 2000m (figure 9).
Forest Fire Incident in Topographic Features and based on elevation:
The results show that a large number of fire incidents were in southern aspect which is 77 in numbers which is followed by south east and south west which is 55 in number. Higher number of forest fires occurred in area range below 1000m elevation. About 81.76% of the fires were recorded in the areas below the elevation of 1000m, whereas 18.23% of the incidences occurred in areas from 1000m to 2000 m . 0% of forest fire occurred above 2000m (msl). Hence comparatively lower elevation has more prone to forest fire than higher elevation which is shown in fig 11 and12. Result shows that, Number of fire incidents received higher in slope greater than 35% degree and Very less number of fires occurred in slope less than 5%. Hence, Forest fire is more in upslope than lower slope.
Climatic Factor Temperature: Temperature is one of the main factor causing the forest fire. With the increases in temperature number of fire incidents were also increases. Temperature range greater than 33 °C is more prone to fire, which recorded about 106 in number. The vice versa is also true, in case of less than 28 °C, fire records only 4 in (figure 13 and14).
Discussions
The spatial and temporal distribution patterns of forest fire since 2002 to 2018 were analyzed. The result shows those total 391 hotspots were recorded by MODIS satellite from 2002 to 2018. Out of total detection, about 362 fires were detected with greater than 30% confidence. Research shows most of fire incidents during April followed by May which is consistent with previous study conducted by Ghimire, 2014 [47] . Bhatta (2014) has also observed increasing trend of fire incidents from 2001 to 2013. The fire events in this research from MODIS active fire data showed fire events from March to May making this consistent with previous studies in the country (Bajracharya, 2002 [9] ; Sharma, 2006 [72] ; Parajuli et al., 2015 [61] Also the reason for fire peak in March to May may be because of large fuel loads accumulation due to leaves shed by trees, weeds, undergrowth having low moisture content only because of high temperature, low relative humidity and precipitation and high wind velocity in this season (Van Wilgen et al., 2004) [82] . Result shows that, Forest fires occur higher in broadleaved closed forest followed by broadleaved open forest. Out of 362 fire incident in District, about 168 fire was observed in broadleaved closed forest, 95 fire was observed in broadleaved open forest.72.65% fires incidents count in broadleaved forest. 46.40% detected in broadleaved closed forest and 26.62% detected in broadleaved open forest. My result also shows that, highest number of forest fire was detected in broadleaved closed forest which coincides with previous study conducted by Martin et al 2017 [57] . Matin et al., (2017) also mentioned that the frequency of forest fire is more in broadleaved forest during March to May because broadleaved forest experiences heavy leaf fall resulting huge accumulation of fuels. My research states that, higher number of forest fires occurred in area range below 1000m elevation. About 81.76% of the fires were recorded in the areas below the elevation of 1000m, whereas 18.23% of the incidences occurred in areas from 1000m to 2000 m (Fig. 20). 0% of forest fire occurred above 2000m (msl). Hence comparatively lower elevation has more prone to forest fire than higher elevation which coincides with previous study conducted by Matin [47] . Temperature is one of the main factor causing the forest fire. With the increases in temperature number of fire incidents increases .Temperature range greater than 33°c is more prone to fire, which records about 106 in number. With decreases in temp. no of fire also reduced and less than 28°c, fire records about 4 in number which is similar to Matin et al., (2017). It has been suggested that higher the temperature higher is the risk of forest fire (Hussien et al., 2008; Farukh et al., 2009; Miller et al., 2012; Khanal, 2015 [61] ; Matin et al., 2017). Result shows that, Forest fire occurs higher while settlement distance is in below 1000 m and very low while settlement distance is greater than 2500m. About 80.90% of forest fire occurred in below1000 m, 10.50% while settlement distance is in between1000-1500m and 0.60%when settlement distance is greater than 2500m. While making the fire risk zone it was predicted that the distance near to habitat for 1000m. The similar events were recorded by Hussien et al., (2008) where he argues that people usually know that forest fire is illegal hence to avoid charges they would rather start away from the settlement because they will know that no one will see them. Hence, my result signifies that, forest fire decrease with increase of distance from settlement which is consistent with previous study conducted by Saklani, 2008. Result shows that the distance near to road is more vulnerable for forest fire which records about 43%,21% incident in area with distance of 1000-1500m and 8% incidence in area greater than 2500m.which is similar with the research conducted by Hussien et al., (2008) In addition. Matin et al., (2017) stated that 40% of fires were recorded within the range of 1km in Nepal. Keeley and Fotheringham (2003) also cited that anthropogenic ignitions occur frequently along the road corridors and other areas where human activity is high. Out of the 18 vulnerable district, my studied area ranked in 9^th fire prone area which is similar to previous study conducted by Ghimire (2014) [47] .
Conclusion and recommendations
The higher forest fire recorded in April month. It covers 79.5% of fire in month of April and it is followed by May. About 99.72% forest fire was detected in four months. Slope greater than 35% was more vulnerable to forest fire which record about 30.93%. With the decrease in slope, the occurrence rate of forest fire also decreased. On the basis of fire incidents, highest numbers of records were found in the Sitganga municipality (78.45%) followed by Bhumikasthan municipality (7.45%) and Panini rural municipality (7.18%) suggesting fires are typically high in the area near to Terai belt. With the increase in temperature, the rate of forest fire also inceases. Temperature greater than 33°c was more prone to fire according to the research. Complete and detailed record keeping and proper database is essential to mage the fire occurrence properly.
Figures and tables from the paper
References
85 in the original paper- Acharya KP, Dangi RB. Forest Degradation in Nepal: Review of data and methods. Forest resource assessment programme. Working Rome, Italy, 2009, 163.
- Agrawal A, Ostrom E. Collective action, property rights, and decentralization in resource use in India and Nepal. Politics and Society. 2001; 29:485-514.
- Agrawal A, Britt C, Kanel K. Decentralization in Nepal: a comparative analysis. ICS Press, Oakland California, USA, 1999.
- Ainuddin AA. Forest fire in Malaysia: An overview. International Forest Fire News. Food and Agriculture Organization of United Nations. 1998; 18:51-52.
- Alexandrian D, Esnault F, Calabri G. Forest Fire in Mediterranean area. Unasylva. 1999; 197:35-41.
- Angelstam Per. K. Maintaining and restoring biodiversity in European boreal forest by developing natural disturbance regimes. J Veg. Sci. 1998; 9:593602.
- Anon. Aviation and forest fire management, Forest fire fundamentals, Ontario Ministry of Natural Resources, 1999.
- Attiwill PM. The disturbance of forest ecosystem: The ecological basis for conservation management. For. Ecol. Manag. 1994; 63:247-300.
- Bajracharya KM. Forest Fire Situation in Nepal. International Forest Fire News Food and Agriculture Organization of United Nations. 2002; 26:84-86.
- Barbosa P, Camia A, Kucera J, Liberta G, Palumbo I, San-Miguel-Ayanz J et al. Assessment of forest fire impacts and emissions in the European Union based in the European forest fire information system. Developments in Environmental Science. 2009; 8:197208.
- Bergeron Y, Harvey B. Basing silviculture on natural ecosystem dynamics: An approach applied to the southern boreal mixed wood forest of Quebec. For. Ecol. Manag. 1997; 92:235-242.
- Bright AD, Newman P, Carroll J. Context, Beliefs and Attitude towards Wild land Fire Management: An Examinations of Residents of the Wild land-Urban Interface. Human Ecology Review. 2007; 14(2):212222.
- Brown AA, Davis KP. Principles of Geographical Information System for Land Resource Assessment, Clarendon, Oxford, 1973.
- Chowdhury EH, Hassan QK. Operational perspective of remote sensing-based forest fire danger forecasting systems. ISPRS Journal of Photogrammetry and Remote Sensing. 2015; 104:224-236.
- Chu T, Guo X, Takeda K. Temporal dependence of burn severity assessment in Siberian larch (Larixsibirica) forest of northern Mongolia using remotely sensed data. International Journal of Wildland Fire. 2016; 25:685-698
- Chuevieco E, Sales J. Mapping the spatial distribution of forest fire danger using GIS. International Journal of Geographical Information Systems. 1996; 10:333-345.
- Chuvieco E, Congalton RG. Application of Remote Sensing and Geographic Information Systems to Forest Fire Hazard Mapping. Remote Sens. Environ. 1989; 29:147-159.
- Chuvieco E, Salas FJ, Carvacho L, Rodriguez-Silva F. Integrated fire risk mapping, in: Chuvieco, E. (Ed.), Remote sensing of large wildfires in the European Mediterranean. Springer-Verlag, Berlin, 1999, 61-84.
- Dale VH, Joyce LA, McNulty S, Neilson RP, Ayres MP, Flannigan MD et al. Climate change and forest disturbances. BioScience. 2001; 51:723-734.
- AN. Causes, consequences and management strategy for wildfires in Nepal, 2010.
- Davis R, Yang Z, Yost A, Belongie C, Cohen W. The normal fire environment Modeling environmental suitability for large forest wildfires using past, present, and future climate normals. Forest Ecology and Management. 2017; 390:173-186.
- DeBano LF, Neary DG, Ffolliott PF. Fire's Effect on Ecosystems. John Wiley and Sons, New York, New York USA, 1998.
- De Torres Curth M, Biscayart C, Ghermandi L, Pfister G. Wildland-urban interface fires and socioeconomic conditions: A case study of a Northwestern Patagonia city. Environ. Manage, 2012.
- Denman KL, Brasseur G, Chidthaisong A, Ciais P, Cox PM, Dickinson RE et al. Couplings Between Changes in the Climate System and Biogeochemistry, 2007.
- Solomon S, Qin D, Manning M, Chen Z, Marquis M, Averyt KB et al. The Physical Science Basis. Contribution of Working Group I to the Fourth Assessment Report of the Intergovernmental Panel on Climate Change. Cambridge University Press, Cambridge, United Kingdom and New York, NY, USA, DFO, report Arghakhanchi (2074/075), 2007.
- DHM, (2017) Observed Climate Trend Analysis in the Districts and Physiographic Regions of Nepal. Department of Hydrology and Meteorology, Kathmandu, 1971-2014.
- Dobriyal Manmohan, Bijalwan Arvind. Forest fire in western Himalayas of India: A Review. New York Science Journal. 2017; 10:39-46.
- Dlamini, Wisdom. (2007). A review of the July 2007 Swaziland fire disaster using GIS and MODIS data. PositionIT. 2007. 61-65.
- Donoghue LR, Main WA. Some factors influencing wildfire occurrence and measurement of fire-prevention effectiveness. Journal of Environmental Management. 1985; 20:87-96.
- Donoghue LR, Simard AJ, Main WA. Determining the economic relationship between law-enforcement activities and arson wildfires -a feasibility study in Arkansas. Journal of Environmental Management. 1987; 25:377-393.
- Efthymiou P. Mediterranean Forest Fires 2000-A Terrible and Complex Situation. EFI News, 2002, 8.
- Eiji N et al., Forest and field fire search system using MODIS data. Encyclopedia Britannica (2005). Encyclopedia Britannica Premium Service, 2007.
- European Commission. Community forest fire information system: 2003 Report Data for 1985-2001, European Commission Directorate-General for Agriculture, DG AGRI-FI, 2003.
- FAO. Wild land fire management terminology (Rome: FAO), 1986.
- FAO. State of World's Forest: 2001, Food and Agriculture organization of The United Nations, Rome, 2001.
- FAO. Community based fire management: case studies from China, the Gambia, Honduras, India, the Lao People's Democratic Republic and Turkey. RAPA publication 2003/08. Working Paper FFM/2 (FAO, Bangkok, Thailand), 2003.
- FAO. Forest Management-Global Assessment 2006. FAO Forestry, 2007, 151.
- FAO. Nepal forestry outlook study. Asia-Pacific forestry sector outlook study. FAO regional office for Asia the Pacific, Bangkok, Working paper, 2009. APFSOS II/WP/2009/05.
- FAO. Wild land fire management handbook for trainers, Food and agricultural organization of the united nation. Rome, Italy, 2010.
- Flannigan MD, Wotton BM. Climate, weather and area burned, in Johnson, 2001.
- Forest act. His majesty's government of Nepal. Ministry of law, justice and parliamentary management, 1993.
- Forest cover has increased in Nepal of late.. The Himalayan Times. Retrieved from, 2016. https://thehimalayantimes.com/nepal/forest-coverincreased-nepal-late/.
- Forest rules. His majesty's government of Nepal. Ministry of law, justice and parliamentary management, 1995.
- Gautam AP, Shivakoti GP, Webb EL. A review of forest policies, institutions, and change in the resource condition in Nepal. International Forestry Review. 2004; 6:136-148.
- Ghimire. Fire hazard zonation of Bardiya National Park, Nepal: A disaster preparedness approach, Nep J Environ Sci. 2014; 2:27-33.
- Giglio L, Csiszar I, Restas A, Morisette JT, Schroeder W, Morton D. Active fire detection and characterization with the advanced spaceborne thermal emission and reflection radiometer (ASTER) Remote Sensing of Environment. 2008; 112:3055-3063.
- Giglio L, Descloitres J, Justice CO, Kaufman YJ. An enhanced contextual fire detection algorithm for MODIS. Remote Sensing of Environment. 2003; 87:273-282.
- ICIMOD. Forest fire Detection and Monitoring and Monitoring System in Nepal. Brochure. International Center for Integrated Mountain Development, Kathmandu, Nepal, 2012.
- IFFN. Participatory Forest Fire Management Approach, 2006. Retrieved on the 27th of May 20
- Jaiswal RK, Mukherjee S, Raju KD, Saxena R. Forest fire risk zone mapping from satellite imagery and GIS. International Journal of Applied Earth Observation and Geo information, 2002; 4:1-10.
- KochiI Donovan GH, Champ PA, Loomis JB. The economic cost of adverse health effectsfrom wildfiresmoke exposure: a review. International Journal of Wildland Fire. 2010; 19:803-817.
- Kumar S, Joshi V, Parkash S, Krishna AP. Use of remote sensing and GIS in disaster management in Gangtok area, Sikkim, Himalaya, India. Geospatial World Magazine, IndiaLeblon B, Alexander M, Chen J, White S (2001) Monitoring fire danger of northern boreal forests with NOAA-AVHRR NDVI images. International Journal of Remote Sensing. 2009; 22:2839-2846.
- MGR. Cannel, Growing trees to sequester carbon in the UK: Answers to some questions, Forestry, 1999, 72.
- Martin et al. Understanding Forest Fire Patterns and risk in Nepal Using Remote Sensing, Geographic Information System, International Journal of wildfire. 2017; 26:276-286.
- NASA/University of Maryland, (2002) MODIS Hotspot / Active Fire Detections. Data set. MODIS Rapid Response Project, NASA/GSFIC
- NBS. Nepal Biodiversity Strategy. Kathmandu, Nepal: Ministry of Forest, 2002.
- Odum EP, Barrett GW. Fundamentals of Ecology. Fifth edition. Cengage Learning, New Delhi, 2010.
- Parajuli A, Chand DB, Rayamajhi B, Khanal R, Baral S, Malla Y et al. Spatial and temporal distribution of forest fire in Nepal, 2015.
- Prakash, R. Forest management. Dehradun, India, Goyal enterprises, 2010.
- Pyne S. Passing the Torch, why the Eons-Old Truce between Human and Fire has burst into the Age of Mega fires, and what can be done about it. American Scholar (spring), Phi Beta Kappa Society, Washington DC, 2008.
- Pyne S, Andrews PL, Laven RD. Introduction to wild land fire. New York: John Wiley and Sons, 1996.
- Rawat GS. Fire risk assessment for forest fire control management in Chilla forest range of Rajaji National Park, Uttaranchal (India). M.Sc. Geo informatics dissertation. Indian Institute of Remote Sensing, Dehradun, 2003.
- Revees MC, Zhao M, Running SW. Applying improved estimates of MODIS productivity to characterize grassland vegetation dynamics. Rangeland ecology and management. 2006; 59:1-10.
- Rodriguez I. Pemon perspectives of fire management in Canaima National Park, Venezuela. Human ecology. 2007; 35(3):331-342.
- Rodriguez I, Albert P, La Rose C, Sharpe CJ. A study of the Use of Fire by Amerindian Communities in South Rupununi, Guyana, with Recommendations for Sustainable Land Management. Study report prepared for the South Central and South Rupununi District Toshaos Councils as part of the project "Securing and Sustainably Managing Wapichan Traditional Lands in Guyana (2010-2011)". Forest Peoples Project (FPP), Moreton-in-Marsh, England, 2011.
- Salas FJ, Chuvieco E. ‗Geographic Information System for wild land fire risk mapping', Wildfire. 1994; 3(2):713.
- Santoso H. Adaptation to Recurrence Forest Fires and their Risks under the Influence of Climate Change and Climate Variability,16th Asia Pacific Seminar on Climate Change, September, Jakarta, Indonesia, 2006, 5-8.
- Schwilk DW, Keeley JE, Bond WJ. The intermediate disturbance hypothesis does not explain fire and diversity pattern in fynbos. Plant Ecology. 1997; 132:77-84.
- Sharma G. "Spatial and Temporal Distribution of Forest Fire in Terai and Churia Range". A B.Sc. Forestry thesis submitted to Tribhuvan University, Institute of Forestry, Hetauda, Nepal Sharma, S. (1996). Forest Fire Behaviour Study in Sal Dominated Natural Forest in Terai (Working Paper No.), 2015, 23.
- Shay J, Kunec D, Dyck B. Short term effects of fire frequency on vegetation composition and biomass in mixed prairie in south western Manitoba. Plant Ecology, 2001, 155:157.
- Shindler B, Toman E. Fuel reduction strategies in forest communities: A longitudinal analysis. Journal of Forestry. 2003; 101(6):8-15.
- Siebert R, Toogood M, Knierim A, Factors affecting European farmers'-participation in biodiversity policies. Sociologia Ruralis. 2006; 46(4):318-340.
- Simard AJ. Fire severity, changing scales, and how things hang together. International Journal of Wildland Fire. 1996; 1:23-34.
- Sivrikaya F, Sağlam B, Akay AE, Bozali N. Evaluation of Forest Fire risk with GIS. Polish Journal of Environmental Studies. 2014; 23(1):187-194.
- Stephens SL. Forest fire causes and extent on United States Forest Service lands. International Journal of Wild land Fire. 2005; 14:213-222. doi:10.1071/WF04006
- Sunar F, Özkan C. Forest fire analysis with remote sensing data. International Journal of Remote Sensing. 2001; 22(12):2265-2277
- Syphard AD, Radeloff VC, Keeley JE, Hawbaker TJ, Clayton MK, Stewart SI. Human influence on California fire regimes. Ecological Applications. 2007a; 17:1388-1402. doi:10.1890/ 06-1128.1
- Syphard AD, Radeloff VC, Keuler NS, Taylor RS, Hawbaker TJ, Stewart SI. Predicting spatial patterns of fire on a southern California landscape. International Journal of Wild land Fire. 2008; 17:602-613.
- Van Wilgen BW, Govender N, Biggs HC, Ntsala D. Response of savanna regimes to changing fire management policies in a large African National Park. Conservation Biology. 2004; 18:1533-1540.
- Viegas DX. Fire behavior models: an overview. In Forest Fires: Ecology and Control, edited by A. T., and V. Carraro: University Degli Studi di Padova, 2002, 3747.
- Wade D, Lundsford J. Fire as forest management too; prescribed burning in the southern states, Unasylva. 1990; 162:28-38.
- Wotton BM. Predicting forest fire occurrence in Ontario. PhD thesis, University of Toronto, 2004.
- Wotton BM, Martell DL, Logan KA. Climate Change and people caused forest fire occurrence in Ontario. Clim. Change. 2003; 60:275-29.
- WWF Nepal. Forest fire assessment in central and western Terai districts of Terai Arc Landscape (TAL), Nepal. Final Report, WWF Nepal and Department of Forest, Kathmandu, Nepal, 2003.
- Xanthopoulos G. The 1998 Forest Fire Season in Greece: A Forest Fire Expert's Account. International Forest Fire News, 1999.
Cited by 10
From OpenAlex, OpenCitations and reference lists read by Scinovex
- Forest Fire Occurrence Prediction in China Based on Machine Learning Methods ↗
Yongqi Pang, Yudong Li, Zhongke Feng, Zemin Feng, Ziyu Zhao, Shilin Chen et al. · Remote Sensing · 2022
Forest fires may have devastating consequences for the environment and for human lives. The prediction of forest fires is vital for preventing their occurrence. Currently, there are fewer studies on the prediction of forest fires over longer time scales in China. This is due to the difficulty of forecasting forest fires. There are many factors that have an impact on…
❝ 140PDF - Integrated Spatial Analysis of Forest Fire Susceptibility in the Indian Western Himalayas (IWH) Using Remote Sensing and GIS-Based Fuzzy AHP Approach ↗
Pragya, Manish Kumar, Akash Tiwari, Syed Irtiza Majid, Sourav Bhadwal, Netrananda Sahu et al. · Remote Sensing · 2023
Forest fires have significant impacts on economies, cultures, and ecologies worldwide. Developing predictive models for forest fire probability is crucial for preventing and managing these fires. Such models contribute to reducing losses and the frequency of forest fires by informing prevention efforts effectively. The objective of this study was to assess and map the forest fire susceptibility (FFS) in the…
❝ 57PDF - Forest fire occurrence, distribution and risk mapping using geoinformation technology: A case study in the sub-tropical forest of the Meghalaya, India ↗
Tapan Dhar, Basudeb Bhatta, Sengalvarayan Aravindan · Remote Sensing Applications Society and Environment · 2022
❝ 27PDF - Forest Fire Detection using Deep Learning Techniques ↗
Ishaan Dawar, Soumyo Deep Gupta, Rashika Singh, Yash Kothari, Shirshendu Layek · 2023
Forest fires pose a serious threat to both people and the environment. Half of the world's forests are predicted to be destroyed by forest fires by 2030. They are a reason of serious concern since both natural and man-made disasters endanger land, plants, and human as well as animal life which exist in those habitats. To prevent substantial disasters, a…
❝ 12 - Unravelling the Local Dynamics of Increasing Fires in Community Forests of Mid-hills of Nepal ↗
Sarada Tiwari, Naya Sharma Paudel, Jocelyne Shimin Sze, Rahul Karki · Journal of Forest and Livelihood · 2022
Forest fire is a global phenomenon and is having unprecedented impacts across continents. Nepal is not an exception to the increasing impacts, where hundreds of acres of forests is lost, or damaged, to forest fire. The severity of forest fire is on the rise in recent decades, wherein community forests have witnessed effects of the calamity over the recent years.…
❝ 8PDF - Optimizing Forest Fire Prediction: A Comparative Analysis of Machine Learning Models through Feature Selection and Time-Stage Evaluation ↗
Hamed Khosravi, Mohammad Reza Shafie, Ahmed Shoyeb Raihan, Md Asif Bin Syed, Imtiaz Ahmed · Preprints.org · 2023
Despite being considered as natural components of many ecosystems, forest fires pose significant threats to the environment and human health. In order to ensure public safety and effective fire suppression planning, it is necessary to develop reliable prediction models to mitigate forest fire danger. These models should account for specific environmental conditions. The advent of big data in recent years…
❝ 5PDF - Research on Multi-Factor Forest Fire Prediction Model Using Machine Learning Method in China ↗
Yudong Li, Zhongke Feng, Ziyu Zhao, Shilin Chen, Hanyue Zhang · Research Square · 2020
❝ 5PDF - Rapid assessment of insect diversity (Ext.), Kalabakan, Sabah ↗
RAZY JAPIR, B Momin, L Y John, Arthur Y. C. Chung · IOP Conference Series Earth and Environmental Science · 2022
Abstract The Sungai Tiagau Forest Reserve is a Class 1 Protection Forest Reserve under jurisdiction of Serudong District Forestry Office of Sabah Forestry Department. This reserve is located in south eastern Sabah, covering an area of 7,010 ha. This study was aimed to document the insect fauna of Sg. Tiagau Forest Reserve (Ext.), as well as to investigate the threats…
❝ 2PDF - Chinese forest fire occurrence prediction based on machine learning methods ↗
Yudong Li, Zhongke Feng, Ziyu Zhao, Wenyuan Ma, Shilin Chen, Hanyue Zhang · Research Square · 2021
❝ 1PDF - Modeling fires based on the results of correlation analysis ↗
Olga Butenko, Anna Topchiy · Ukrainian journal of remote sensing · 2023
In order to monitor and study in more detail the causes and probability of the occurrence and spread of fires in the east of Ukraine in the combat zone, mathematical modeling of the factors influencing the occurrence of fires based on linear regression was performed in this study. The initial assessment of a priori information presented in a discrete form…
❝ 0PDF