
Research article · 2017 · Full text
International Journal of Statistics and Applied MathematicsApplication of chemometrics approaches to determine the virgin sesame oil adulterants using FTIR spectral data
Volume 2(5) · Pages 110–115
Research areasSpectroscopy and Chemometric AnalysesEdible Oils Quality and AnalysisEssential Oils and Antimicrobial Activity
Abstract
Author-writtenA methodology based on Fourier transform infrared spectroscopy with attenuated total reflectance sampling technique, combined with multivariate analysis, was developed to monitor the adulteration of extra virgin sesame oil with groundnut oil and palm oil. Principal components regression (PCR), Hierarchical Cluster Analysis, (HCA) and discriminant analysis (LDA) are used to quantify the percentage of adulteration based on spectral data, using different proportion of the samples. The wave numbers associated with the biochemical differences among several types of edible oils have been investigated using chemometric tools.
Summary
Source-checkedPlain-language reading of the full paper, prepared with AI and checked against the text. Each point links to the authors' own words.
Why it matters
- Adulterating expensive edible oils with cheaper, degraded, or toxic alternatives creates significant public health risks and economic impacts. View evidence ↗
- Fourier transform infrared (FTIR) spectroscopy combined with chemometrics and attenuated total reflectance (ATR) is an effective analytical tool because it requires very little sample preparation. View evidence ↗
- FTIR is viewed as a 'fingerprint technique' because every oil has a unique spectrum based on its peak intensities and number. View evidence ↗
The question
- The study aimed to develop a method using FTIR spectroscopy and chemometric techniques (PCR, HCR, and DA) to quantify and predict the level of palm oil and groundnut oil adulteration in virgin sesame oil. View evidence ↗
What they did
- The researchers tested virgin sesame oil adulterated with palm oil and groundnut oil at volume proportions ranging from 5% to 15%. View evidence ↗
- Spectra were collected in absorbance mode from 500 to 4,000 cm⁻¹ using 5 μL drops of oil on an ATR baseplate maintained at 30°C. View evidence ↗
- Each measurement took approximately 2 minutes, using 128 interferograms at 4 cm resolution, and was averaged over three repetitions. View evidence ↗
What they found
- The Kaiser-Meyer-Olkin (KMO) measure was 0.842 and Bartlett's value was 1828 (p=0.000), indicating the data was suitable for factor analysis. View evidence ↗
- Principal component analysis showed that the first two factors explained 99.986% of the total variance, with the first accounting for 64.32% and the second for 35.66%. View evidence ↗
- Factor 1 grouped virgin sesame oil with palm oil adulterants at 5%, 10%, and 15% levels, all showing a loading value of 0.919. View evidence ↗
- Factor 2 grouped groundnut oil adulterants, with 10% and 15% levels showing loading values of 0.894 and the 5% level showing 0.397. View evidence ↗
- The results indicate that groundnut oil adulteration is easily identified, while palm oil adulteration (specifically at the 10% level) is harder to detect using spectral data. View evidence ↗
- Discriminant analysis found that only the first function was significant (p=0.000, Wilk’s λ=0.820), explaining 100% of the variance of the adulterant oil. View evidence ↗
- The model correctly classified 47.5% of the original grouped cases and 27.5% of the cross-validated cases. View evidence ↗
What it means
- The authors conclude that combining FTIR spectroscopy with PCR, HCA, and DA techniques is a suitable and practical approach for predicting the adulteration of sesame oil with palm and groundnut oils. View evidence ↗
- The authors suggest that future research should focus on reducing the number of wave numbers required to effectively discriminate between edible oils. View evidence ↗
Visual summary
1 visualsIllustrations explain the paper; they do not show study data.
Factor Grouping of Adulterants
AI-generated conceptual illustration (Virgin sesame oil, palm oil, and groundnut oil). It explains the idea and does not show study data.
View source evidence ↗Figures & tables
From the original paper Table 1
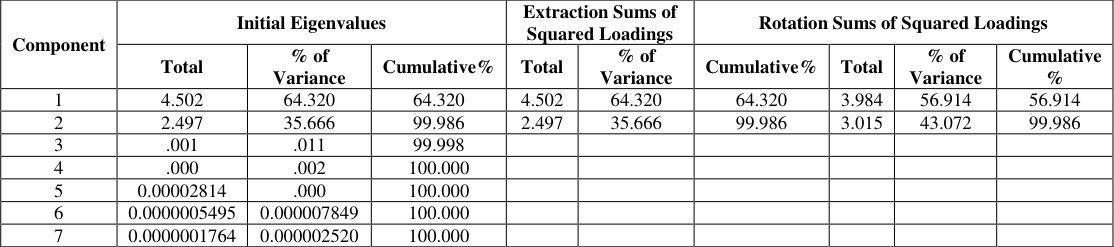 Table 2
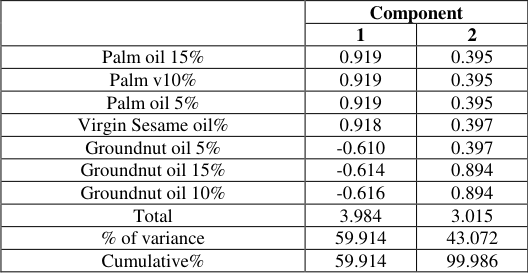 Table 3
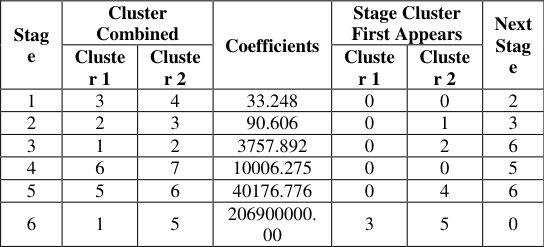 Table 4
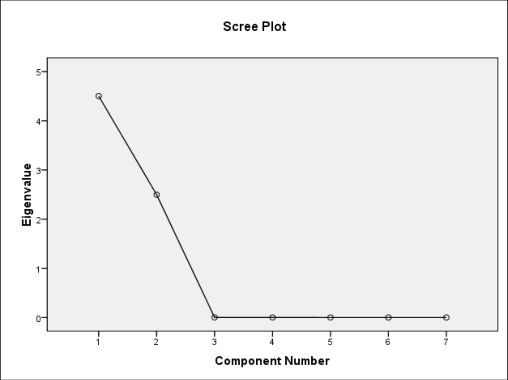 Figure 1
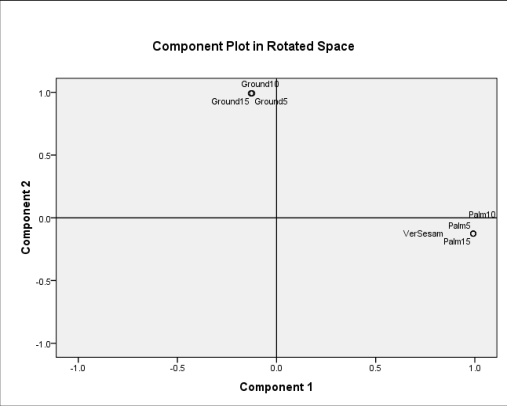 Figure 2
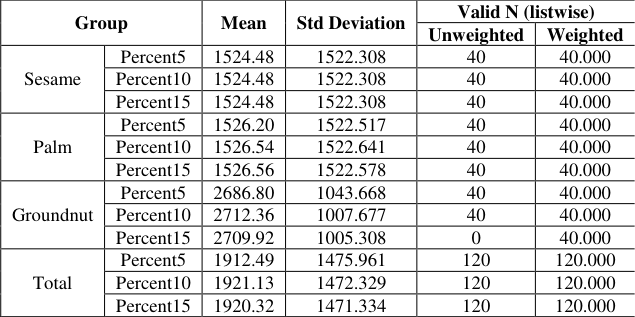 Table 5
 Table 6
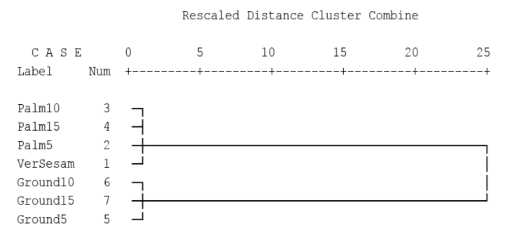 Figure 4
 Table 7
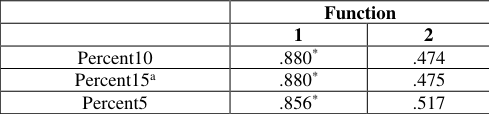 Table 8
 Table 9
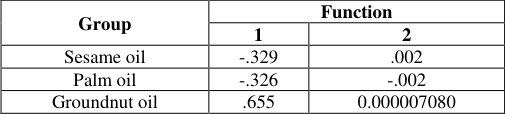 Table 10
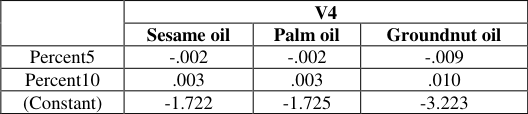 Table 11
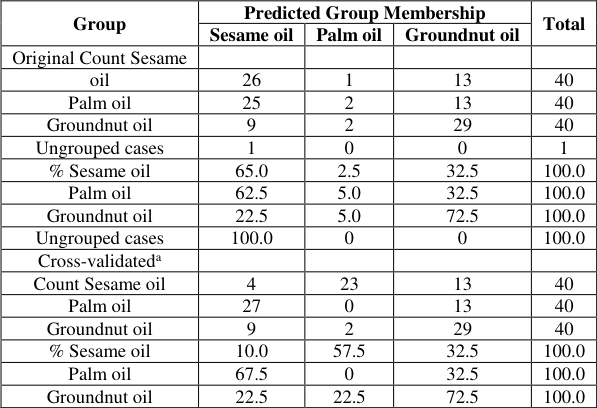 Table 12
Introduction
The detection of adulteration of food products is important for consumers, industries, and retailers. Analysis of the quality and purity of the oils in general, and in edible oils, in particular, is of great relevance and has been the subject of research of several authors (Ben-Ayed et al., 2013) [2] . Adulteration of pure expensive edible oils either with low-priced oils, with degraded used oils or with toxic mineral oils can have great economic and social impact, and is a serious public health problem (Johnson, 2014) [4] . Adulteration results in the integration of harmful substances in foodstuff supplied to unwary consumers. Quite a few techniques have been applied for the quantification of adulteration of virgin sesame oil, for example, Fourier transform infrared (FTIR) spectroscopy, real-time mass spectrometry, gas chromatography, and high-performance liquid chromatography (Kataoka et al., 2000) [5] . Optical techniques, such as Raman, fluorescence, and absorption spectroscopy, are relentless, non-destructive analytical techniques having an increasing number of applications in the study of foodstuff. FTIR combined with chemometric methods is a powerful analytical approach. It does require minimal sample preparation, particularly when used in conjunction with attenuated total reflectance (ATR) (Vlachos et al., 2006) [9] . It has been recognized as a fast analytical technique to detect and quantify the presence of adulterants because it provides important information about the presence of certain functional groups. It is also considered as a "fingerprint technique," meaning that there are no two oils with the same FTIR spectra either in the number of peaks or in the maximum peak intensities. FTIR spectroscopy allows researchers to differentiate between authentic and adulterated oils by observing the FTIR spectra changes due to the adulteration (Rohman, 2012) [10] . The principal component regression (PCR) and the Discrimantanalysis techniques are wellknown statistical methods, often used in quantitative prediction methodologies based on spectroscopic data (Martens and Naes, 1989) [6] . Both techniques have large acceptance in a wide range of scientific fields. The main reason is that they have been designed to meet the situation where there are many, possibly correlated, predictor variables and few samples: this scenario is common, especially in food science where developments in spectroscopy since the seventies have revolutionized chemical analysis. They are based on reduction of data dimensionality and inverse calibration, in systems where there is a possibility to calibrate for the desired component, while implicitly modeling the other sources of variation (Miller and Miller, 2005) [7] . The spectral regions at whole frequency regions and at selected fingerprint regions were chosen for optimization, calibration and validation models. In the present study, FTIR spectroscopy combined with PCR, HCR and DA techniques was used to develop methodologies for the quantitative analyses of mixtures of sesame oil with groundnut oil and palm oil in order to predict the adulteration level of virgin sesame oil. This will also facilitate the determination of frequency regions useful to differentiate virgin sesame from other edible oils.
Materials and Methods
Materials and Methods
Sample preparation
Virgin Sesame Oil (VSO) and selected vegetable oils, namely Palm Oil (PO) and Groundnut oil (GO) were purchased from the local market. In this study, we used Virgin Sesame Oil (VGO) adulterated samples mixed with palm oil and groundnut oil in accurately weighted proportions in the range of 5-15% (v/v). These mixtures were manually shaken to ensure total homogenization.
FTIR measurement
Infrared spectra were collected in a "Unicam Research Series" FTIR spectrometer equipped with a single-reflection "Golden Gate" diamond ATR module, a deuterated Lalanine doped triglycene sul-fatedetector, and a KBr beamsplitter. The equipment was connected to a computer and was controlled by WinFirst 1.1 software (Madison, USA). FTIR measurements were obtained by pipetting a small drop (~5 μL) of edible oil on top of the ATR baseplate, which was kept at 30°C. All infrared spectra, recorded in absorbance mode, were collected in the region of 500-4,000 cm -1 , co-adding 128 interferograms at a resolution of 4 cm, the collection time being approximately 2 min. Each measurement was repeated three times and the average was obtained. For qualitative analysis, principal components contributing to the variance of the data set were subjected to hierarchical cluster analysis (HCA) linear discriminant analysis (LDA) in an attempt to predict the likelihood of a sample belonging to a previously defined group. Chemometrics analyses, including quantification using PCR calibrations, hierarchical cluster analysis and discriminant analyses was performed using the SPSS.17.0.
Results and Discussion
Results and Discussion
Principal component analysis
The following table provides the KMO index for the virgin sesame oil with adulterants of palm oil and groundnut oil. The KMO measure indicates the marvelous level of sesame oil adulterant (0.842) and Barlett's value of 1828 with a significance of 0.000. Hence, the factor analysis was carried out further to differentiate against adulterants (Table.1). 0.000 Principal component analysis using the functional groups was performed on the FTIR spectral data of the samples. To display the points in two principal components, PC 1 and PC 2 (first and second principal components) were chosen to represent the information. For each principal component (PC), every sample has a score and every variable has a loading that represents its contribution to the combination. The first factor (component) accounts for 64.32% of the total variance and the second factor accounts for 35.66% of the variance. Hence, the total variance explained by these two factors accounts for 99.986%. So only a meager 0.014% of variance was not explained with the remaining components.
In order to confirm the initial factors extracted in the principal component analysis, a rotation was carried out using VARIMAX rotation. After the initial factor extraction, the varimax rotation was carried out and the results show that even in this face, only two component models were exhibited with an eigenvalue of 3.984 and 3.015 with the percentage of variance of 56.91% for the first component and 43.07% for the second component. Hence, the total variance explained by these two component accounts for 99.98%.
It can also be seen clearly by means of the following scree plot (Fig. 1) that there is a clear identification of only two components. It is a common practice to use the scree plot and loadings for the first two PCs. Fig. 1 shows the principal component scree plot of the PC1 and PC2 of two adulterant samples. The results of the present study, shows that only the first two components have eigenvalues greater than 1 and that there is a big drop in eigenvalue between component 2 and component 3. After identifying the number of factors, the variables included in each factor are distinguished by means of their factor loadings. The factor loadings are considered to be the best method associated with a specific factor for a specific state which is simply the correlation between the factor and the standardized scores. The following table shows the factor loading on the 7 variables (Table .3). In the present study, the samples of virgin sesame oil adulterated with palm oil 15% (with a loading value 0.919), palm oil 10% (with a loading value 0.919) and palm oil 5% (with a loading value 0.919 and the virgin sesame oil are associated and form into factor 1. In the second component, adulterants of sesame oil with groundnut oil 15% (with a loading value 0.894), groundnut oil 10% (with a loading value 0.894 and groundnut oil 5% (with a loading value 0.397) are grouped into factor 2 (Table .3). This clearly indicates that in the case of sesame oil, the FTIR spectral data of the palm adulterant did not show any significant difference, whereas, the groundnut oil adulterants of 5%, 10% and 15% with the sesame oil did not come closer to the earlier factor. The factor matrix pattern also reflects the reasonable clear loading structure which is given in Fig. 2. Two factor exhibit the combination of virgin sesame oil and palm oil of different percentage as an isolated factor.
Hierarchical Cluster Analysis
The agglomeration schedule table shows the change in the coefficient which deals with the cases which are closer and forming into different clusters. The column labeled "coefficients" has the values of the distance statistic which were used to identify the distance and classify it into a cluster and the number of clusters formed at different stages can be seen in the above table. Table .4 comprises six clusters. The agglomeration schedule shows the oil samples 3 and 4 which are combined to form the first cluster with minimum coefficient value of 33.24. At stage 2, the second cluster is formed with the oil sample numbers 2 and 3 with a coefficient value of 90.606. At stage 3, the oil samples 1 and 2 are formed in the third cluster with a coefficient value of 3757.892. At stage 4, the oil samples 6 and 7 are formed into the fourth cluster with a coefficient value of 10006.275. At stage 5, the oil samples 5 and 6 are formed into the fifth cluster with a coefficient value of 40176.776. In the last stage, the oil samples 1 and 5 are joined into a sixth cluster with a coefficient value of 206900000. The above results can be represented graphically in the form of a dendrogram, where two clusters can be identified. Since the distance is very close, only two major visible clusters are formed which were termed as cluster A and cluster B. The hierarchical cluster analysis, at the distance of oils can be grouped as follows:
Cluster A comprises of palm oil 10%, palm oil 15%, palm oil 5% and the virgin sesame oil.
Cluster B comprises of the groundnut oil 10%, groundnut oil 15% and groundnut oil 5%. The dendrogram shows that the samples of palm oil 15% clustered with palm oil 10% forms into a homogenous cluster.
Dendrogram using Single Linkage
At the second cluster level, the virgin sesame oil is clustered with palm oil 5% and the other clusters are with the longer distances (Fig. 4). The dendrogram shows that the virgin sesame oil is quite homogeneous. From the above results it is clear that the groundnut oil as an adulterant with the sesame oil can easily be identified, whereas palm oil of 10% level with the groundnut oil cannot be easily identified. Detection of such natural groupings suggests that discrimination between at least some of them may be possible. The length of the branch shows how far apart each case is from the other cases in its cluster. Cases with low distance are close together. Hence, the blending of palm oil with sesame oil as adulterant is hard to find with the help of spectral data.
Discriminant analysis
The edible oil variable is independent of the study that comprises of two factors, namely virgin sesame oil, and adulterants namely palm oil and groundnut oil. From this output, we can see that some of the means of virgin sesame oil, palm oil and groundnut oil differ noticeably from group to group. While one attribute of edible oil construct representing the virgin sesame oil, the adulterants contain three attributes as follows: The palm oil consists three attributes, namely palm oil 5%, palm oil 10% and palm oil 15% in proportion and the groundnut oil consists of three attributes namely groundnut oil 5%, groundnut oil10% and groundnut oil 15% in proportion. The dependent variable for the present study is the adulterant which consists of three categories 1) 5% 2) 10% and 3) 15% in proportions.
In order to determine whether the edible oils are capable for subsequent analysis, the Cronbach coefficient alpha test was conducted and it was found that edible oil adulteration coefficient alpha value is 0.835, and in fact, it is exceeding the recommended level of 0.70 observed by Nunally (1978). Therefore, the items selected for edible oil adulteration are considered as reliable for subsequent analysis. The research findings based on the Multiple Discriminant analysis on edible oil are discussed below. Table .5 displays the means for three differences categories of edible oil, each with regard to three attributes. An examination of Table .5 shows the existence of several significant mean differences across the oil adulterants.
Multiple discriminant analysis was used to explore the degree to which FTIR spectra of oils can match with the functional groups. Only the first discriminant function (Wilk's λ=0.820; x 2 =23.153; DF=4, p=0.000) was significant and explains 100% of the variance of the adulterant oil. The result of the second function is given as Wilk's λ=1.000; x 2 =0.000; DF=1, p=0.987 (Table .6). Since the second function is not significant, its associated statistics will not be used in the interpretation of the ability of the seven constructs to discriminate among three categories of edible oil. [3] warn that a discussion of the standardized coefficient may lead to misinterpretations. [3] provide a rough estimate by suggesting an improvement of at least 25% on that which could be achieved by chance. Thus, research findings have obtained classification accuracy of greater than 25% achieved by chance and has cross-validated the above discriminating results.
Conclusion
In the present study, the application of chemometrics combined with FT-IR spectroscopy proved to be in the prediction of the adulteration of the same oil with groundnut oil and palm oil. The results of the present study are an outcome of the mid-infrared analysis with different edible oils. PCR, HCA and DA techniques were found suitable for practical applications. The validation and evaluation of the predictability of the models was attained by the analysis of a set of external samples. This study opens the perspective of future research with the goal to further decrease the number of wave numbers necessary to discriminate edible oils.
Figures and tables from the paper
| Kaiser-Meyer-Olkin Measure of Sampling Adequacy | 0.842 |
|---|---|
| Bartlett's Test of Sphericity Approx. Chi-Square | 1828.00 |
| df | 21 |
| Sig. | 0.000 |
Table text extracted from the original PDF; superscript letters are shown inline. The original table image is below.
View original table image
| Component | Initial Eigenvalues | — | — | Extraction Sums of Squared Loadings | — | Rotation Sums of Squared Loadings | — | — | — |
|---|---|---|---|---|---|---|---|---|---|
| Total | % of Variance | Cumulative% | Total | % of Variance | Cumulative% | Total | % of Variance | Cumulative % | |
| 1 | 4.502 | 64.320 | 64.320 | 4.502 | 64.320 | 64.320 | 3.984 | 56.914 | 56.914 |
| 2 | 2.497 | 35.666 | 99.986 | 2.497 | 35.666 | 99.986 | 3.015 | 43.072 | 99.986 |
| 3 | .001 | .011 | 99.998 | ||||||
| 4 | .000 | .002 | 100.000 | ||||||
| 5 | 0.00002814 | .000 | 100.000 | ||||||
| 6 | 0.0000005495 | 0.000007849 | 100.000 | ||||||
| 7 | 0.0000001764 | 0.000002520 | 100.000 |
Table text extracted from the original PDF; superscript letters are shown inline. The original table image is below.
View original table image
| — | Component | — |
|---|---|---|
| 1 | 2 | |
| Palm oil 15% | 0.919 | 0.395 |
| Palm v10% | 0.919 | 0.395 |
| Palm oil 5% | 0.919 | 0.395 |
| Virgin Sesame oil% | 0.918 | 0.397 |
| Groundnut oil 5% | -0.610 | 0.397 |
| Groundnut oil 15% | -0.614 | 0.894 |
| Groundnut oil 10% | -0.616 | 0.894 |
| Total | 3.984 | 3.015 |
| % of variance | 59.914 | 43.072 |
| Cumulative% | 59.914 | 99.986 |
Table text extracted from the original PDF; superscript letters are shown inline. The original table image is below.
View original table image
| Stag e | Cluster Combined | — | Coefficients | Stage Cluster First Appears | — | Next Stag e |
|---|---|---|---|---|---|---|
| Cluste r 1 | Cluste r 2 | Cluste r 1 | Cluste r 2 | |||
| 1 | 3 | 4 | 33.248 | 0 | 0 | 2 |
| 2 | 2 | 3 | 90.606 | 0 | 1 | 3 |
| 3 | 1 | 2 | 3757.892 | 0 | 2 | 6 |
| 4 | 6 | 7 | 10006.275 | 0 | 0 | 5 |
| 5 | 5 | 6 | 40176.776 | 0 | 4 | 6 |
| 6 | 1 | 5 | 206900000. 00 | 3 | 5 | 0 |
Table text extracted from the original PDF; superscript letters are shown inline. The original table image is below.
View original table image
| Group | — | Mean | Std Deviation | Valid N (listwise) | — |
|---|---|---|---|---|---|
| Unweighted | Weighted | ||||
| Sesame | Percent5 | 1524.48 | 1522.308 | 40 | 40.000 |
| Percent10 | 1524.48 | 1522.308 | 40 | 40.000 | |
| Percent15 | 1524.48 | 1522.308 | 40 | 40.000 | |
| Palm | Percent5 | 1526.20 | 1522.517 | 40 | 40.000 |
| Percent10 | 1526.54 | 1522.641 | 40 | 40.000 | |
| Percent15 | 1526.56 | 1522.578 | 40 | 40.000 | |
| Groundnut | Percent5 | 2686.80 | 1043.668 | 40 | 40.000 |
| Percent10 | 2712.36 | 1007.677 | 40 | 40.000 | |
| Percent15 | 2709.92 | 1005.308 | 0 | 40.000 | |
| Total | Percent5 | 1912.49 | 1475.961 | 120 | 120.000 |
| Percent10 | 1921.13 | 1472.329 | 120 | 120.000 | |
| Percent15 | 1920.32 | 1471.334 | 120 | 120.000 |
Table text extracted from the original PDF; superscript letters are shown inline. The original table image is below.
View original table image
| Function | Eigen value | % of Variance | Cumulative% | Canonical Correlation | Wilks' Lambda | Chi-square | df | Sig. |
|---|---|---|---|---|---|---|---|---|
| 1 | .220a | 100.0 | 100.0 | .425 | .820 | 23.153 | 4 | .000 |
| 2 | .000a | .0 | 100.0 | .002 | 1.000 | .000 | 1 | .987 |
Table text extracted from the original PDF; superscript letters are shown inline. The original table image is below.
View original table image
| — | Function | — |
|---|---|---|
| 1 | 2 | |
| Percent5 | -9.640 | 17.901 |
| Percent10 | 10.509 | -17.405 |
Table text extracted from the original PDF; superscript letters are shown inline. The original table image is below.
View original table image
| — | Function | — |
|---|---|---|
| 1 | 2 | |
| Percent10 | .880* | .474 |
| Percent15a | .880* | .475 |
| Percent5 | .856* | .517 |
Table text extracted from the original PDF; superscript letters are shown inline. The original table image is below.
View original table image
| — | Wilks' Lambda | F | Sig. |
|---|---|---|---|
| Percent5 | .861 | 9.426 | .000 |
| Percent10 | .854 | 9.970 | .000 |
| Percent15 | .855 | 9.938 | .000 |
Table text extracted from the original PDF; superscript letters are shown inline. The original table image is below.
View original table image
| Group | Function | — |
|---|---|---|
| 1 | 2 | |
| Sesame oil | -.329 | .002 |
| Palm oil | -.326 | -.002 |
| Groundnut oil | .655 | 0.000007080 |
Table text extracted from the original PDF; superscript letters are shown inline. The original table image is below.
View original table image
| — | V4 | — | — |
|---|---|---|---|
| Sesame oil | Palm oil | Groundnut oil | |
| Percent5 | -.002 | -.002 | -.009 |
| Percent10 | .003 | .003 | .010 |
| (Constant) | -1.722 | -1.725 | -3.223 |
Table text extracted from the original PDF; superscript letters are shown inline. The original table image is below.
View original table image
| Group | Predicted Group Membership | — | — | Total |
|---|---|---|---|---|
| Sesame oil | Palm oil | Groundnut oil | ||
| Original Count Sesame | ||||
| oil | 26 | 1 | 13 | 40 |
| Palm oil | 25 | 2 | 13 | 40 |
| Groundnut oil | 9 | 2 | 29 | 40 |
| Ungrouped cases | 1 | 0 | 0 | 1 |
| % Sesame oil | 65.0 | 2.5 | 32.5 | 100.0 |
| Palm oil | 62.5 | 5.0 | 32.5 | 100.0 |
| Groundnut oil | 22.5 | 5.0 | 72.5 | 100.0 |
| Ungrouped cases | 100.0 | 0 | 0 | 100.0 |
| Cross-validateda | ||||
| Count Sesame oil | 4 | 23 | 13 | 40 |
| Palm oil | 27 | 0 | 13 | 40 |
| Groundnut oil | 9 | 2 | 29 | 40 |
| % Sesame oil | 10.0 | 57.5 | 32.5 | 100.0 |
| Palm oil | 67.5 | 0 | 32.5 | 100.0 |
| Groundnut oil | 22.5 | 22.5 | 72.5 | 100.0 |
Table text extracted from the original PDF; superscript letters are shown inline. The original table image is below.
View original table image
References
10 in the original paper- Baeten V, Fernández Pierna J, Dardenne P, Meurens M, García-González D, Aparicio-Ruiz R. Detection of the presence of hazelnut oil in olive oil by FT-Raman and FT-MIR spectroscopy. Journal of Agricultural and Food Chemistry. 2005; 53:6201-6206
- Ben-Ayed R, Kamoun-Grati N, Rebai A. An overview of the authentication of olive tree and oil. Comprehensive Reviews in Food Science and Food Safety. 2013; 12:218227
- Hair J, Anderso RE, Tatham RL, Black WC. Multivariate Data Analysis, Fifth ed., Prentice Hall, New Jersey, 1998.
- Johnson R. Food fraud and "Economically Motivated Adulteration of food and food ingredients. In Congresse TLo (Ed.), Washington, DC: Library of Congress, 2014; 7-5700, R43358, 1-40.
- Kataoka H, Lord HL, Pawliszyn J. Applications of solidphase microextraction in food analysis. Journal of Chromatography. 2000; A,880:35-62.
- Martens H, Naes T. Multivariate calibration. Chichester: Wiley, 1989.
- Miller JN, Miller JC. Statistics and chemometrics for analytical chemistry. Edinburgh: Pearson Education, 2005.
- Nunnally JC. Psychometric theory (2 nd ed.). New York: McGraw-Hill, 1978.
- Vlachos N, Skopelitis Y, Psaroudaki M, Konstantinidou V, Chatzilazarou A, Tegou E. Applications of Fourier transform-infrared spectroscopy to edible oils. Analytica Chimica Acta. 2006; 573-574:459-465
- Rohman A, Man YBC. Application of Fourier transform infrared spectroscopy for authentication of functional food oils. Applied Spectroscopy Reviews. 2012; 47(1):113.