
Research article · 2019 · Full text
International Journal of Statistics and Applied MathematicsUsing logistic regression models to determine factors affecting diabetes in the red sea state
Volume 4(4) · Pages 12–17
Research areasArtificial Intelligence in HealthcareHIV/AIDS Impact and Responses
Abstract
Author-writtenDiabetes is a disease influenced by some factors related to individual's behavior and the surrounding environment. This study aimed to identify the factors influencing diabetes infection in the Red Sea State for the period (2015-2018). The study depended on data collected from a diabetes treatment center in Port Sudan city eastern of Sudan. The sample size was (202). Data were analyzed using chi-square test, simple Binary logistic regression, and multiple logistic regression. Chi-square test results showed that there was a relationship between diabetes infection and the predictor variables gender, sex, family history, and kinship. Application of the binary logistic regression revealed that there was a significant association between the predictor variables: sex, age, and diabetes infection. However, educational level, income, and blood sugar were found to be statistically insignificant. The study recommended increasing the number of diabetes screening and treatment centers in all cities in the Red Sea State and developing existing centers.
Summary
Source-checkedPlain-language reading of the full paper, prepared with AI and checked against the text. Each point links to the authors' own words.
Why it matters
- Diabetes is a severe chronic condition caused by the pancreas producing insufficient insulin or the body's inability to use insulin effectively. View evidence ↗
- The incidence of diabetes in Sudan has been rising, increasing from 9% in 2010 to 10.6% in 2013. View evidence ↗
- Many of Sudan's 253 government hospitals and smaller health units are poorly prepared, making it difficult to manage medical cases like diabetes. View evidence ↗
The question
- The research aimed to identify the factors that influenced diabetes infection in the Red Sea State between 2015 and 2018. View evidence ↗
What they did
- The independent variables analyzed in the study included sex, age, educational level, income, kinship, and blood sugar. View evidence ↗
- The researchers analyzed the data using chi-square tests, simple binary logistic regression, and multiple logistic regression. View evidence ↗
What they found
- Chi-square tests showed a significant association between diabetes infection and gender, age, family history, and kinship. View evidence ↗
- Education, income, and blood sugar were found to be statistically insignificant predictors of diabetes infection in the chi-square analysis. View evidence ↗
- Binary logistic regression indicated that males were more likely to be infected with diabetes than females, with an odds ratio of 0.273. View evidence ↗
- Age was a significant factor, with individuals in the 51-60 age group being 1.662 times more likely to have diabetes than other age groups. View evidence ↗
- Kinship was significantly associated with diabetes; specifically, individuals with diabetic parents were 3.031 times more likely to be infected than those with other diabetic relatives. View evidence ↗
- The Nagelkerke square was 0.564, meaning the predictor variables explained 56.4% of the variance in diabetes occurrence among the patients. View evidence ↗
- The binary logistic regression model correctly predicted the diabetes status of 81.7% of the sample members. View evidence ↗
What it means
- The authors concluded that age, gender, and kinship are the primary factors affecting diabetes in the Red Sea State, while education, income, and blood sugar are not related. View evidence ↗
- The study recommends expanding and developing diabetes screening and treatment centers across all cities in the Red Sea State. View evidence ↗
Visual summary
3 visualsIllustrations explain the paper; charts are replotted from the paper's own table values.
Significant Risk Factors for Diabetes
AI-generated conceptual illustration (Human adults of diverse ages and genders). It explains the idea and does not show study data.
View source evidence ↗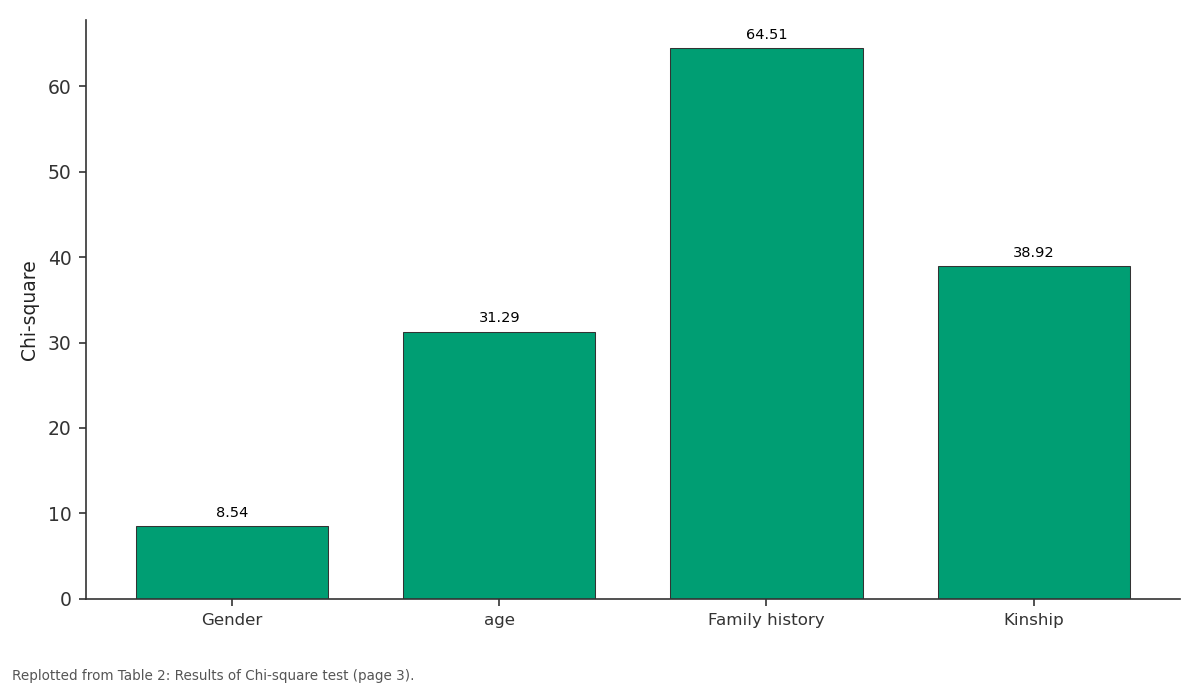
Chi-square: Gender vs age vs Family history vs Kinship
Replotted from Table 2 (page 3) of the original paper. Every bar is the paper's own table value.
View source evidence ↗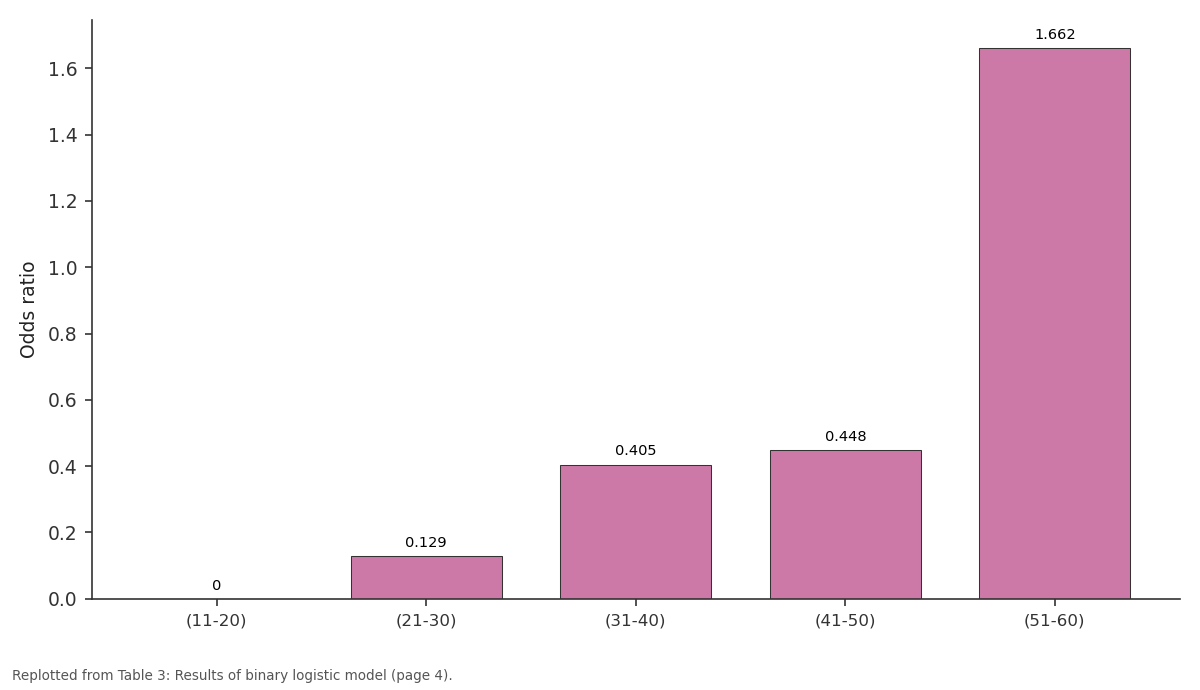
Odds ratio: (11-20) vs (21-30) vs (31-40) vs (41-50) vs (51-60)
Replotted from Table 3 (page 4) of the original paper. Every bar is the paper's own table value.
View source evidence ↗Figures & tables
From the original paper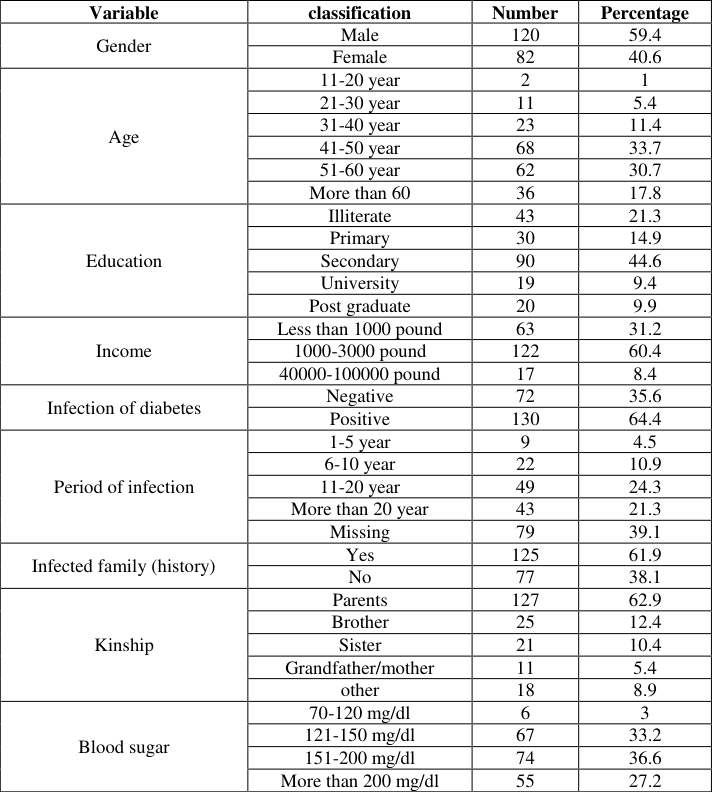 Table 1
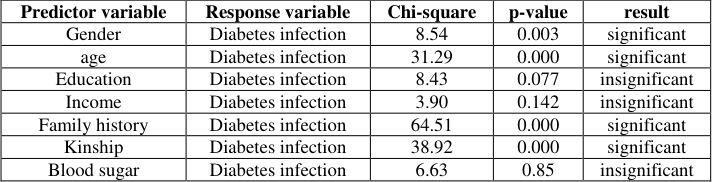 Table 2
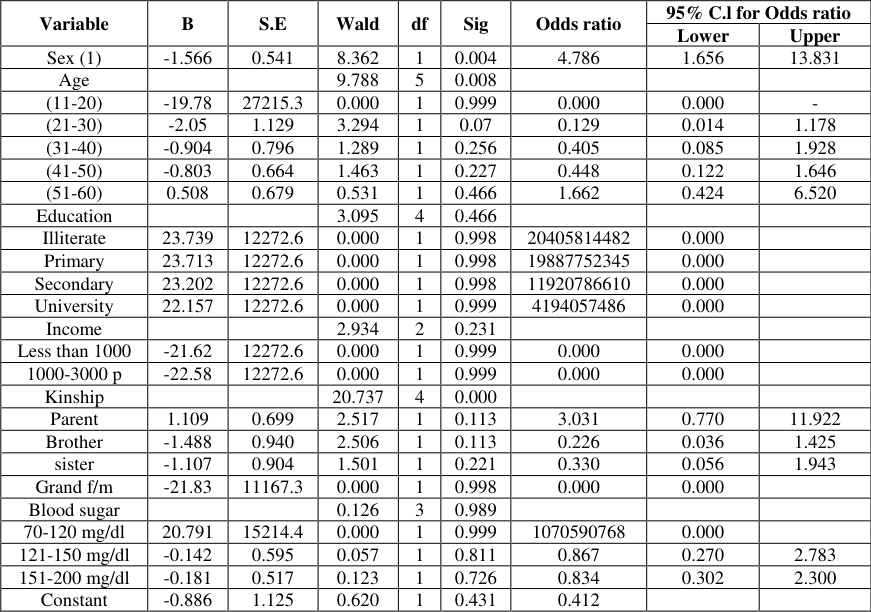 Table 3
 Table 4
 Table 5
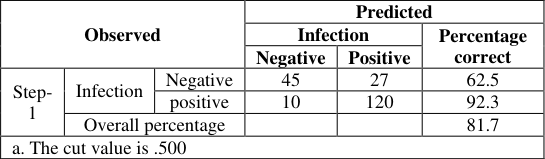 Table 7
 Table 6
Introduction
Sudan is the one of largest countries in Africa. It is located in the North -east of the African continent and shares borders with nine countries. Its population, which is multi-ethnic, is 40 million with an annual growth of 1.7% in rural areas and 4% in urban areas. Sudan is comprised of 18 states, and there are 253 government hospitals and many smaller health units most of which are poorly prepared (MOH, 2001) [15] . This situation makes it difficult for these hospitals and health units to cope with various medical cases including diabetes. Diabetes is a sever chronic disease occurring either when the pancreas generates little amount of insulin or when the body cannot adequately benefit from the insulin it makes. The incidence of diabetes has been steadily increasing over the past few decades. Globally, 422 million adults were infected with diabetes in 2014 in comparison to 108 million in 1980 (WHO, 2016) [22] . It was reported that 282 million were diabetic worldwide and 80% were living in low and middle-income countries (Guariguata, 2014) [12] . In 2014, the global pervasiveness of diabetes was estimated to be 9% among adults aged above 18. In 2012, 1.5 million death cases resulted from diabetes worldwide whereas it is not only ranked the 8 th major cause of death among both sexes but it is also regarded the 5 th leading cause of death among women (Gadsby, 2002) [11] . According to Sudan Centre of Bureau of Statistics (CBS, 2010) [8] , the incidence of diabetes in Sudan increased from 9% in 2010 to 10.6% in 2013. Diabetes was formerly regarded a rare disease in Sudan, but this scene has changed dramatically in the previous 40 years when the tendency in infection have started to rise. As in many other low-and middle-income countries (LMICs), diabetes popularity is estimated to be 8%, but could it be even higher in some northern states of the country, reaching figures of about 19% (Elmadhoun, 2016) [10] . Diabetes type 1 was reported to infect (83.8%) of Sudanese people whereas type 2 infections are (85%) of the total diabetes conditions (Noor, (2017) [18] . Diabetes increased incidence in Sudan is in line with the emerging global pandemics of metabolic syndrome and obesity (Popkin, 2012) [19] . In Sudan, the prevalence of fatty liver is thought to be around 20% in individuals without diabetes and risk factors were related to obesity and an increase in age. However, among individuals with type 2 diabetes the prevalence was around 50.3%.
The risk factors were overweight, obesity, central obesity, high triglyceride level and low HDL-c level. (Almobarak, 2015) [3] .
Objective of the Study
The study aimed to identify the factors affecting diabetes infection in the Red Sea State for the period (2015-2018).
Method of data analysis 3.1 Source of data
The study conducted in the Red Sea State in eastern of Sudan based on data from diabetes center in Port Sudan, mainly in Salalab District. The data was collected from the patients who visited the center depending on cross-section data for the years (15-18). The sample size was (202) members who entered the diabetes center for checking or diagnosis.
Dependent variable
The response variable of our study is diabetes occurrence or not. Hence, the response variable yi for the diabetic can be explained as: 1 for those entering the center and infected with diabetes, and 0 for those who were not diabetic.
Independent Variables
Firstly, we focused on a group of variables such as gender, age, tall, height, income, mass body index, infection, period of infection, kinship, and blood sugar. However, the information was not available for the entire variables; it either did not exist or incomplete. Therefore, we adopted the explanatory variables or independent variables for the study such as sex, age, educational level, income, kinship, and blood sugar.
Binary logistic regression
With binary logistic regression, we estimated the probability of a dichotomous response (which of course is also its mean) for various values of explanatory variables proposed by Willy (1996) [14] . We fit a following model of the form:
The term of the right side of the equation, called a logistic function. In which, the relationships between p and x are nonlinear and can be linearized. Let be the linear predictor where is defined by the transformation. This transformation is called the logit transformation of the probability p and the ratio called the Odds. Hence, multiple logistic regression model can be written as:
Fitting the logistic model
Logistic regression uses a maximum likelihood estimation technique to estimate the model parameters. In other words, ML finds the best values for n=ßo+ß1x1+……..+ßkxk Observed values of say, are the n independent random observations corresponding to the random variables (Y1, Y2, ….., Yn). Since Yi is a Bernoulli random variable with functional form and hence, the likelihood function is given by:
The estimation of parameters require the maximization of the likelihood function or equivalently the maximization of the natural logarithm of the likelihood function.
Literature Review
The previous studies related to the topic were summarized as follows: Suwannaphant and others (2017) [21] , aimed to determine the association between socioeconomic status and diabetes mellitus. They revealed that the prevalence of Diabetes Mellitus was 3.70% in 2010 and 8.11% for the year 2012. There was an association between socioeconomic status and diabetes mellitus. Respondents who were Females, old aged and of low educational attainment were vulnerable to diabetes mellitus. In addition, senthilevel (2012) [20] , concluded that the influencing factors of Diabetic retinopathy, one can protect patients from the development of diabetic retinopathy or reduce their probability of getting diabetic retinopathy. In the same line, Niyikora (2015) [17] , found that age, alcohol consumption, cholesterol level, occupation status, and hypertension were associated with the outcome of having diabetes. Explanatory variables like gender; smoking, family history of diabetes had weak association with being infected with diabetes. On the other side, Isnini (2018) [13] , concluded that attributes that impact on diabetes were nine including age, hemoglobin, sex, blood sugar pressure, white cell count, urea, total cholesterol, and BMI. Eliadarous (2017) [9] summarized that both self-rated health and health Utilities Index were lower in people with diabetes, compared with those without diabetes, and they were associated principally with pain, visual impairment and negative emotions. Ahmed and others (2001) [1] found that the prevalence of diabetes was (3.4%). Also, the problems of diabetes care in Sudan included shortage in equipped diabetes care centers, scarcity of trained specialists, expensive medications, weak coping with medicines and nutrition and illiteracy and inaccurate beliefs. Balla and others (2014) [6] revealed that the prevalence of diabetes is increasing in rural population of Sudan and knowledge about diabetes is low. Bakhet (2015) [4] showed that age, height, gender, sugar percentage in blood influence the level of diabetes. Alameen (2010) [2] , concluded that the independent variables of the study: the duration of the disease, the highest level of sugar in the blood, the lowest level of blood sugar, type, weight, blood pressure, follow-up, injury of a family member associated with diabetes. According to Balaji (2011) [5] , there were lower attendance rates in clinics (55%) and non-compliance to dietary requirements (79%), since most of the patients never receive diabetes education and care.
Statistical Data Analysis 6.1 Descriptive Statistics Results
The descriptive statistics for the variables in the current study showed that, for the gender there120 (59.4%) of the respondents were males and 82 (40.6%) were females. In terms of the participants' age, it was found that the highest number and percent for the age group was 68(33.7%) for the age group (41-50) year. The high number and percentages of educational level was (44.6%) for those who had secondary education, and 20 (9.9%) of the respondents were illiterate.
Regarding the income of the respondents, the high number and percentage were for the group (1000-3000) Sudanese pounds with 122 (60.4%). The variable infection of diabetes shows that there were 130 (64.4%) of the participants were diabetic and 72 (35.6%) of them were not infected with diabetes. The variable period of infection showed that there were 49 (24.3%) of the sample whose infection period was (11-20)
Chi-square test Results
The results of chi-square test presented in the table below, show an association between diabetes infection and the predictor variables such as gender, sex, family history, and kinship. Whereas the predictors; education, income, blood sugar found to be insignificant with diabetes infection.
Multiple Logistic Regression Results
Table (3) displays the results of the binary logistic regression, which shows the coefficients, standard error, Wald test for the predictors significant, odds ratio and coefficients of the factors associated with each of the predictor variables including the logistic regression model. It is obvious that there was a significant relationship between the variables: sex, age and diabetes infection. However, education level, income, and blood sugar were found to be statistically insignificant.
Goodness of Fitting the Logistic Regression Model
To check the adequacy of the model, Likelihood ratio (LR) tests, R 2 statistics, Hosmer-Lemeshow test and classified table were used. LR test revealed a significant difference between the likelihood ratios for the final model and the likelihood ratio for the model without predictor or reduced model. The results showed -2 Log Likelihood value for the reduced model and final model was 263.154 and 156.331, respectively. Chisquare statistics was 106.810 with (p-value = 0.000). This indicates that the final mode fitted well since the predictor variables had statistically significant impact on diabetes at 5% level of significance.
Model Summary of Binary Logistic Regression
Nagelkerke square was estimated at (0.564) indicating that the effect of the predictor variables was 56.4% in the dependent variable diabetes. i.e., 56.4% of the variance in patients who visited the diabetes centers whether they were positively diabetic, or they showed negative results was due to change in the explanatory variables.
Table 5: Model Summary
Step -2loglikelihood Cox and Snell R Square Negelkerke R Square 1 156.331 0.411 0.564
Testing the Goodness Fit of the Model
As shown by Hosmer-lemeshow test results, chi-square test statistics was 6.104 with p-value 0.636. Therefore, the study model was quite a good fit. This fact confirms that the estimated model fitted the data well.
Discussion
Descriptive statistics showed that 120 (59.4%) of the sample member were males and 82 (40.6%) were females. This result contradicts with the report of the Ministry of Health in the State of Khartoum in 2017 [16] , which revealed that women exported the list of diabetes, where the percentage of women with diabetes (85) thousand cases, while the incidence of diabetes for males were 73 thousand cases. The results obtained from the application of binary logistic regression showed that the factors gender, age, kinship have significant effects on diabetes infection at 5% level of significance. However, educational level, income, blood sugar were found to be statistically insignificant. This result is different from Alameen (2010) [2] study who found that blood sugar was associated with diabetes infection. On the other hand, the results revealed that having positive diabetes is significantly associated with the gender of those who entered the diabetes center in Port Sudan city and males more than females. This fact is confirmed by the odds ratio of the variable gender which was (0.273) implying that males were 0.273 times more likely to be infected with diabetes than females. Diabetes is associated with age, age group (51-60) presents odds ratio (1.662), this result indicates that those who were between 51-60 years old were 1.662 more likely to have diabetes than the other age groups. This result indicates that as the age of those who entered the diabetes center increases the possibility of being infected with diabetes increases. This finding is consistent with the finding by (CDC, 2011) [7] which found that in the age group 45-64 years, 13.7% had diabetic; and the highest percentage of 26.9% was found in the age group of ≥ 65 years. The same feature was also found in England, where the prevalence of diabetes was increasing with age. This result is in line with that result of Suwannaphant (2017) [21] and Isnini (2018) [13] . In addition, the kinship of the respondents was another factor that was significantly associated with diabetes; this is reflected in the result of the odds ratio (3.031), which indicates that individuals whose parents are diabetic; they are 3.031 more likely to be infected with diabetes than other classes of kinship such as brother, sister, grandfather/mother. This finding is consistent with the scientific fact that genetics has a relative effect on diabetes; especially a parent with diabetes that would expose children to diabetes. On the other side, the results showed that the educational level and blood sugar of the respondents had no significant effect on diabetes infection. This result contradicts with Bakhet's (2015) [4] study, which found that there was association between blood sugar and diabetes infection.
Conclusion
Diabetes in Sudan has been increasing in recent years. The study, conducted at the Center for Diabetes Therapy in Port Sudan, in the Red Sea State, concluded that the factors affecting diabetes are age, gender, and kinship. While variables such as educational level, income, blood sugar, do not have a relation with diabetes infection. Males were more infected with diabetes than females.
Recommendations
According to the results of the study, we propose the following recommendations: 1. A good information system must be provided to organize the information of those who attend the centers of diabetes in the Red Sea State. 2. Increasing the number of diabetes screening and treatment centers in all cities in the Red Sea State and developed existing centers. 3. Awareness of and knowledge about diabetes risk factors are needed to be raised. 4. More in-depth studies to further investigate factors that affect diabetes are needed to be conducted.
Figures and tables from the paper
| Variable | classification | Number | Percentage |
|---|---|---|---|
| Gender | Male | 120 | 59.4 |
| Female | 82 | 40.6 | |
| Age | 11-20 year | 2 | 1 |
| 21-30 year | 11 | 5.4 | |
| 31-40 year | 23 | 11.4 | |
| 41-50 year | 68 | 33.7 | |
| 51-60 year | 62 | 30.7 | |
| More than 60 | 36 | 17.8 | |
| Education | Illiterate | 43 | 21.3 |
| Primary | 30 | 14.9 | |
| Secondary | 90 | 44.6 | |
| University | 19 | 9.4 | |
| Post graduate | 20 | 9.9 | |
| Income | Less than 1000 pound | 63 | 31.2 |
| 1000-3000 pound | 122 | 60.4 | |
| 40000-100000 pound | 17 | 8.4 | |
| Infection of diabetes | Negative | 72 | 35.6 |
| Positive | 130 | 64.4 | |
| Period of infection | 1-5 year | 9 | 4.5 |
| 6-10 year | 22 | 10.9 | |
| 11-20 year | 49 | 24.3 | |
| More than 20 year | 43 | 21.3 | |
| Missing | 79 | 39.1 | |
| Infected family (history) | Yes | 125 | 61.9 |
| No | 77 | 38.1 | |
| Kinship | Parents | 127 | 62.9 |
| Brother | 25 | 12.4 | |
| Sister | 21 | 10.4 | |
| Grandfather/mother | 11 | 5.4 | |
| other | 18 | 8.9 | |
| Blood sugar | 70-120 mg/dl | 6 | 3 |
| 121-150 mg/dl | 67 | 33.2 | |
| 151-200 mg/dl | 74 | 36.6 | |
| More than 200 mg/dl | 55 | 27.2 |
Table text extracted from the original PDF; superscript letters are shown inline. The original table image is below.
View original table image
| Predictor variable | Response variable | Chi-square | p-value | result |
|---|---|---|---|---|
| Gender | Diabetes infection | 8.54 | 0.003 | significant |
| age | Diabetes infection | 31.29 | 0.000 | significant |
| Education | Diabetes infection | 8.43 | 0.077 | insignificant |
| Income | Diabetes infection | 3.90 | 0.142 | insignificant |
| Family history | Diabetes infection | 64.51 | 0.000 | significant |
| Kinship | Diabetes infection | 38.92 | 0.000 | significant |
| Blood sugar | Diabetes infection | 6.63 | 0.85 | insignificant |
Table text extracted from the original PDF; superscript letters are shown inline. The original table image is below.
View original table image
| Variable | B | S.E | Wald | df | Sig | Odds ratio | 95% C.l for Odds ratio | — |
|---|---|---|---|---|---|---|---|---|
| Lower | Upper | |||||||
| Sex (1) | -1.566 | 0.541 | 8.362 | 1 | 0.004 | 4.786 | 1.656 | 13.831 |
| Age | 9.788 | 5 | 0.008 | |||||
| (11-20) | -19.78 | 27215.3 | 0.000 | 1 | 0.999 | 0.000 | 0.000 | - |
| (21-30) | -2.05 | 1.129 | 3.294 | 1 | 0.07 | 0.129 | 0.014 | 1.178 |
| (31-40) | -0.904 | 0.796 | 1.289 | 1 | 0.256 | 0.405 | 0.085 | 1.928 |
| (41-50) | -0.803 | 0.664 | 1.463 | 1 | 0.227 | 0.448 | 0.122 | 1.646 |
| (51-60) | 0.508 | 0.679 | 0.531 | 1 | 0.466 | 1.662 | 0.424 | 6.520 |
| Education | 3.095 | 4 | 0.466 | |||||
| Illiterate | 23.739 | 12272.6 | 0.000 | 1 | 0.998 | 20405814482 | 0.000 | |
| Primary | 23.713 | 12272.6 | 0.000 | 1 | 0.998 | 19887752345 | 0.000 | |
| Secondary | 23.202 | 12272.6 | 0.000 | 1 | 0.998 | 11920786610 | 0.000 | |
| University | 22.157 | 12272.6 | 0.000 | 1 | 0.999 | 4194057486 | 0.000 | |
| Income | 2.934 | 2 | 0.231 | |||||
| Less than 1000 | -21.62 | 12272.6 | 0.000 | 1 | 0.999 | 0.000 | 0.000 | |
| 1000-3000 p | -22.58 | 12272.6 | 0.000 | 1 | 0.999 | 0.000 | 0.000 | |
| Kinship | 20.737 | 4 | 0.000 | |||||
| Parent | 1.109 | 0.699 | 2.517 | 1 | 0.113 | 3.031 | 0.770 | 11.922 |
| Brother | -1.488 | 0.940 | 2.506 | 1 | 0.113 | 0.226 | 0.036 | 1.425 |
| sister | -1.107 | 0.904 | 1.501 | 1 | 0.221 | 0.330 | 0.056 | 1.943 |
| Grand f/m | -21.83 | 11167.3 | 0.000 | 1 | 0.998 | 0.000 | 0.000 | |
| Blood sugar | 0.126 | 3 | 0.989 | |||||
| 70-120 mg/dl | 20.791 | 15214.4 | 0.000 | 1 | 0.999 | 1070590768 | 0.000 | |
| 121-150 mg/dl | -0.142 | 0.595 | 0.057 | 1 | 0.811 | 0.867 | 0.270 | 2.783 |
| 151-200 mg/dl | -0.181 | 0.517 | 0.123 | 1 | 0.726 | 0.834 | 0.302 | 2.300 |
| Constant | -0.886 | 1.125 | 0.620 | 1 | 0.431 | 0.412 |
Table text extracted from the original PDF; superscript letters are shown inline. The original table image is below.
View original table image
| Step Block step1 model | 106.810 | 19 | 0.000 |
|---|---|---|---|
| 106.810 | 19 | 0.000 | |
| 106.810 | 19 | 0.000 |
Table text extracted from the original PDF; superscript letters are shown inline. The original table image is below.
View original table image
References
22 in the original paper- Ahmed M, Ahmed NH. Diabetes mellitus in Sudan: The size of the problem and the possibilities of efficient care. Practical Diabetes international, 2001, 18(9).
- Al-Ameen F. The distinctive function of distinguishing foot problems in diabetics, Omdurman Islamic University, unpublished master thesis, Khartoum, Sudan, 2010.
- Almobarak AO, Barakat S, Suliman EA. Prevalence of and predictive factors for nonalcoholic fatty liver disease in Sudanese individuals with type 2 diabetes: is metabolic syndrome the culprit? Arab Journal Gastroenterol. 2015; 16:54-8.
- Bakhet S. Using the Linear Discriminative function to indicate the most important effective factors of getting diabetes among mature people: A case study of GIAD Specialized Hospital, Khartoum, Sudan, 2015.
- Balaji A. Quality of care among type 2 diabetes mellitus patients residing in an urban slum of Chennai Corporation --a community-based cross-sectional study. Journal of the Indian Medical Association. 2011; 109(7):462-468.
- Balla SA, Ahmed HA, Awadelkareem MA. Prevalence of diabetes, knowledge and attitude of rural population towards diabetes and hypoglycemic event. American Journal of Health Research. 2014; 2(6):356-360.
- Centers for Disease Control and Prevention. National diabetes fact sheet: national estimates and general information on diabetes and prediabetes in the United States. U.S. Department of Health and Human Services, Centers for Disease Control and Prevention: Atlanta, 2011.
- Central Bureau of Statistics, Sudan. Sudan household survey. In statistics, editor: Khartoum, 2010.
- ELaidarous H. Exploring the impact of diabetes in Sudan: Out-of-pocket expenditure and social consequences of diabetes on patients and their families. Department of Health Science, Karolinska Institute: Stockholm, Sweden, 2017.
- Elmadhoun WM, Noor SK, Ibrahim AA, Bushara SO, Ahmed MH. Prevalence of diabetes mellitus and its risk factors in urban communities of north Sudan: Populationbased study. Journal of diabetes. 2016; 8(6):839-46.
- Gadsby R. Epidemiology of diabetes. Advanced drug Delivery Reviews. 2002; 54(9):1165-72.
- Guariguata L, Whiting D, Hambleton I, Beagley J, Linnenkamp U, Shaw J. Global estimates of diabetes prevalence for 2013 and projections for 2035.Diabetes research and clinical practice. 2014; 103(2):137-49.
- Isnini Y, Badriyah T, Syarif I. Influencing of Logistic Regression Models for prediction and analysis of Diabetes risk factors. International journal of Engineering Technology. 2018, 6(1).
- John Willy, Sons Inc. An introduction to categorical data analysis. 3rded. New York, 1996.
- Ministry of Health. Sudan Annual Statistical Report. Khartoum: Sudan, 2001.
- Ministry of Health, State of Khartoum. Annual Report, Khartoum, Khartoum State, Sudan. 2017.
- Niyikora S. Multiple Logistic Regression modeling on risk factors of diabetes: A case study of Gitwe Hospital (2011-2013). Unpublished master thesis, Applied Statistics Department, Jumbo Kenyatta University, 2015.
- Noor SK, Elmadhoun WM, Bashara SO. Glycaemic control in Sudanese individuals with type 2 diabetes: Population based study. Diabetes Metab Syndr. 2017; 11(1):S147-51.
- Popkin BM, Adair LS, Ng SW. Global nutrition transition and the pandemic of obesity in developing countries. Nutr Rev. 2012; 70:3-21.
- Senthilevel V, Radhakrishnan R, Sathiyamoorthi R. Prediction of diabetes retinopathy among diabetics using binary logistic regression approach, Indian Journal of Medical Specialist. 2012; 3(1):18-20.
- Suwannaphant K, Laohasiriwong W, Puttanapong N, Seangsuwan J, Phajan T. Association between socioeconomic status and diabetes mellitus: The national socioeconomic survey, 2010 and 2012. Journal of Clinical and Diagnosis Research. 2017; 11(7):LC18LC22.
- World Health Organization. Global report on diabetes. www.who.int/diabetes/global-report. 2016.
Cited by 2
From OpenAlex, OpenCitations and reference lists read by Scinovex
- Prediction of Type 2 Diabetes through Risk Factors using Binary Logistic Regression ↗
Imad Yagoub Hamid · Journal of Al-Qadisiyah for Computer Science and Mathematics · 2020
The main objective of this study is to arrive at a highly efficient prediction model for early prediction of diabetes by relying on risk factors for diabetes as predictor variables. Using a binary logistic regression model, a model was built for the data of study which taken from a sample of diabetics and non-diabetics persons. The results have shown the…
❝ 6PDF - Assessment of Asymptotic and Logistics Growth Models on A Chemist Data ↗
Emmanuel O. Biu, M. T. Nwakuya, Gamage Tubona · European Journal of Mathematics and Statistics · 2022
This research considers two growth models; asymptotic growth model and logistic growth model. Both models were compared to establish a better model for modelling and prediction based on a Chemist data on the percentage concentration of isomers versus time for each Isomerization of α-Pinene at 189.50C. Results from the growth curve shows a non-linear relationship between the response (time of…
❝ 0PDF