
Research article · 2017 · Full text
International Journal of Statistics and Applied MathematicsSupply chain & inventory management in food industry: A case study
Volume 2(4) · Pages 38–42
Research areasSupply Chain and Inventory ManagementForecasting Techniques and Applications
Abstract
Author-writtenA company which provides food typically stores its products in a warehouse before shipping them to consumers. Inventory control play prominent role for the food processing& distribution firm because of the huge amount of food items typically stored. This excess amounts of stored items enhance inventory and supply chain management cost and results minimizing warehouse efficiency. Summing up, inventory control management should be the fundamental focus of the food processing & distributing firm, exceptionally for perishable packaged foods. The literature is however crucial to structure a system to express outcome in advance for forthcoming inventory. Some key issues associated with inventory control & supply management in the food processing & distribution firm have been revealed form surveying through experts, and analyzed sequential patterns to find fundamental concepts based on analytical results from the survey. This work proposed precise inventory predictive model, to uplift inventory prediction up to 64.9%. Through the sequential patterns based on thorough research, the food processing & distribution firm can manage inventory efficiently and accurately.
Summary
Source-checkedPlain-language reading of the full paper, prepared with AI and checked against the text. Each point links to the authors' own words.
Why it matters
- Inventory control is critical for food processing and distribution firms due to the large volume of items they typically store. View evidence ↗
- Excessive stored inventory increases supply chain management costs and reduces the overall efficiency of the warehouse. View evidence ↗
- Proper distribution and inventory management are essential to prevent the spoilage of packaged food items. View evidence ↗
The question
- The primary goal of this research is to design a model for predicting inventory. View evidence ↗
What they did
- The study used the Analytic Hierarchy Process (AHP) to survey 15 experts, including professors, managers, and operators, to determine the weight of factors affecting inventory management. View evidence ↗
- The forecasting model was built using data from 2012 to 2016 to predict input foods for the period from 2013 to 2017. View evidence ↗
- The methodology involves identifying key constraints and then using sequential pattern analysis to forecast future input food items. View evidence ↗
What they found
- The highest weights assigned to constraints were for the current state of input/output foods (0.0382), input/output frequency (0.0382), and quantity of stored foods (0.0361). View evidence ↗
- The proposed forecasting model achieved a precision range of 39.8% to 64.9% for upcoming food items between 2013 and 2017. View evidence ↗
- The proposed predictive model was able to increase inventory prediction accuracy up to 64.9%. View evidence ↗
What it means
- The authors conclude that because the model can reach 64.9% precision, it is crucial for organizations to adopt it for inventory forecasting. View evidence ↗
Visual summary
1 visualsIllustrations explain the paper; charts are replotted from the paper's own table values.
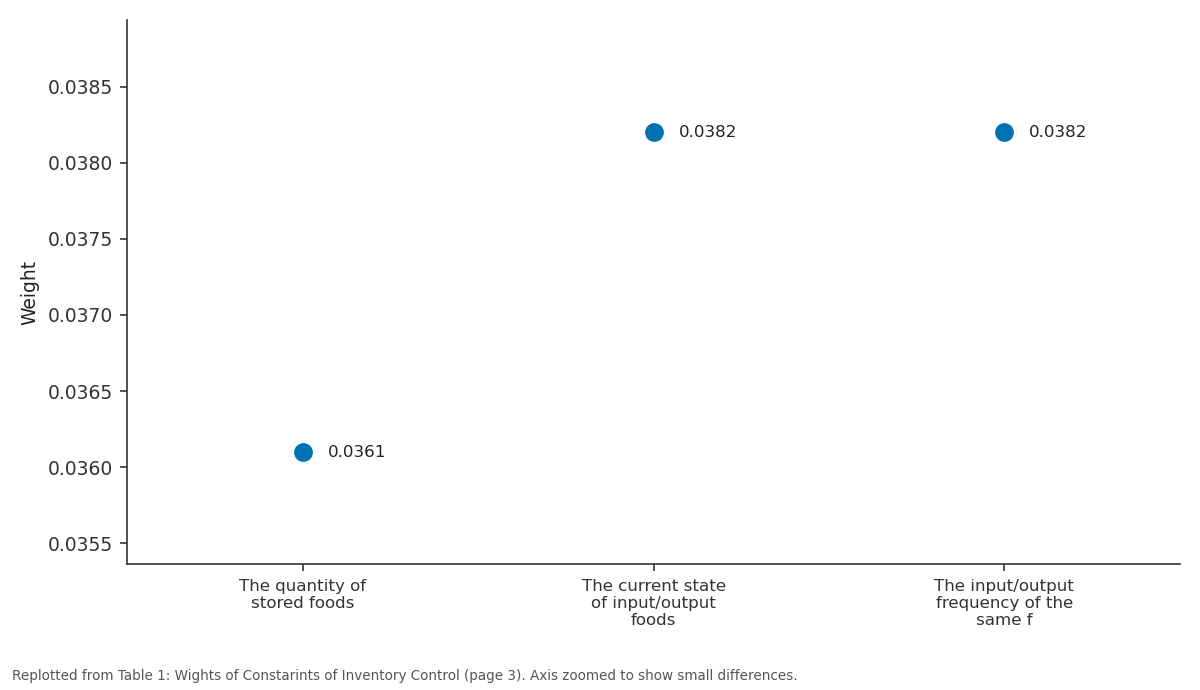
Weight: The quantity of stored... vs The current state of... vs The input/output...
Replotted from Table 1 (page 3) of the original paper. Every bar is the paper's own table value.
View source evidence ↗Figures & tables
From the original paper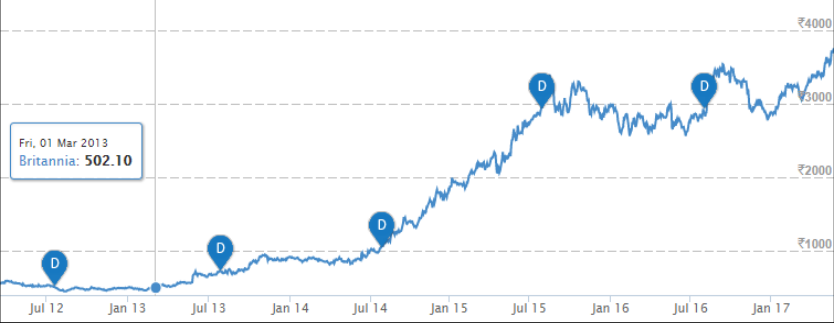 Figure 1
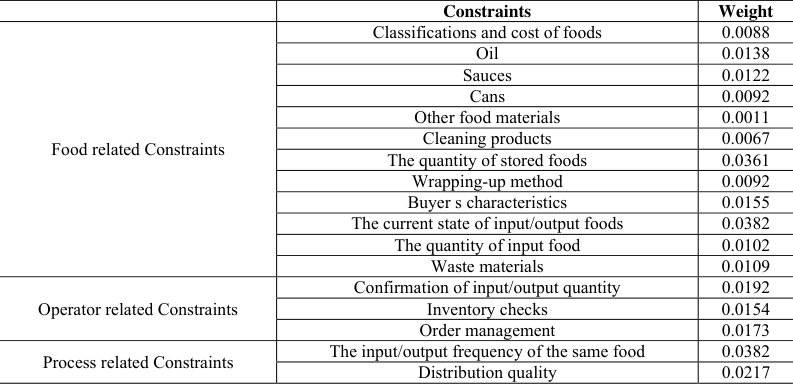 Table 1
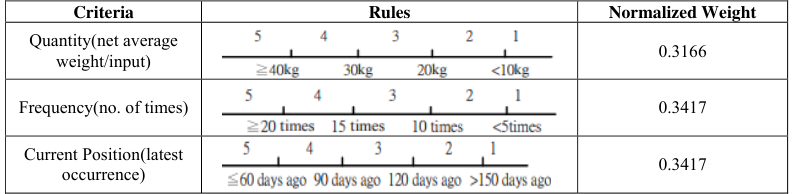 Table 2
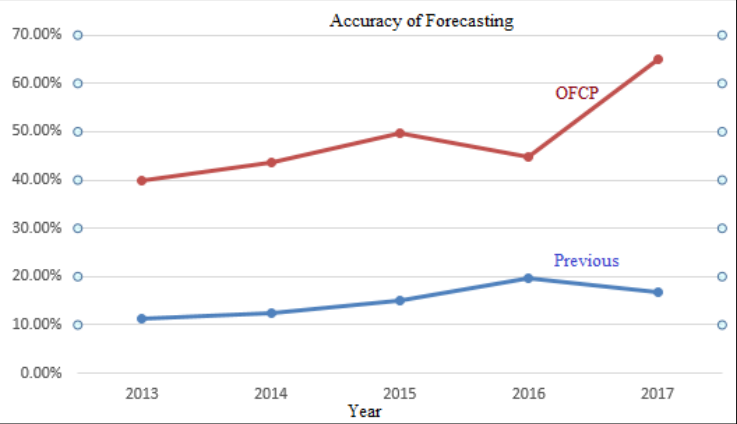 Figure 2
Introduction
Population of world are growing rapidly, preserving of food is real challenge in modern days. Especially, foods can be rot while supplying as well as natural spoilage. Through some processing steps, foods are transformed into processed food packets. Like, meat is reformed into different meat based food items through processing. Even though delicious meat portions may be tainted on cooking, it is generally restrained for food processing. Also, processing foods in packaged form can avoid natural perishing by using preservatives. Thus, through processing steps, a manufacturer can enhance the utility of food item and further minimize unnecessary wastage introduced by Connor & Schiek, Smith & Furness in late nineties [1,2] . Lummus, Vokura and Akkerman, revealed the concept that the distribution for a food processing & distribution firm is keen factor for processed packaged foods. Without a proper distribution channel and inventory supply management, packaged food items have a maximum probability of spoilage. Thus, inventory control & supply management chain has become a major concern that affects the performance of the food processing & distributing firms (Hsiao in 2011) [14] . Because this type of organizations need to input and process foods from different otherre sources, a warehouse can stock input foods as inventory, but as the quantities of foods increases gradually results that the inventory is very difficult to manage (Dennis in 1999 & Mahalik, Nambiar in 2010) [11,18] . To regulate inventory, an industry must predict the quantity of input food items at earlier. Literature studies revealed that seasonality analysis (Batori in 2010 & Zhang in 2011) [6,23] , a mathematical modelling concept as Mackov chain (Stefanovic &Stefanovic in 2009) [21] can be accepted to forecast inventory. In data-mining area (Stefanovic & Stefanovic in 2009, Zhang in 2011) [23,21] , the sequential pattern analysis is an adequate approach to analyze repeated patterns of input foods items along a time sequence (Hu & Kao in 2011, Ngai in 2009). However, factors affecting inventory management system of the food processing & distribution firms must be convoluted in an analysis of the sequential pattern. To manage inventory system effectively, factors affecting inventory management system must be focused.
Past studies have configured that three dominant foodprocess-operator related factors, influence inventory supply chain management in the food industry (Connor in 1988) [1] . The significance of each factor can be recognized via the decisions of researchers (Cox in 2010) [10] . The factors could be applied to inventory management based on various business characteristics of different food firms. Thus, many expertise firms in this domain are struggle to meet requirements. But information technology experts can be find a solution to reach through a web-based manufacturing system. The inventory can also be preciously govern through information technology. Thus, an application composed with expert's opinions to the factors affecting inventory control & supply chain management of food processing and distribution firm and the sequential pattern analysis are focused in this work. The further sections of this paper is organized as follows. Section 2 focuson different factors of inventory control & supply chain management in food industry. Section 3 demonstrate the details the research methodology. Subsequently, Section 4 finds analytical results based on suitable example of InfoTech company. Finally, Section 5 presents concluding remarks.
Factors of Inventory Control & Supply Chain Management in food industry
Inventory controlling concept is one of the biggest assets of any industry, also quite expensing as half of the invested capital belongs to it. Managers of the companies have to ensure that good inventory control model is recognized. Different firms have their different levels of inventory models to cut down the recurring cost at one hand but, on the other hand, customers are not satisfied with frequent inventory outages or we can call it as stock-outs. So, every firm has to maintain balance in between various inventory levels. In the food processing & distributive firm, an industry uses a set of methods to change complete ingredients into foods (transformation of foods into other products) for consumption by consumers (Connor in 1988) [1] . This packaged foods are then supplied to different vendors through some distribution methods (Dennis in1999, Smith & Furness in 2006) [11,4] . The big amount of raw input foods and processed foods (packaged) waiting for delivery are little bit tough to manage in a warehouse because food is spoilable after a span of time (Dennis in 1999, Mahalik & Nambiar in 2010) [11,18] . To stop economic break down caused by spoiled foods, inventory control must address food-process-operator related constraints. First constraint (food) consists categorizations and cost of foods (like oil, sauces, cans, and various raw food materials), wrapping-up method (Bank in 2010, Wang in 2010) [5,22] , waste product materials, cleaning products (Connor in1988, Hsiao in 2011) [14,1] , the quantity of stocked food items (Hsiao in 2011) [14] and buyers' characteristics (Dennis in 1999, Han in 2009) [11] . The quantity of stocked food items is most important in inventory control system. Let's assume, a low-cost food that covers a bigger space in a warehouse. So, allocation of that items in warehouse is again a crucial step (Hsiao in 2011) [14] . The second (Process) constraint consists input as well as output frequency of the same food (Alfaro Connor in 1988 [1] , Hsiao in 2011 [14] , Wang in 2010, Zhao in 2001) [14,24,22] , and the distribution quality (Wang in 2010, Zhao in 2001) [22,24] . The input as well as output frequency of the same food can affect inventory quantity Q (Findiastuti in 2011) [12] . The current occurrence of input &output food is also an important measure because current input & output foods affect the current finance situation (Findiastuti in 2011) [12] . Last, operator constraint consists inventory checks, confirmation of input as well as output food items, and order management (Hsiao in 2011) [14] . This third constraint plays a vital rolebecause operators influence warehouse management performance, which is typically exhaustive work.
Research Methodology
The main objective of this work to design an inventory prediction model. To develop this type of system, this literature study recognized the key constraints through surveying experts for AHP analysis. In this survey, the analytic hierarchy design was based on the AHP analysis introduced by Saaty in the 1970. This analysis can be enforced to reconstruct critical decision-making problems. First, manifold systems are breaking into clearly defined elements layer. Later, the relative weight and overall order of constraints are derived for each and every layer through pairwise comparisons. By analyzing the hierarchy established model (literature), the importance of each constraint can be recognized. After recognizing key constraints, the analysis of sequential patterns should be incorporated to forecast forthcoming input food items. Data mining have crucial role in finding this type of sequence patterns, which is anxious with finding statistically appropriate patterns between data set, and the values are delivered in a sequence (Jea in 2009) [16] . Literature often suppose these values are discontinuous and however, timeseries mining is closely related (Jea in 2009) [16] . These sequential patterns are beneficial in terms of identifying repeated events, even when no apparent relationships between events (Hu & Kao in 2011) [15] .
Fig 1:
Growth rate of case firm So, there is no use of focus on all events. Although, for various businesses, the importance of duplicated events should be treated based on business requirements. Let's assume, a duplicate item may be ignored because of its less price. In this literature, the influence of constraints recognized in analytical outcomes by the AHP, which was focused as selection parameter for repeated food items. Through this analysis and using meaningful parameters for the sequential pattern of items, the forecast of forthcoming input foods should be found. In this work, a food processing & distribution firm in India is picked as the case firm to show out comings of the abovementioned composition of research methods. The case firm is with net profit of Rs. 233.87cr-843.69cr generated from year 2013-17. This firm deliver large amount of food products in India. Any company can face a critical situation on inventory management, because of incorrect prediction on the next year's inventory quantity. The weight of each factor affecting inventory could be used to get the urgent problem to inventory management. To figure out the weight of each factor affecting inventory management, this work surveys 15 experts using AHP method from the academic and industry areas: professors of food firms as well as managers and operators from food companies. Moreover, this work will apply the analytical results to sequential patterns in order to calculate the improvement of the forecasting of forthcoming inventory. This work used the data from 2012 to 2016 to build up the forecast model and found the possible input foods from 2013 to 2017.
Analytical Result & Forecasting Model
The analytical outcomes of AHP method show that the quantity of stocked foods, the input as well as output frequency of the same food, and the current position (CP) of input & output food are [8] . This model is well known for customer relationship management, but monetary is not considered in the inventory control. In order to apply QFCP to inventory forecasting (IF), the weight of QFCP (WQ, WF, WCP) should be normalized. The original value set of IF (0.0361, 0.0382, 0.0382) should be changed to IP (0.3166, 0.3417, 0.3417). That is, IF (0.3166, 0.3417, 0.3417) is the weight to determine the importance of food to inventory management. Applying QFCP to sequential pattern analysis, the valuable highlighted products could be found. In this work, the manager of the case firm defined the QFCP as shown in table 2. The value of Q will be set to 5 if the net weight of the food is larger than or equal to 40 Kg. The value of F will be set to 5 if the food appeared more than or equal to 20 times over the past one year. The value of CP will be set to 5 if the latest time of occurrence is smaller than or equal to 50 days ago. The weight value of QFCP is (Q*WQ + F*WF + CP*WCP). So, the value of QFCP is 4.3166, if the net weight of sunflower oil is 41 kg, input 17 times over the past one year, and the latest time of occurrence is 70 days ago.
| Criteria | Rules | Normalized Weight |
|---|---|---|
| Quantity(net average weight/input) | 0.3166 | |
| Frequency(no. of times) | 0.3417 | |
| Current Position(latest occurrence) | 0.3417 |
Table text extracted from the original PDF; superscript letters are shown inline. The original table image is below.
View original table image
Conclusion
Inventory control & supply chain management plays prominent role to the food processing& distributive firms because of the large scale storage of food items. In this proposed work, a forecasting model composed with factor analysis tool and a forecasting tool is proposed. By means of AHP analyzing method, the constraints could be found through surveying experts. The survey outcomes then tested to sequential-pattern analysis to forecasting the upcoming materials in an inventory. This work surveyed by experts and found that the quantity of stocked foods, the current position of input &output food items as well as he input &output frequency of the same food items are three important things of a food processing & distributivefirm. This present work summarized the above described constraints as QFCP (quantity, frequency, and current position), and weighted each factor to calculate the importance of each material in any inventory model. Proposed forecasting model, the precision of inventory forecasting could be 64.9%. It is crucial for an organization to adopt as the inventory forecasting.
Figures and tables from the paper
| — | Constraints | Weight |
|---|---|---|
| Food related Constraints | Classifications and cost of foods | 0.0088 |
| Oil | 0.0138 | |
| Sauces | 0.0122 | |
| Cans | 0.0092 | |
| Other food materials | 0.0011 | |
| Cleaning products | 0.0067 | |
| The quantity of stored foods | 0.0361 | |
| Wrapping-up method | 0.0092 | |
| Buyer s characteristics | 0.0155 | |
| The current state of input/output foods | 0.0382 | |
| The quantity of input food | 0.0102 | |
| Waste materials | 0.0109 | |
| Operator related Constraints | Confirmation of input/output quantity | 0.0192 |
| Inventory checks | 0.0154 | |
| Order management | 0.0173 | |
| Process related Constraints | The input/output frequency of the same food | 0.0382 |
| Distribution quality | 0.0217 |
Table text extracted from the original PDF; superscript letters are shown inline. The original table image is below.
View original table image
References
24 in the original paper- Connor JM. Food Processing, Lexington Books, Lexington, MA, 1988.
- Connor JM, Schiek WA. Food processing: an industrial powerhouse in transition, Wiley-Interscience, 2nd Eddition, 1997.
- Lummus RR, Vokura RJ. Defining supply chain management: a historical perspective and practical guidelines, Industrial Management & Data System, Vol. 1999; 99(1):11-17.
- Smith I, Furness A. Improving traceability in food processing and distribution, Wood-head Publishing in Food Science, Technology and Nutrition. 2006, 119.
- Bank CJ, Chesshire M, Heaven S, Arnold R. Anaerobic digestion of source segregated domestic food waste: Performance assessment by mass and energy balance, Bioresource Technology. 2010; 102(2):612-620.
- Batori Z. Supply chain intelligence: benefits, techniquesand future trends", the Proceedings of the 8thInternational Conference on Management, Enterprise and Benchmarking, Budapest, Hungary. 2010, 233-240.
- Chen CH. Inventory Management of Food-Processing Industry. Master Thesis, National Formosa University, 2012.
- Chen YL, Kuo MH, Wu SY, Tang K. Discovering recency, frequency, and monetary (RFM) sequential patterns from customers' purchasing data, Electronic Commerce Research and Applications. 2009; 8(5):241251.
- Connor JM, Schiek WA. Food processing: an industrial powerhouse in transition. Wiley-Interscience, 2nd Edittion, 1997.
- Cox H, Mowatt S, Prevezer M. New Product Development and Product Supply within a Network Setting: The Chilled Ready-meal Industry in the UK, Industry & Innovation. 2010; 10(2):197-217.
- Dennis C, Hall RL, Kurien V, Hulse JH, Smoth RE. Food processing and distribution Food security: new solutions for the [21st] century. Proceedings of the Symposium honoring the Tenth Anniversary of the World Food Prize.1999, 293-337.
- Findiastuti W, Anityasari M, Singgih L. Green Productivity Index: Do Different Terms Measure the Same Things?, the Proceedings of Industrial Engineering and Service Science. 2011, 20-21.
- Han J, Trienekens JH, Omta SWF. Integrated information and logistics management, quality management and firm performance of pork processing industry in China British Food Journal. 2009; 11(1):9-25.
- Hsiao HI, Kemp RGM, van der Vorst JGAJ, Onta SWF. Logistics outsourcing by Taiwanese and Dutch food processing industries, British Food Journal, 2011; 113(4):550-576.
- Hu YH, Kao YH. Mining Sequential Pattern with Consideration to Recency, Frequency, and Monetary, the Proceedings of the Pacific Asia Conference on Information Systems PACIS, 2011.
- Jea KF, Lin KC, Liao IE. Mining Hybrid Sequential Patterns by Hierarchical Mining Technique, International Journal of Innovative Computing, Information and control. 2009; 5(8):2351-2367.
- Lao SI. An Integrative Food Handling System for managing inventory information in food warehouses," the Proceedings of Technology Management for Global Economic Growth PICMET'10. 2010, 1-7.
- Mahalik NP, Nambiar AN. Trends in food packaging and manufacturing systems and technology Trends in Food Science & Technology. 2010; 21(3):117-128.
- Ngai EWT, Xiu L, Chau DCK. Application of data mining techniques in customer relationship management: A literature review and classification Expert Systems with Applications. 2009; 36(2):2592-2602.
- Smith I, Furness A. Improving traceability in food processing and distribution, Woodhead Publishing in Food Science, Technology and Nutrition. 2006, 119.
- Stefanovic N, Stefanovic D. Supply chain business intelligence: technologies, issues and trends, Lecture Notes in Computer Science. 2009; 5640:217-245.
- Wang J. Application of SVM Combined with Markov Chain for Inventory Prediction in Supply Chain", the Proceedings of the 4thInternational Conference onWireless Communications, Networking and Mobile Computing. 2008, 1-4.
- Zhang P, Joshi M, Lingras P. Use of Stability and Seasonality Analysis for Optimal Inventory Prediction Models, Journal of Intelligent Systems. 2011; 20(2):147166.
- Zhao M, Dröge C, Stank TP. The effects of logistics capabilities on firm performance: customer-focused versus information-focused capabilities, Journal of Business Logistics. 2001; 22(2):91-107.