
Research article · 2019 · Full text
International Journal of Statistics and Applied MathematicsEffect of changing the number of parameters in a dataset on the result of k-means clustering algorithm
Volume 4(3) · Pages 43–46
Research areasAdvanced Data Processing TechniquesData Mining Algorithms and Applications
Abstract
Author-writtenOne of the main analytical techniques in data mining nowadays is clustering analysis. Clustering analysis is the task of grouping a set of objects in such a way that objects in the same group are more similar to each other than to those in other groups. One of the most common clustering algorithms is the k-means algorithm. This paper is a study of effect of changing the number of parameters in a dataset on the result of k-means clustering algorithm.. Experimental results show that there is a considerable saving in runtime without affecting the results if the input data points are appropriately chosen.
Summary
Source-checkedPlain-language reading of the full paper, prepared with AI and checked against the text. Each point links to the authors' own words.
Why it matters
- Clustering analysis is a data mining technique used to group similar objects together while keeping them distinct from other groups. View evidence ↗
- The k-means algorithm is a widely used, unsupervised, and non-deterministic iterative method for clustering. View evidence ↗
- Increasing the amount of data typically increases the time required for the algorithm, but reducing data can lead to poor performance. View evidence ↗
The question
- The study aims to investigate how changing the number of features in a dataset affects the results of the k-means clustering algorithm to identify redundant features. View evidence ↗
What they did
- The experiments were implemented in Python using pandas, numpy, and scikit-learn libraries on an Ubuntu 16.04 operating system. View evidence ↗
- Three datasets were used: Iris (4 attributes, 150 records), Glass (9 attributes, 214 records), and Letter (16 attributes, 20,000 records). View evidence ↗
- The researchers compared the accuracy and runtime of the original dataset against versions where parameters were removed at random. View evidence ↗
What they found
- For the Glass dataset (with 8 original features), removing one feature maintained 100% accuracy and improved runtime by 19.969%, but removing two features dropped accuracy to 58.875%. View evidence ↗
- For the Iris dataset (4 original features), removing one feature resulted in 97.3% accuracy and removing two features resulted in 92.667% accuracy, with a 7.206% difference in time. View evidence ↗
- For the Letter dataset (16 original features), removing one feature led to 95.3% accuracy and removing two features led to 89.237% accuracy, with a 9.652% difference in time. View evidence ↗
- In the Glass dataset, removing iron as a parameter did not change the accuracy, whereas removing magnesium caused a high decrease in accuracy. View evidence ↗
- Unlike the Glass dataset, the Iris and Letter datasets showed a considerable effect on accuracy when even a single parameter was reduced. View evidence ↗
What it means
- The authors conclude that by appropriately selecting and removing redundant parameters, runtime can be improved without significantly impacting accuracy. View evidence ↗
- The authors suggest that trading a slight decrease in accuracy for improved runtime is a worthwhile trade-off depending on the specific requirements. View evidence ↗
Visual summary
3 visualsIllustrations explain the paper; charts are replotted from the paper's own table values.
Accuracy vs. Runtime Trade-off
AI-generated conceptual illustration (A digital dataset represented as a 3D cloud of multicolored data points in a coordinate system). It explains the idea and does not show study data.
View source evidence ↗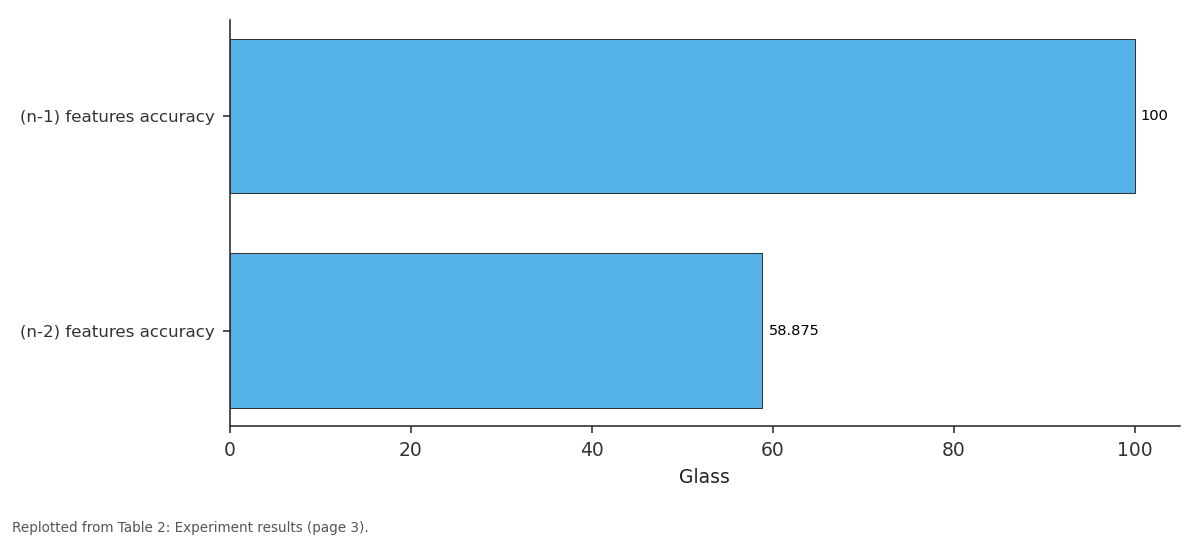
Glass: (n-1) features accuracy vs (n-2) features accuracy
Replotted from Table 2 (page 3) of the original paper. Every bar is the paper's own table value.
View source evidence ↗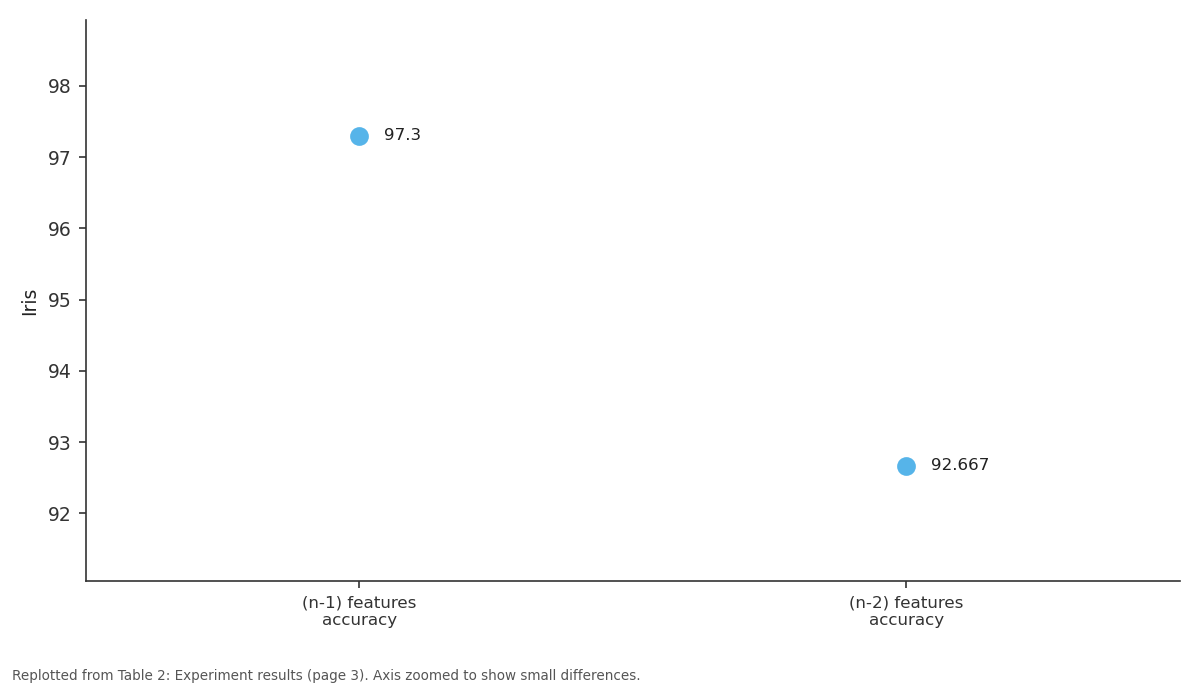
Iris: (n-1) features accuracy vs (n-2) features accuracy
Replotted from Table 2 (page 3) of the original paper. Every bar is the paper's own table value.
View source evidence ↗Figures & tables
From the original paper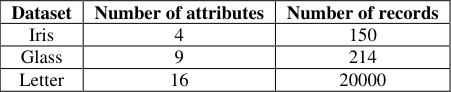 Table 1
 Table 2
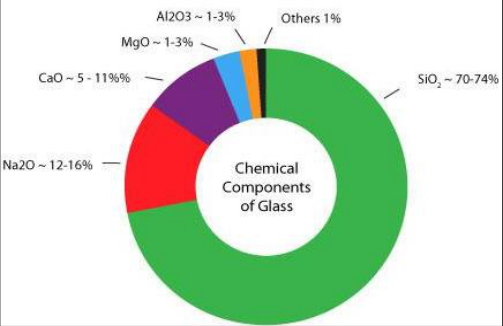 Figure 1
Introduction
Clustering can be considered the most important unsupervised learning problem. It deals with finding a structure in a collection of unlabeled data. It is basically the process of organizing objects into groups whose members are similar in some way. A cluster is, therefore, a collection of objects which are 'similar' between them and are 'dissimilar' to the objects belonging to other clusters. So the goal of clustering is to determine the intrinsic grouping in a set of unlabeled data. The increase in demand for demand in this digital era makes clustering one of the most widely used algorithm and it finds its application in fields such as artificial intelligence, bioinformatics, data compression, image compression, data mining, information retrieval, image processing, machine learning, marketing, medicine, psychology, statistics, cityplanning, identifying trends of customer and so on. The k-means algorithm is one of the most popular iterative descent clustering methods. It is a numerical, unsupervised, non-deterministic iterative method. k-means clustering aims to partition n observations into k clusters in which each observation belongs to the cluster with the nearest mean, serving as a prototype of the cluster. This results in a partitioning of the data space into Voronoi cells, which is basically the partitioning of a plane with n points into convex polygons such that each polygon contains exactly one generating point and every point in a given polygon is closer to its generating point than to any other. It is a simple and very fast algorithm, so in many practical applications, this method has been proven to be a very efficient method to produce good clustering results. [1] There have been many attempts at improving the k-means algorithm, with special aims at improving the time complexity of the algorithm. But with the increase in the number of data, time is surely bound to increase. And decreasing data might result in a poor performance of the algorithm. What this research paper offers is a comprehensive study of the changing the number of features in a dataset on the result of k-means clustering algorithm, which in turn can help us to figure out what features of a dataset are redundant and offer little or no help in the computation of clusters. Hence, we can further improve the runtime performance of the kmeans clustering algorithm by neglecting such features altogether. This paper includes four parts: The first part is the introduction, the second part details the standard k-means algorithm and shows the various shortcomings of the same. The third part describes the experiment process used to improvise on the k-means clustering algorithm and the data sets used. And the final part gives the experimental results and the conclusions obtained.
Materials and methods A. K-means clustering algorithm
This part describes the working process of the standard kmeans algorithm. k-means is a clustering algorithm that is widely used for its simplicity, speed and accuracy. The term "k-means" was first used by James MacQueen in 1967 [2] . The standard algorithm was first proposed by Stuart Lloyd in 1957 as a technique for pulse code modulation [3] . It is basically a partitioning clustering algorithm which is used to classify the given data into k different clusters through the iterative process, thereby converging to a local minimum. So the outcome produced by this algorithm is compact and independent. The algorithm's process can be divided into two separate parts. The first part selects k centres randomly from the data set, where the number of clusters k is predetermined by the user. The next part is to take each point to the nearest cluster centre. Generally, Euclidean is considered to determine the distance between each data object and the cluster centres. So then all the data points have been assigned a cluster initially. Then the recalculating of the distance of the cluster from the data points is done and this iterative process goes on till the function becomes minimum. Suppose, the data object is x, x i indicates the average of cluster C i , criterion function is defined as follows:
E is the sum of the squared error of all data in the data set. The distance of criterion function is generally Euclidean distance, which is used for determining the nearest distance between each data point and the cluster centre. For two vectors x = (x 1 , x 2 ,... The k-means algorithm always converges to a local minimum. The running time complexity of the algorithm is O(nkt), where n is the number of all data points, k is the number of clusters, and t is the number of iterations, and all these satisfy the condition k<<n and t<<n. [4] There are some shortcomings of the k-means algorithm which has led to the development of more advanced form of algorithms that have more efficient accuracy and lesser run time complexity. Some of the major shortcomings of the kmeans algorithm are-
C. Shortcomings of k-means clustering algorithm
C. Shortcomings of k-means clustering algorithm
D. Calculation for data vs time trade-off of k-means algorithm
The standard k-means algorithm needs to calculate the distance from each data point to the cluster centroid and then update the value of the cluster centroid, and also it performs it over repeated iterations. This takes up a lot of time but also, the more the number of iterations, the more can be the efficiency of clustering. This paper presents the idea of data vs time trade-off in the kmeans clustering algorithm. A normal k-means clustering algorithm works on all the available data features that is supplied to it, regardless of whether each features is conducive to the final result of the algorithm or not. Here, we use k-means clustering algorithm to identify such redundant data features and then compare this modified result to the original result. So, the main idea of this paper is to use the standard k-means algorithm on 3 common open-source and easily available data sets and compare the accuracy, run-time and the effect of decreasing the features to cut time short on each data set. The code for k-means has been written in python and the libraries that are used for k-means are pandas, numpy and scikit-learn. The experimental operating system used is Ubuntu 16.04. This paper used iris, glass and letter [4] as the test data sets and gives a brief description of the datasets used in the experiment. Table 1 shows the main characteristic of the datasets. The experimental process is as follows Input: The number of desired clusters k, and a dataset D = {d 1 , d 2 ,..d n }
| Dataset | Number of attributes | Number of records |
|---|---|---|
| Iris | 4 | 150 |
| Glass | 9 | 214 |
| Letter | 16 | 20000 |
Table text extracted from the original PDF; superscript letters are shown inline. The original table image is below.
View original table image
Output: A set of k clusters
Steps: Select k data points from the dataset D as the initial cluster centroids 1. Then compute the distance between each data point and the clusters k as Euclidean distance and assign data point di to the nearest cluster.
2. Then for each data point, find the nearest cluster.
3. Iterate these steps until the local minimum is reached. 4. Store the cluster centroids, the clusters and the time for this algorithm in some variables 5. Then reduce the feature or some data values of the dataset and perform the k-means algorithm. 6. Record the values for this step. 7. Compute the variance and deviation between the two final values.
Results and discussions
This paper uses three different data sets viz. Glass,Iris and Letter as mentioned in Table 1, to test the effect of reduction in the number data features. Two simultaneous experiments were carried out to measure the accuracy and run time. In the first run the dataset was used as it was, whereas in the second run some of the parameters were removed at random and the relative change in the accuracy and run time was evaluated.
For example in Glass dataset first iron as parameter was removed and it was observed that there was not much of effect on the accuracy whereas the run time got improved by 19.969% as depicted in table 2. Further reduction in the number of parameter had a drastic impact on the accuracy. Similar runs were repeated with Iris and Letter datasets. The results are summarized in table 2. The experimental operating system is Ubuntu 16.04 and the programming language used is python with pandas, numpy and scikit-learn. In all the cases, we have considered the accuracy achieved with the original dataset as 100% while the result obtained with the changed feature set is calculated. This paper uses glass and iris as the test datasets, as shown in Table 1.
| Data Set | Original no of features (n) | (n-1) features accuracy | (n-2) features accuracy | Percentage difference in Time |
|---|---|---|---|---|
| Glass | 8 | 100% | 58.875% | 19.969% |
| Iris | 4 | 97.3% | 92.667% | 7.206% |
| Letter | 16 | 95.3% | 89.237% | 9.652% |
Table text extracted from the original PDF; superscript letters are shown inline. The original table image is below.
View original table image
Conclusion
Hence from the above results, we can conclude that removing some parameters from the original dataset does not impact the result much whereas there is significant improvement in the run time like in case of Glass dataset with iron as parameter removed. Therefore there can be certain parameters in a dataset which don't affect the general result of the k-means clustering algorithm on accuracy. So this algorithm can help us to find out such redundant data features by brute force exclusion and inclusion of each feature. This reduction in the number of features, however, provides us with an improved time complexity as the runtime of the algorithm gets improved due to a lesser number of data features. And this removal of data features has no, only a little or considerable effect on the accuracy of the algorithm which is apparent from the table 2. Hence, it can be concluded that parameters can be selected appropriately so that they do not have much effect on the accuracy but at the same time they improve the run time. So it's worth to trade a slight deviation in accuracy for the sake of improvement in the runtime, provided if the condition deems such measure.
Here in the case of the glass data-set, if we look into the main composition of a glass, according to the pie chart below: The composition of glass [13] We find that silicon plays the most essential role in terms of percentage of constituents and other constituents like, iron, etc play a very subtle role in the overall composition of the glass. So, we can consider silicon to be one of the essential elements of a glass whereas iron to not be an essential element. So if we perform the k-means clustering algorithm taking the all the elements first, and then if we perform k-means clustering algorithm with removing iron from the dataset, we find that the accuracy we get is still 100%, i.e, it's unchanged. But with the removal of magnesium, there is high decrease in the accuracy. Hence iron as a parameter isn't a crucial when it comes to judging a glass' type.
Analyzing the results for the remaining two datasets, i.e Iris and Letter, we observed that reduction of even one parameter makes a considerable effect on the accuracy of flower type classification and letter classification respectively. So for these datasets, all parameters play a crucial role.. Hence, using this feature we can predict the essential and nonessential data-points of our data-sets This tradeoff hence can be used to identify such data points and features which are redundant and whose absence or presence barely affects the final result, and also those data points which are essential to the overall result of the algorithm. Therefore, some features might be more important to the dataset than the others, and some might not affect the result as a whole. Hence, we can make computation faster and cheaper and this reduction in the features can decrease the space and time complexity if, provided we choose those features with care.
Figures and tables from the paper
References
5 in the original paper- Fahim AM, Salem AM, Torkey FA. An efficient enhanced k-means clustering algorithm Journal of Zhejiang University Science A. 2006; 10:1626-1633.
- Alsabti, Khaleed, et al, An Efficient k means clustering algorithm, Syracuse university Surface, 1997
- Singh Archana et al, K-means with three different distance metrics, International Journal of Computer Applications, 2013, 67(10).
- Bradley, Paul S, Fayyad Ussama M. Refining Initital points for K-means clustering, Microsoft Research, 1998.
- Bradley, Paul S, Fayyad, Ussama M. Refining Initital points for K-means clustering, Microsoft Research, 1998.