
Research article · 2020 · Full text
International Journal of Geography Geology and EnvironmentPopulation change in Bihar: Reasons and consequences
Volume 2(2) · Pages 31–39
Research areasAgricultural risk and resilience
Abstract
Author-writtenHuman resource is the most important resource of a place but when population grows with a high speed then it becomes liabilities. The population of Bihar is growing very fastly and it is consider as population explosion.
Summary
Source-checkedPlain-language reading of the full paper, prepared with AI and checked against the text. Each point links to the authors' own words.
Why it matters
- While human resources are vital, rapid population growth can transform them into liabilities for a region. View evidence ↗
- The state of Bihar is experiencing very rapid population growth, which is characterized as a population explosion. View evidence ↗
The question
- The study aims to describe the status of family planning programs and population policies in Bihar to identify ways to accelerate population stabilization. View evidence ↗
What they did
- The research primarily utilized secondary sources, such as government reports, policy papers, and literature reviews. View evidence ↗
- Additional data was collected through discussions with stakeholders, including government officials, NGOs, and donor agencies. View evidence ↗
What they found
- Between 2001 and 2011, Bihar's population grew by 25.07%, significantly higher than the national growth rate of 17.64%. View evidence ↗
- As of 2011, Bihar had a population density of 1102 persons per sq. km, which is much higher than the Indian national average of 382 persons per sq. km. View evidence ↗
- According to 2010 estimates, Bihar's total fertility rate was 3.7 children per woman, exceeding the national rate of 2.5. View evidence ↗
- Early marriage is prevalent in Bihar, with 64% of girls married below the legal age of 18 and a mean marriage age for girls of 17.6 years. View evidence ↗
- Contraceptive use in Bihar increased from 23.5% to 34.1% by 2005–06. View evidence ↗
- The unmet need for family planning in Bihar was estimated at 23.1% in 2005–06 (NFHS-3) and 37.2% in 2007–08 (DLHS-3). View evidence ↗
- Bihar's overall Contraceptive Prevalence Rate (CPR) of 34.1% is lower than India's overall CPR of 56.3%. View evidence ↗
- The wanted total fertility rate in Bihar (2.4) is lower than its actual fertility rate, but still higher than the national wanted fertility rate (1.9). View evidence ↗
- Reasons for not using contraception in Bihar include opposition (30% vs 15% in India) and method-related fears or costs (27% vs 12% in India). View evidence ↗
What it means
- The authors conclude that rapid population growth stresses resources and contributes to low living standards and forced migration due to job shortages. View evidence ↗
- The authors state that the high fertility is caused by both supply-side issues (access and quality of care) and demand-side issues (opposition to contraception and gender inequality). View evidence ↗
Visual summary
2 visualsIllustrations explain the paper; charts are replotted from the paper's own table values.
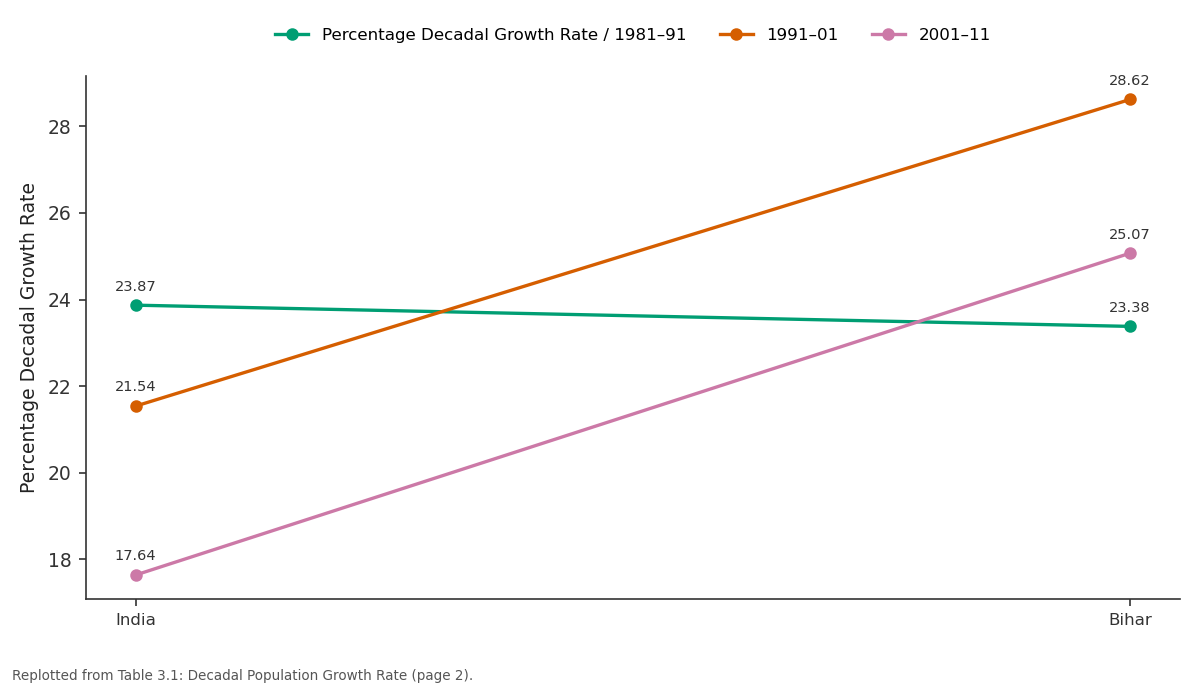
Percentage Decadal Growth Rate / 1981–91 and 1991–01 and more: India vs Bihar
Replotted from Table 3 (page 2) of the original paper. Every bar is the paper's own table value.
View source evidence ↗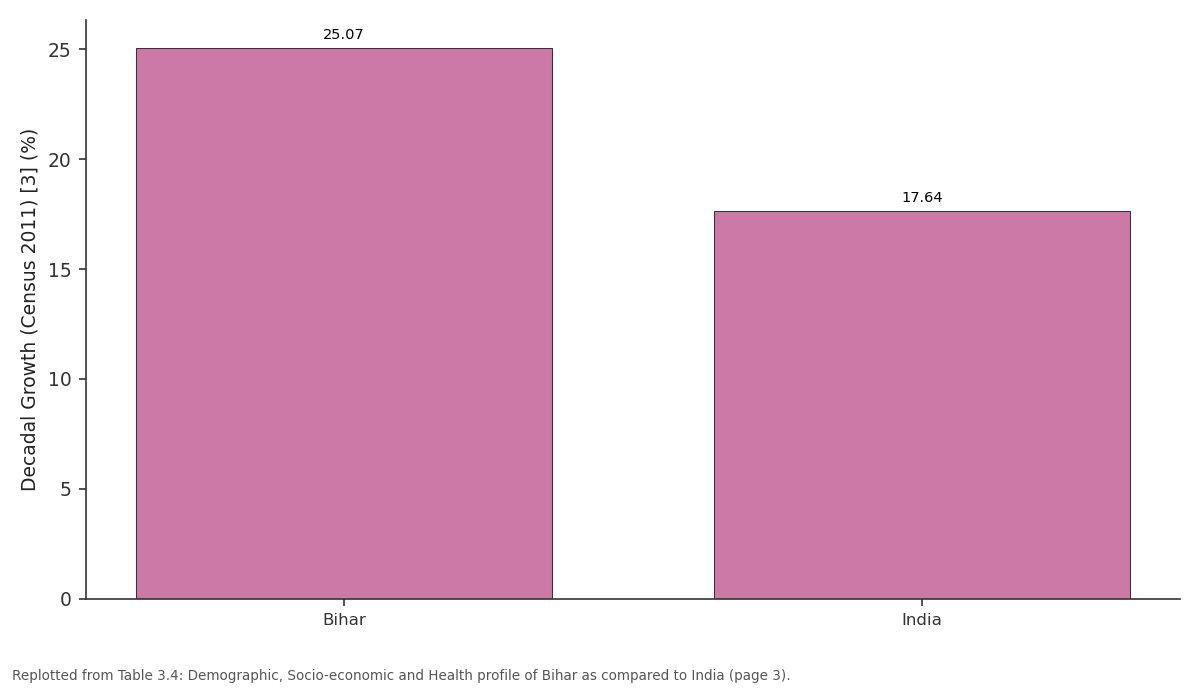
Decadal Growth (Census 2011) [3] (%): Bihar vs India
Replotted from Table 3 (page 3) of the original paper. Every bar is the paper's own table value.
View source evidence ↗Figures & tables
From the original paper Table 3
 Table 3
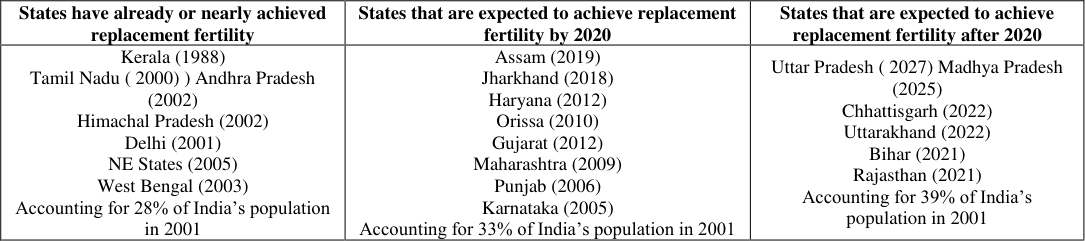 Table 3
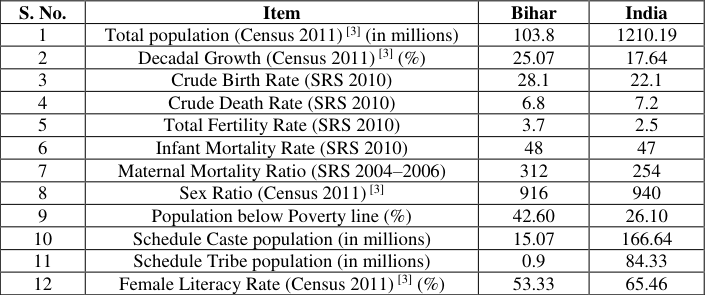 Table 3
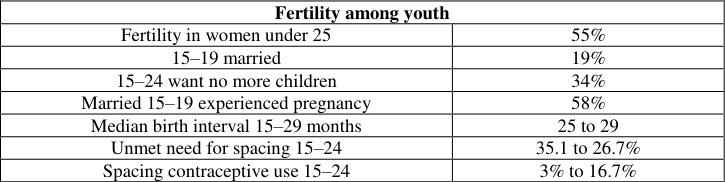 Table 3
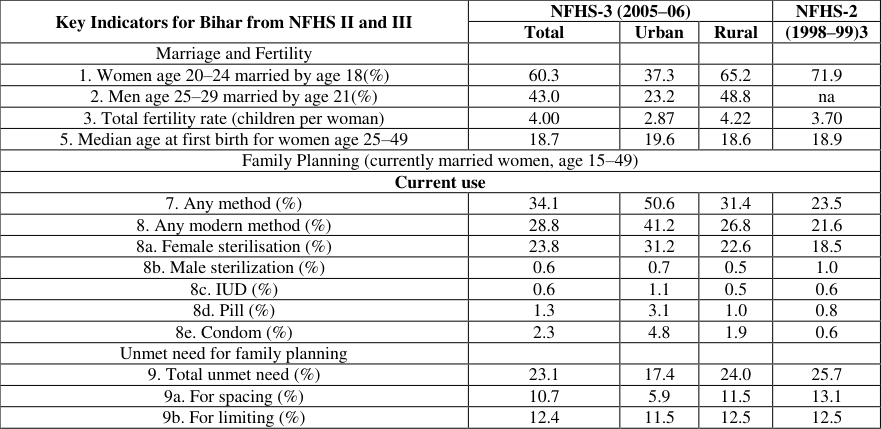 Table 3
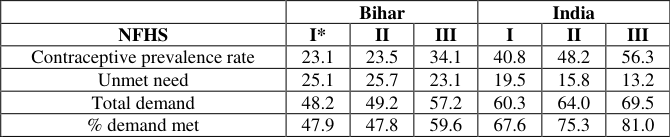 Table 3
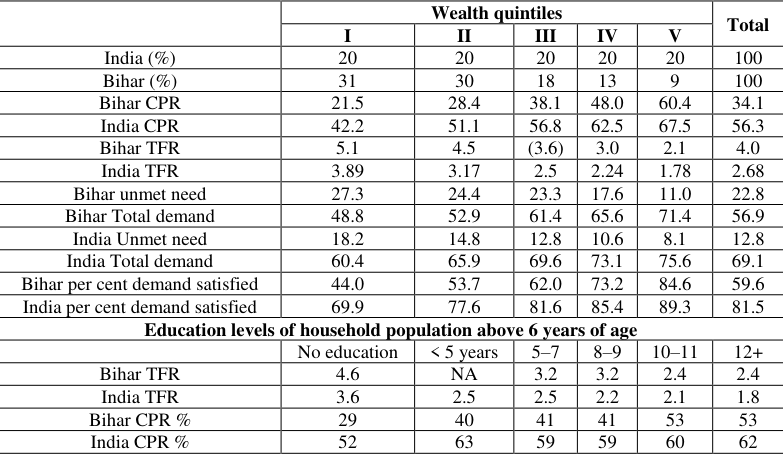 Table 3
 Table 3
 Table 3
Introduction
The chapter describes the status of the population policies and family planning programmes in Bihar that would accelerate progress towards population stabilisation. It has largely relied upon the various secondary sources including government reports, policy papers related to health, population policy and programmes; literature review and desk research. However, information was also gathered about health, population and the reproductive health scenario in Bihar through discussions with different stakeholders like Government officials, Bihar State Health Society, Public Health Resource Network, Donor agencies, Non Governmental Organisations (NGOs) and individuals.
(Population and development profile of Bihar)
The state of Bihar is situated in the eastern part of India (Graph 3.1). About 2.97 per cent of India, it covers an area of 94,163 sq. km. As per the provisional population Census of India (2011) [3] , 5 the State had a population of 103.8 million (males: 54.18 million and females: 49.62 million). The rural and urban population comprises 88.70 per cent and 11.30 per cent respectively implying a high population density at 1102 persons per sq. km compared to a national figure of 382 persons per sq. km (Provisional Census, 2011) [3] . In population, Bihar is the third largest state (having 8.58% population of India) next to Uttar Pradesh and Maharashtra (Census of India, 2011) [3] . The Sex Ratio in the State is 9166 as compared to 940 for the country, and the child sex ratio is 933 as compared to the national average of 944.
Map of Bihar
The population in Bihar has been growing rapidly during the decade 2001-2011 at 25.07 per cent compared to India as a whole at 17.64 per cent (Table 2.1). The population nearly doubled in thirty years from 1981 to 2011 (Graph 3.3). Millions more will join this cohort each year. The Group also estimated that under the current trends, it would take at least 25 years for the use of contraception, female age at marriage, unmet need for contraception, ideal family size and regular exposure to mass media to reach respective levels required to attain replacement-level fertility in Bihar (Table 3.2). At current levels, it may take several more decades to stabilise the population.
| Reason for non-use | Bihar | India |
|---|---|---|
| Fertility related (infecund, breastfeeding, menopausal, etc.) | 32 | 67 |
| Opposition to use (self, husband, religious, social, etc.) | 30 | 15 |
| Method related (fear of side effects, cost and access, etc.) | 27 | 12 |
| Other | 11 | 6 |
| Total | 100* | 100* |
Table text extracted from the original PDF; superscript letters are shown inline. The original table image is below.
View original table image
| — | Wealth quintiles | — | — | — | — | Total |
|---|---|---|---|---|---|---|
| I | II | III | IV | V | ||
| Bihar TFR | 5.1 | 4.5 | 3.6 | 3.0 | 2.1 | 4.0 |
| India TFR | 3.9 | 3.2 | 2.6 | 2.2 | 1.8 | 2.7 |
| Bihar wanted TFR | 2.8 | 2.7 | 2.1 | 2.1 | 1.7 | 2.4 |
| India wanted TFR | 2.4 | 2.1 | 1.8 | 1.7 | 1.5 | 1.9 |
Table text extracted from the original PDF; superscript letters are shown inline. The original table image is below.
View original table image
| — | Wealth quintiles | — | — | — | — | Total |
|---|---|---|---|---|---|---|
| I | II | III | IV | V | ||
| India (%) | 20 | 20 | 20 | 20 | 20 | 100 |
| Bihar (%) | 31 | 30 | 18 | 13 | 9 | 100 |
| Bihar CPR | 21.5 | 28.4 | 38.1 | 48.0 | 60.4 | 34.1 |
| India CPR | 42.2 | 51.1 | 56.8 | 62.5 | 67.5 | 56.3 |
| Bihar TFR | 5.1 | 4.5 | (3.6) | 3.0 | 2.1 | 4.0 |
| India TFR | 3.89 | 3.17 | 2.5 | 2.24 | 1.78 | 2.68 |
| Bihar unmet need | 27.3 | 24.4 | 23.3 | 17.6 | 11.0 | 22.8 |
| Bihar Total demand | 48.8 | 52.9 | 61.4 | 65.6 | 71.4 | 56.9 |
| India Unmet need | 18.2 | 14.8 | 12.8 | 10.6 | 8.1 | 12.8 |
| India Total demand | 60.4 | 65.9 | 69.6 | 73.1 | 75.6 | 69.1 |
| Bihar per cent demand satisfied | 44.0 | 53.7 | 62.0 | 73.2 | 84.6 | 59.6 |
| India per cent demand satisfied | 69.9 | 77.6 | 81.6 | 85.4 | 89.3 | 81.5 |
| Education levels of household population above 6 years of age | ||||||
| No education | < 5 years | 5–7 | 8–9 | 10–11 | 12+ | |
| Bihar TFR | 4.6 | NA | 3.2 | 3.2 | 2.4 | 2.4 |
| India TFR | 3.6 | 2.5 | 2.5 | 2.2 | 2.1 | 1.8 |
| Bihar CPR % | 29 | 40 | 41 | 41 | 53 | 53 |
| India CPR % | 52 | 63 | 59 | 59 | 60 | 62 |
Table text extracted from the original PDF; superscript letters are shown inline. The original table image is below.
View original table image
| — | Bihar | — | — | India | — | — |
|---|---|---|---|---|---|---|
| NFHS | I* | II | III | I | II | III |
| Contraceptive prevalence rate | 23.1 | 23.5 | 34.1 | 40.8 | 48.2 | 56.3 |
| Unmet need | 25.1 | 25.7 | 23.1 | 19.5 | 15.8 | 13.2 |
| Total demand | 48.2 | 49.2 | 57.2 | 60.3 | 64.0 | 69.5 |
| % demand met | 47.9 | 47.8 | 59.6 | 67.6 | 75.3 | 81.0 |
Table text extracted from the original PDF; superscript letters are shown inline. The original table image is below.
View original table image
| Key Indicators for Bihar from NFHS II and III | NFHS-3 (2005–06) | — | — | NFHS-2 |
|---|---|---|---|---|
| Total | Urban | Rural | (1998–99)3 | |
| Marriage and Fertility | ||||
| 1. Women age 20–24 married by age 18(%) | 60.3 | 37.3 | 65.2 | 71.9 |
| 2. Men age 25–29 married by age 21(%) | 43.0 | 23.2 | 48.8 | na |
| 3. Total fertility rate (children per woman) | 4.00 | 2.87 | 4.22 | 3.70 |
| 5. Median age at first birth for women age 25–49 | 18.7 | 19.6 | 18.6 | 18.9 |
| Family Planning (currently married women, age 15–49) | ||||
| Current use | ||||
| 7. Any method (%) | 34.1 | 50.6 | 31.4 | 23.5 |
| 8. Any modern method (%) | 28.8 | 41.2 | 26.8 | 21.6 |
| 8a. Female sterilisation (%) | 23.8 | 31.2 | 22.6 | 18.5 |
| 8b. Male sterilization (%) | 0.6 | 0.7 | 0.5 | 1.0 |
| 8c. IUD (%) | 0.6 | 1.1 | 0.5 | 0.6 |
| 8d. Pill (%) | 1.3 | 3.1 | 1.0 | 0.8 |
| 8e. Condom (%) | 2.3 | 4.8 | 1.9 | 0.6 |
| Unmet need for family planning | ||||
| 9. Total unmet need (%) | 23.1 | 17.4 | 24.0 | 25.7 |
| 9a. For spacing (%) | 10.7 | 5.9 | 11.5 | 13.1 |
| 9b. For limiting (%) | 12.4 | 11.5 | 12.5 | 12.5 |
Table text extracted from the original PDF; superscript letters are shown inline. The original table image is below.
View original table image
| Fertility among youth | — |
|---|---|
| Fertility in women under 25 | 55% |
| 15–19 married | 19% |
| 15–24 want no more children | 34% |
| Married 15–19 experienced pregnancy | 58% |
| Median birth interval 15–29 months | 25 to 29 |
| Unmet need for spacing 15–24 | 35.1 to 26.7% |
| Spacing contraceptive use 15–24 | 3% to 16.7% |
Table text extracted from the original PDF; superscript letters are shown inline. The original table image is below.
View original table image
| S. No. | Item | Bihar | India |
|---|---|---|---|
| 1 | Total population (Census 2011) [3] (in millions) | 103.8 | 1210.19 |
| 2 | Decadal Growth (Census 2011) [3] (%) | 25.07 | 17.64 |
| 3 | Crude Birth Rate (SRS 2010) | 28.1 | 22.1 |
| 4 | Crude Death Rate (SRS 2010) | 6.8 | 7.2 |
| 5 | Total Fertility Rate (SRS 2010) | 3.7 | 2.5 |
| 6 | Infant Mortality Rate (SRS 2010) | 48 | 47 |
| 7 | Maternal Mortality Ratio (SRS 2004–2006) | 312 | 254 |
| 8 | Sex Ratio (Census 2011) [3] | 916 | 940 |
| 9 | Population below Poverty line (%) | 42.60 | 26.10 |
| 10 | Schedule Caste population (in millions) | 15.07 | 166.64 |
| 11 | Schedule Tribe population (in millions) | 0.9 | 84.33 |
| 12 | Female Literacy Rate (Census 2011) [3] (%) | 53.33 | 65.46 |
Table text extracted from the original PDF; superscript letters are shown inline. The original table image is below.
View original table image
| State | Projected growth rate 2008–11 (%) | Projected population growth | — | — | Total fertility rate | — |
|---|---|---|---|---|---|---|
| % growth | (millions) | % share | 2011 | 2021 | ||
| Bihar | 1.5 | 37.2 | 30.85 | 8.3 | 3.0 | 2.2 |
| India | 1.4 | 36.1 | 371.23 | 100.0 | 2.5 | 2.1 |
Table text extracted from the original PDF; superscript letters are shown inline. The original table image is below.
View original table image
| SL | India/ State | Percentage Decadal Growth Rate | — | — | Sex-Ratio (Females/1000 Males) | — | — | Population Density per sq. km. | — | — |
|---|---|---|---|---|---|---|---|---|---|---|
| 1981–91 | 1991–01 | 2001–11 | 1991 | 2001 | 2001 | 1991 | 2001* | 2011 | ||
| 1. | India | 23.87 | 21.54 | 17.64 | 927 | 933 | 940 | 267 | 324 | 368 |
| 2. | Bihar | 23.38 | 28.62 | 25.07 | 907 | 921 | 916 | 685 | 881 | 1102 |
Table text extracted from the original PDF; superscript letters are shown inline. The original table image is below.
View original table image
Considering the age structure and population distribution (according to Census 2011) [3] where 0-6 years constitutes the highest proportion (17.9 per cent) of the state's total population, concentration of population in this age group also implies that the fertility transition in Bihar is much slower. There is considerable demographic diversity in India (Table 3.3). While some states accounting for 61 per cent of the total population have achieved or are close to achieving replacement level fertility, others with 39 per cent of the population will still take many more years. The society places high emphasis on fertility with enormous social pressures, particularly on the youth, to bear children immediately after marriage. This is a serious concern in the state that needs to be immediately addressed (Table 3.5). In such a society and with such social pressure, many young people do not consider the possibility of delaying first child. However, some young people want to delay child bearing, but do not know how to do so. It is difficult for newly wed couples to translate intent into practice because of various NFHS-3 results indicate that son preference in Bihar is strong. Thirty-nine per cent of women and men want more sons than daughters in Bihar. On the other hand, only 1-2 per cent want more daughters than sons. The vast majority of 88 per cent of women want at least one son and 85 per cent want at least one daughter. The desire for more children is strongly affected by the number of sons a woman has. Among women with two children, 68 per cent of women with one son and 77 per cent of women with two sons want no more children, compared with only 20 per cent of women with two daughters and no sons. In India, among women with two living children, 62 per cent of women with two daughters and no sons do not want any more children. More than half of the young boys and nearly three-fourth of the young girls are not enrolled in primary schools even today. The overall literacy rate in Bihar is only 63.82 per cent (male: 73.39, female: 53.33)9 as compared to 74.04 per cent for India and the disparity is even wider for female literacy with 53.33 per cent and 65.46 per cent for Bihar and India respectively. The State indicators demonstrate substantially lower status of women in India. Only 22 per cent of the women reported making autonomous decisions about their own health care and 30 per cent reported having made decisions about the purchase of daily household needs (NFHS-3). Less than one in 10 women said that they could make the decision to visit their family or relatives.
Family Planning Status: Current Use and Unmet Need
The percentage of married women using contraception in India has increased from a level of just over 10 per cent in the early 1970s to 48 per cent in 1998-99, and to 53 per cent by 2004 (all India). Considering the logistical problems of supplying information and services to more than 250 million women of reproductive age, this increase is a remarkable achievement. Surveys have repeatedly shown that women's knowledge aboutcontraception is nearly universal. Female sterilisation remains the most common method of family planning. As mentioned earlier, for the first time in recent decades, the 2001 Census has registered a fall in the growth rate of population below two per cent, indicating that the decline in the birth rate has begun to overtake the decline in the death rate. In the early 1970s, less than 15 per cent of the deliveries were occurring in institutions. It has increased from 12.1 per cent (1992-93) to 22 per cent (2005-06) to 27.7 per cent (2007-08) to 47.9 per cent (CES, 2008). This increase in institutional delivery since 2005-06 is largely due to the conditional cash transfer scheme (Janani Suraksha Yojana). National Family Health Surveys (NFHS) surveys show that there was little change in contraceptive use for all methods between NFHS-1 (1992-93) and NFHS-2 (1998-99) in Bihar. However, contraceptive use for all methods increased from 23.5 per cent to 34.1 per cent by 2005-06 (Table 3.6). The unmet need declined from 25.7 per cent to 23.1 per cent showing that total demand for family planning had increased from 49.2 per cent to 57.2 per cent. Nevertheless, contraceptive use in the state is characterised by the predominance of non-reversible methods, limited use of currently male/couple-dependent methods, substantial levels of discontinuation, negligible use of contraceptives among both married and unmarried adolescents and wide district level variations. Even per cent of currently married women (15-44 years) using female sterilisation is lower in Bihar in comparison to other states (Graph 3.9). of high level of unmet need for contraception for limiting of the family size and spacing between childbirths in Bihar state is validated by data from both NFHS and DLHS. It would be a mistake to assume that inadequate access to services should be the dominant, or even a major, explanatory factor for its presence. Total unmet need for family planning according to NFHS-3 (2005-06) was 23.1 and DLHS-3 (2007-08), using a different methodology estimated it to be 37.2 per cent (Graph 3.10). One in three to four women in the state had unmet need for family planning. Unmet need for limiting has increased in the state, which is a poor reflection of availability of services and service provisions, especially when majority of clients depend on public health services in the state. Total unmet need is highest among the younger women and women of lower parity, particularly for spacing. It is important to address the unmet need for contraception, particularly for spacing by providing access to safe, effective and reversible methods. To do so it may be necessary to expand the basket of contraceptive choices. Social marketing of contraceptives and availability of the range of methods would help to meet the needs of couples who are not ready to accept sterilisation. Peripheral health workers, auxiliary nursemidwives (ANMs) and Accredited Social Health Activists (ASHAs) should identify women with unmet need for contraception and address their concerns so that unwanted pregnancies could be avoided. Unmet need declined in India over time but not so in Bihar. Total demand for Family Planning (FP) is much higher in India compared to Bihar but it increased significantly between NFHS 2 and 3. Only 59.6 per cent demand is satisfied in Bihar compared to 81 per cent for India as a whole. Later in this section, reasons for high unmet need in Bihar are discussed. Bihar is much poorer than India on the whole as can be seen by the proportion of households in different wealth quintiles (Table 3.8). As expected, Total Fertility Rate (TFR) decreases, CPR increases, unmet need decreases and per cent demand met increases as households become wealthier. However, it is very difficult to disentangle the effect of the socio-economic development and family planning programme on fertility. Bihar's CPR is lower than India's and TFR is higher than India's for each wealth quintile. The total demand for FP in Bihar for each wealth quintile is also lower than India. If the contraceptive use and fertility of persons in each wealth quintile household in Bihar was same as in India then wealth adjusted CPR and TFR for Bihar would be 52.8 and 3.07. If for each wealth quintile, the same proportion of FP demand was met in Bihar as in India, then the CPR would be 44.9; 10.8 per cent more than current CPR of 34.1 which is nearly half the difference between India's and Bihar's CPR. Similar is the situation with respect to education levels of women. This demonstrates that the wanted fertility is lower than current fertility and higher than replacement fertility, while the unmet need for contraception is high. Reasons for nonuse of contraception in future for those with unmet need are related to fertility, opposition to use and FP method-related. It is both a supply problem in terms of access, availability and quality of care for family planning services and a demand problem because of opposition to use of contraception and gender inequalities which require behavioural change communication and changes in socioeconomic correlates of fertility (Table 3.10).
Conclusion
Rapid growth in population leads stress on existing resources. People of Bihar have low living standard. There is lack of jobs that force the people to migrate from the state in search of livelihood.
References
19 in the original paper- Ashford LS. New Population Policies: Advancing Women's Health and Rights, Population Bulletin, PRB 2001, 56(l).
- Ahmad E. Bihar: A Physical, Economics and Regional Geography, Ranchi 1965.
- Late) Agrawala SN, Sinha UP. India Population Problems, Tata McGraw-Hill Publishing Company, Limited, New Delhi 1985, 58-59.
- Agrawala SN. Population, National Book Trust, Bombay 1967, 61-67.
- Axinn George H. The Role of Education in Rural Development, Stimulator or Oppressor in G. Singh and J.H. Dc Goedeeds, Rural Development Technology, An Integrated Approach Bangkok A.I.T 1977, 487-503.
- Government of India. Central Calling, March, Department of Family Welfare 1978.
- Yearbook Ministry of Health and Family Welfare 1982, 1980-81.
- India. Publication Division. Ministry of Information and Broadcasting, Government of India 2009.
- International Institute for Population Sciences (IIPS), Mumbai & ORC Macro. National Family Health Survey (NFHS-III) 2006, 2005-2006.
- International Institute for Population Sciences (IIPS), Mumbai. Reproductive and Child Health-District Level Household Survey (RCH-DLHS) 2006, 2006-2008.
- International Institute for Population Sciences (IIPS) & Population Council. Youth in India: Situation and Needs 2006-2007, Executive Summary, Bihar. Mumbai: IIPS 2009.
- International Institute for Population Sciences (IIPS) & Population Council. Youth in India: Situation and Needs 2006-2007, Key Indicators, Bihar. Mumbai: IIPS 2008.
- Jejeebhoy SJ. Sexual and Reproductive Health among Youth in Bihar and Jharkhand: An Overview, Economic and Political Weekly 2007; 42(48):34-39. 16. Ministry of Health and Family Welfare. Implementation Guide on RCH II: Adolescent Reproductive Sexual health Strategy for State and District Programme Managers, Government of India, viewed 21 August 2006-2012.
- Population Council. Shaping Demand and Practices to Improve Family Health Outcomes in Bihar: Final Survey Report, Edited by ME Khan, France Donnay, Usha Kiran Tarigopula and Kumudha Aruldas 2012.
- Population, Health and Social Development in Bihar, Jharkhand, Orissa and West Bengal, Population Foundation of India, New Delhi 2010.
- Population Stabilization for the Eleventh Five Year Plan. Planning Commission, Government of India 2007-2012.
- Registrar General of India. Sample Registration System, SRS Bulletin 2011, 46(1).
- Report of the working group on population stabilisation for the Eleventh Five Year Plan, Planning Commission. Government of India, New Delhi 2007-2012.
- Wadia AB. The Family Planning Programme in India: The Non-governmental Sector the Journal of Family Welfare 1984, 30(4).
Cited by 1
From OpenAlex, OpenCitations and reference lists read by Scinovex
- Geographical analysis of regional disparities in population density in the context of rural development in Barabanki district
Pramod Kumar, Sadhana Rani · International Journal of Geography Geology and Environment · 2026
This research paper presents a comprehensive geographical and statistical analysis of regional disparities in population density with special reference to rural development in Barabanki district, situated in the Awadh Plain of Uttar Pradesh. To understand the dynamics of rural development, the spatial configuration of population density is examined in correlation with three primary socio-economic indicators: Literacy Rate (%), Non-agricultural Workers (%), and Main Workers (%). This study is entirely based on secondary data sourced from the Census of India and the District Statistical Handbook