
Research article · 2020 · Full text
International Journal of Statistics and Applied MathematicsConfidence intervals for difference of signal-to-noise ratios of two-parameter exponential distributions
Volume 5(3) · Pages 47–54
Research areasStatistical Distribution Estimation and ApplicationsStatistical Methods and Bayesian InferenceAdvanced Statistical Process Monitoring
Abstract
Author-writtenCoefficient of variation is the standard deviation divided by the mean. It is a measure of relative variability in different units. Signal-to-noise ratio (SNR) is the reciprocal of coefficient of variation. It is the ratio of mean to standard deviation of measurement. The SNR is extensively used in many application fields. Exponential distribution describes the lengths of the inter-arrival times in a homogeneous Poisson process. For positively skewed data, the exponential distribution is as important as the normal distribution in sampling theory and statistics. Two-parameter exponential distribution has an important role in medical sciences and life testing. For two populations, the difference of SNRs of two-parameter exponential distributions is interesting. In this paper, the problem of constructing confidence intervals for difference of SNRs of two-parameter exponential distributions is considered. Generalized confidence interval (GCI) approach, large sample approach, method of variance estimates recovery (MOVER) approach, and parametric bootstrap (PB) approach are applied to construct the confidence intervals. Based on the simulation study, the results indicated that the coverage probability of the GCI approach does not depend on difference of SNRs, but the coverage probability is around the nominal confidence level of 0.95. The large sample and MOVER approaches provide the conservative confidence intervals when the value of 0 is large. The PB approach provides better in term of coverage probability. As a result, the PB approach is recommended to construct the confidence intervals for the difference of SNRs. The proposed approaches are illustrated using a real data set from medical science.
Summary
Source-checkedPlain-language reading of the full paper, prepared with AI and checked against the text. Each point links to the authors' own words.
Why it matters
- The signal-to-noise ratio (SNR), defined as the ratio of the mean to the standard deviation, is a widely used measure of relative variability across various fields. View evidence ↗
- The two-parameter exponential distribution is particularly significant for applications in life testing and medical sciences. View evidence ↗
The question
- The study aims to extend existing research by developing methods to construct confidence intervals for the difference of SNRs between two populations following two-parameter exponential distributions. View evidence ↗
What they did
- Four distinct statistical approaches were used to construct the confidence intervals: Generalized Confidence Interval (GCI), Large Sample (LS), Method of Variance Estimates Recovery (MOVER), and Parametric Bootstrap (PB). View evidence ↗
- The performance of the intervals was evaluated using 5,000 simulation runs and 2,500 generalized pivotal quantities. View evidence ↗
What they found
- The GCI approach produced coverage probabilities around the nominal 0.95 level, regardless of the difference between the SNRs. View evidence ↗
- When the difference of SNRs (θ) is large, the Large Sample and MOVER approaches tend to produce conservative confidence intervals. View evidence ↗
- The Parametric Bootstrap (PB) approach demonstrated superior performance regarding coverage probability. View evidence ↗
- The GCI approach produced the narrowest average interval lengths compared to the LS, MOVER, and PB methods. View evidence ↗
What it means
- The authors recommend the Parametric Bootstrap (PB) approach for constructing confidence intervals for the difference of SNRs due to its satisfactory performance. View evidence ↗
Visual summary
2 visualsIllustrations explain the paper; charts are replotted from the paper's own table values.
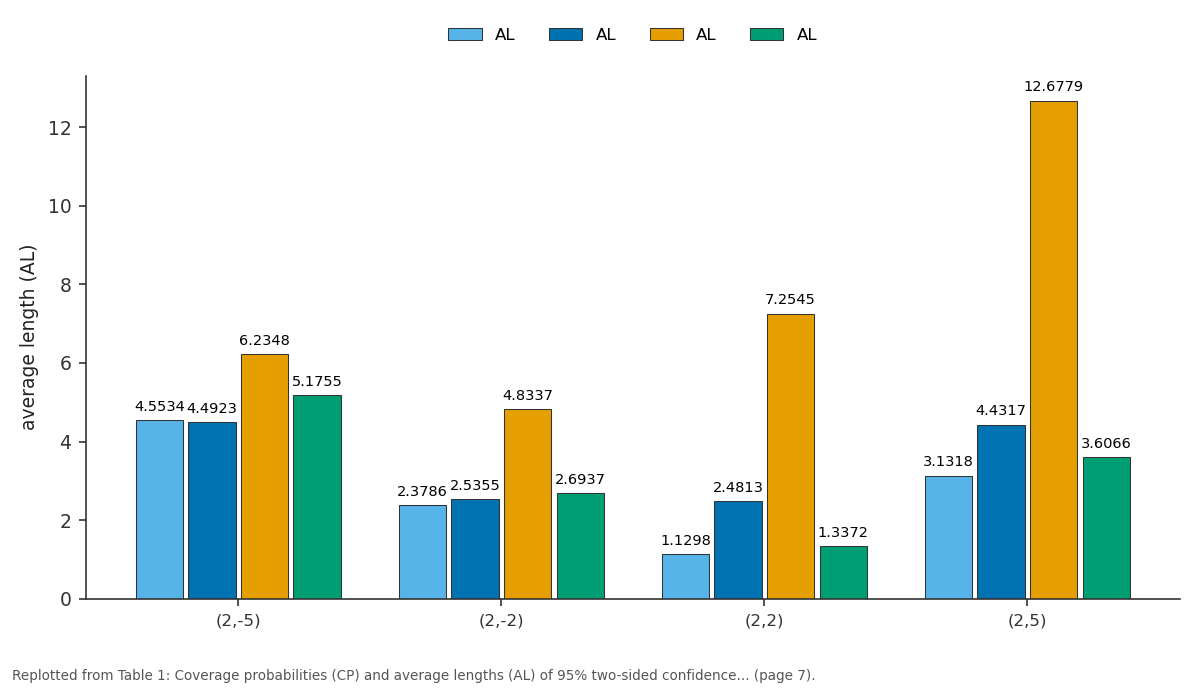
AL and AL and more: (2,-5) vs (2,-2) vs (2,2) vs (2,5)
Replotted from Table 1 (page 7) of the original paper. Every bar is the paper's own table value.
View source evidence ↗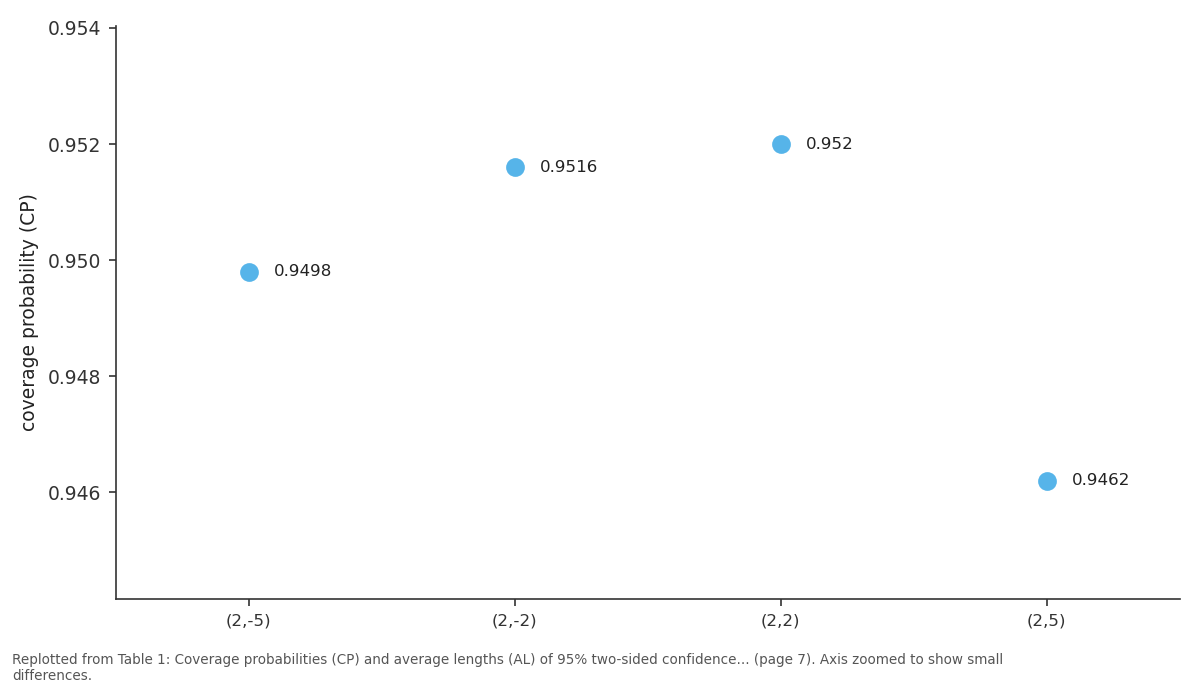
GCI / CP: (2,-5) vs (2,-2) vs (2,2) vs (2,5)
Replotted from Table 1 (page 7) of the original paper. Every bar is the paper's own table value.
View source evidence ↗Figures & tables
From the original paper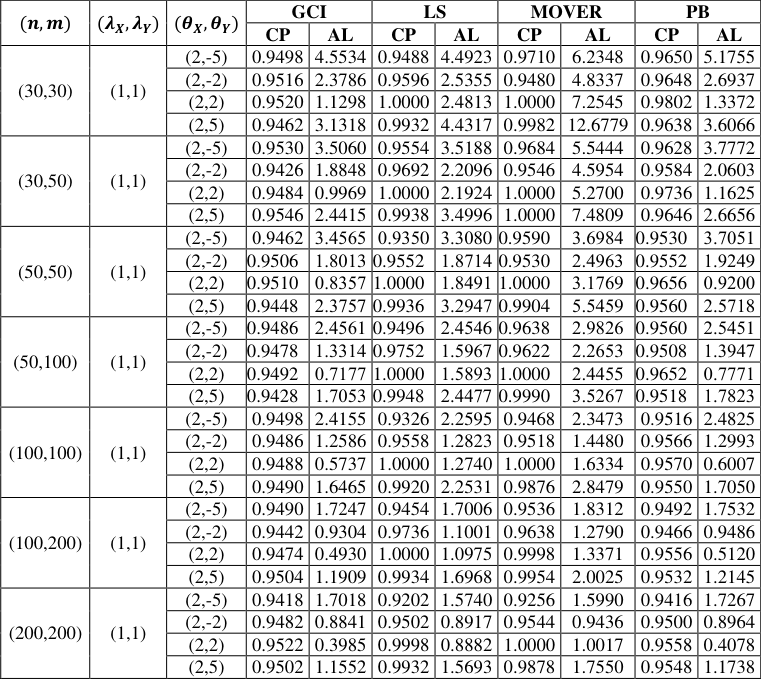 Table 1
Introduction
Two-parameter exponential distribution is used in applied statistics. For instance, Lawless JF (1977) [1] analyzed lifetime data to predict the confidence intervals for the two-parameter exponential distribution. Baten A & Kamil A (2009) [2] considered inventory management systems with hazardous items of two-parameter exponential distribution. Petropoulos C (2011) [3] proposed new classes of improved confidence intervals for the scale parameter of twoparameter exponential distribution. Jiang L & Wong ACM (2012) [4] presented interval estimations for the scale parameter of two-parameter exponential distribution. Thangjai W & Niwitpong S (2017) [5] proposed new confidence intervals for the weighted coefficients of variation of two-parameter exponential distributions. Saothayanun L & Thangjai W (2018) [6] constructed the confidence intervals for the signal-to-noise ratio (SNR) of two-parameter exponential distribution. Thangjai W et al. (2018) [7] suggested the simultaneous confidence intervals for the differences of means of several two-parameter exponential distributions. Thangjai W & Niwitpong S (2020) [8] proposed the simultaneous confidence intervals for the differences of coefficients of variation of two-parameter exponential distributions. Standard deviation is used dispersion measures in statistics. The standard deviation is not the most appropriate indicator when the dispersion of distributions of several variables is compared. Coefficient of variation is widely used rather than the standard deviation. Inverse of the coefficient of variation is called the SNR. The SNR is commonly used in finance and image processing. In the literature, many studies had discussed about the SNR. For more detailed inference of the SNR, see Sharma KK & Krishna H (1994) [9] , George F & Kibria BMG (2012) [10] , Albatineh AN et al. (2014) [11] , Albatineh AN et al. (2017) [12] , Saothayanun L & Thangjai W (2018) [6] , Niwitpong S (2018) [13] , Thangjai W & Niwitpong S (2019) [14] , Thangjai W & Niwitpong S (2019) [15] , and Thangjai W & Niwitpong S (2020) [16] . The literature on the SNR of two-parameter exponential distribution is limited. Saothayanun L & Thangjai W (2018) [6] studied the confidence intervals for the SNR in one population. The objective of this paper is extend the confidence intervals to two populations. The confidence intervals for the difference of SNRs of two-parameter exponential distributions are considered using the generalized confidence interval (GCI) approach, the large sample approach, the method of variance estimates recovery (MOVER) approach, and the parametric bootstrap (PB) approach.
Methods
Suppose that two independent random variables ) , , , (
, respectively. Also, the variances of X and Y are The difference of SNRs of two-parameter exponential distributions can be written as
An estimator of has the following form
According to Saothayanun L & Thangjai W (2018) [6] , the variances of
are independent, the variance of difference of SNRs has the following form
Generalized Confidence Interval
Roy A & Mathew T (2005) [17] proposed the following pivots of X and X
Large Sample Confidence Interval
Again, let ˆ be the difference of SNRs of two-parameter exponential distributions. Also, let ) , , , (
MOVER Confidence Interval
Using the concept of Saothayanun L & Thangjai W (2018) [6] , lower limit and upper limit for
Similarly, the lower limit and the upper limit for
According to the research paper of Donner A & Zou GY ( 2010) [18] , the lower limit and the upper limit for are
For replicate 𝐵 times, there are totally 𝐵 estimates of the difference of SNRs 𝜃 * from 𝐵 bootstrap sample. The sampling distribution is constructed with these 𝐵 bootstrap statistics. The distribution is used to make the confidence interval for the difference of SNRs. Therefore, the
Simulation Study
In this section, a simulation is performed to compare the proposed approaches for constructing confidence intervals of difference of signal-to-noise ratios (SNRs). Monte Carlo simulation study is performed using the R statistical package to evaluate the performance of the confidence intervals for difference of SNRs. The 95% confidence intervals based on the generalized confidence interval (GCI) approach, the large sample approach, the method of variance estimates recovery (MOVER) approach, and the parametric bootstrap (PB) approach are compared. The data are generated from two-parameter exponential distributions, denoted as (2,2), and (2,5). The 5,000 simulation runs and 2,500 generalized pivotal quantities are used. The coverage probabilities and average lengths of the confidence intervals for difference of coefficients of variation can be calculated by the following algorithm.
Algorithm 1.
For a given 𝑛, 𝑚, 𝜆 𝑋 , 𝜆 𝑌 , 𝛽 𝑋 , 𝛽 𝑌 , 𝜃 𝑋 , 𝜃 𝑌 , and 𝜃
Step 1: Generate 𝑥 from two-parameter exponential distribution with 𝜆 𝑋 and 𝛽 𝑋
Step 2: Generate 𝑦 from two-parameter exponential distribution with 𝜆 𝑌 and 𝛽 𝑌 3: Calculate 𝑥̅ , 𝑥 (1) , 𝑦 ̅, and 𝑦 (1)
Step 4: Compute 𝐿 𝜃.𝐺𝐶𝐼(ℎ) and 𝑈 𝜃.𝐺𝐶𝐼(ℎ)
Step 5: Compute 𝐿 𝜃.𝐿𝑆(ℎ) and 𝑈 𝜃.𝐿𝑆(ℎ)
Step 6: Compute 𝐿 𝜃.𝑀𝑂𝑉𝐸𝑅(ℎ) and 𝑈 𝜃.𝑀𝑂𝑉𝐸𝑅(ℎ)
Step 7: Compute 𝐿 𝜃.𝑃𝐵(ℎ) and 𝑈 𝜃.𝑃𝐵(ℎ)
Step 10: Repeat the step 1 -step 9 for a large number of times (say, M times) and calculate coverage probability and average length
Results and Discussion
The coverage probabilities and average lengths of the confidence intervals for difference of SNRs are shown in Table 1 and Figures 1234. The results indicate that the coverage probabilities of the GCI approach are less than and greater than the nominal confidence level of 0.95 in some cases. The coverage probability of the GCI approach does not depend on difference of SNRs
| (𝒏, 𝒎) | (𝝀 , 𝝀 ) 𝑿 𝒀 | (𝜽 , 𝜽 ) 𝑿 𝒀 | GCI | — | LS | — | MOVER | — | PB | — |
|---|---|---|---|---|---|---|---|---|---|---|
| CP | AL | CP | AL | CP | AL | CP | AL | |||
| (30,30) | (1,1) | (2,-5) | 0.9498 | 4.5534 | 0.9488 | 4.4923 | 0.9710 | 6.2348 | 0.9650 | 5.1755 |
| (2,-2) | 0.9516 | 2.3786 | 0.9596 | 2.5355 | 0.9480 | 4.8337 | 0.9648 | 2.6937 | ||
| (2,2) | 0.9520 | 1.1298 | 1.0000 | 2.4813 | 1.0000 | 7.2545 | 0.9802 | 1.3372 | ||
| (2,5) | 0.9462 | 3.1318 | 0.9932 | 4.4317 | 0.9982 | 12.6779 | 0.9638 | 3.6066 | ||
| (30,50) | (1,1) | (2,-5) | 0.9530 | 3.5060 | 0.9554 | 3.5188 | 0.9684 | 5.5444 | 0.9628 | 3.7772 |
| (2,-2) | 0.9426 | 1.8848 | 0.9692 | 2.2096 | 0.9546 | 4.5954 | 0.9584 | 2.0603 | ||
| (2,2) | 0.9484 | 0.9969 | 1.0000 | 2.1924 | 1.0000 | 5.2700 | 0.9736 | 1.1625 | ||
| (2,5) | 0.9546 | 2.4415 | 0.9938 | 3.4996 | 1.0000 | 7.4809 | 0.9646 | 2.6656 | ||
| (50,50) | (1,1) | (2,-5) | 0.9462 | 3.4565 | 0.9350 | 3.3080 | 0.9590 | 3.6984 | 0.9530 | 3.7051 |
| (2,-2) | 0.9506 | 1.8013 | 0.9552 | 1.8714 | 0.9530 | 2.4963 | 0.9552 | 1.9249 | ||
| (2,2) | 0.9510 | 0.8357 | 1.0000 | 1.8491 | 1.0000 | 3.1769 | 0.9656 | 0.9200 | ||
| (2,5) | 0.9448 | 2.3757 | 0.9936 | 3.2947 | 0.9904 | 5.5459 | 0.9560 | 2.5718 | ||
| (50,100) | (1,1) | (2,-5) | 0.9486 | 2.4561 | 0.9496 | 2.4546 | 0.9638 | 2.9826 | 0.9560 | 2.5451 |
| (2,-2) | 0.9478 | 1.3314 | 0.9752 | 1.5967 | 0.9622 | 2.2653 | 0.9508 | 1.3947 | ||
| (2,2) | 0.9492 | 0.7177 | 1.0000 | 1.5893 | 1.0000 | 2.4455 | 0.9652 | 0.7771 | ||
| (2,5) | 0.9428 | 1.7053 | 0.9948 | 2.4477 | 0.9990 | 3.5267 | 0.9518 | 1.7823 | ||
| (100,100) | (1,1) | (2,-5) | 0.9498 | 2.4155 | 0.9326 | 2.2595 | 0.9468 | 2.3473 | 0.9516 | 2.4825 |
| (2,-2) | 0.9486 | 1.2586 | 0.9558 | 1.2823 | 0.9518 | 1.4480 | 0.9566 | 1.2993 | ||
| (2,2) | 0.9488 | 0.5737 | 1.0000 | 1.2740 | 1.0000 | 1.6334 | 0.9570 | 0.6007 | ||
| (2,5) | 0.9490 | 1.6465 | 0.9920 | 2.2531 | 0.9876 | 2.8479 | 0.9550 | 1.7050 | ||
| (100,200) | (1,1) | (2,-5) | 0.9490 | 1.7247 | 0.9454 | 1.7006 | 0.9536 | 1.8312 | 0.9492 | 1.7532 |
| (2,-2) | 0.9442 | 0.9304 | 0.9736 | 1.1001 | 0.9638 | 1.2790 | 0.9466 | 0.9486 | ||
| (2,2) | 0.9474 | 0.4930 | 1.0000 | 1.0975 | 0.9998 | 1.3371 | 0.9556 | 0.5120 | ||
| (2,5) | 0.9504 | 1.1909 | 0.9934 | 1.6968 | 0.9954 | 2.0025 | 0.9532 | 1.2145 | ||
| (200,200) | (1,1) | (2,-5) | 0.9418 | 1.7018 | 0.9202 | 1.5740 | 0.9256 | 1.5990 | 0.9416 | 1.7267 |
| (2,-2) | 0.9482 | 0.8841 | 0.9502 | 0.8917 | 0.9544 | 0.9436 | 0.9500 | 0.8964 | ||
| (2,2) | 0.9522 | 0.3985 | 0.9998 | 0.8882 | 1.0000 | 1.0017 | 0.9558 | 0.4078 | ||
| (2,5) | 0.9502 | 1.1552 | 0.9932 | 1.5693 | 0.9878 | 1.7550 | 0.9548 | 1.1738 |
Table text extracted from the original PDF; superscript letters are shown inline. The original table image is below.
View original table image
,-5), the large sample approach has coverage probabilities less than the nominal confidence level of 0.95, whereas the MOVER approach has coverage probabilities greater than the nominal confidence level. Nevertheless, the coverage probabilities of the large sample approach and the MOVER approach appear to be conservative for large value of .
Moreover, the coverage probabilities of the PB approach are greater than the nominal confidence level for all cases and they also are stable. The average lengths indicate that the average lengths of the GCI approach are narrower than those of the large sample, MOVER, and PB approaches [19] is used for analysis. The data presents time to relapse of the patients with acute leukemia treated by drug 6-mercaptopurine and placebo. The generalized confidence interval (GCI) approach, the large sample approach, the method of variance estimates recovery (MOVER) approach, and the parametric bootstrap (PB) approach are demonstrated using the data. From the results, all the proposed confidence intervals contain the true difference of SNRs. However, the interval length of the generalized confidence interval is smaller than the interval lengths of other confidence intervals. It is clear that these results confirm our simulation study in term of interval length.
Conclusion
The signal-to-noise ratio (SNR) is applied in many applications. Extending the research paper of Saothayanun L & Thangjai W (2018) [6] , this paper is interested in difference of SNRs of two-parameter exponential distributions. The confidence intervals for the difference of SNRs are proposed based on the generalized confidence interval (GCI) approach, the large sample approach, the method of variance estimates recovery (MOVER) approach, and the parametric bootstrap (PB) approach. The performance of these approaches is investigated using Monte Carlo simulations. The GCI approach uses software package to construct the generalized confidence interval. The large sample approach, the MOVER approach, and the PB approach use formula to estimate the confidence intervals. The results indicated that the coverage probabilities of the PB approach are greater than the nominal confidence level of 0.95 and the performance of the PB approach is satisfactory as compared with other approaches. As a result, the PB approach is recommended for constructing the confidence interval for the difference of SNRs of two-parameter exponential distributions.
Acknowledgement
AcknowledgmentsThis research was funded by Faculty of Applied Science, King Mongkut's University of Technology North Bangkok. Contract No. 6345101. 8. References 1. Lawless JF. Prediction intervals for the two-parameter exponential distribution. Technometrics. 1977; 19:469-472.
References
18 in the original paper- Baten A, Kamil A. Inventory management systems with hazardous items of two-parameter exponential distribution. Journal of Social Sciences. 2009; 5:183-187.
- Petropoulos C. New classes of improved confidence intervals for the scale parameter of two-parameter exponential distribution. Statistical Methodology. 2011; 8:401-410.
- Jiang L, Wong ACM. Interval estimations for the two-parameter exponential distribution. Journal of Probability and Statistics. 2012; 2012:1-8.
- Thangjai W, Niwitpong S. Confidence intervals for the weighted coefficients of variation of two-parameter exponential distributions. Cogent Mathematics. 2017; 4:1-16.
- Saothayanun L, Thangjai W. Confidence intervals for the signal to noise ratio of two-parameter exponential distribution. Studies in Computational Intelligence. 2018; 760:255-265.
- Thangjai W, Niwitpong S, Niwitpong, S. Simultaneous confidence intervals for all differences of means of two-parameter exponential distributions. Studies in Computational Intelligence. 2018; 760:298-308.
- Thangjai W, Niwitpong S. Simultaneous confidence intervals for all differences of coefficients of variation of two-parameter exponential distributions. Thailand Statistician. 2020; 18:135-149.
- Sharma KK, Krishna, H. Asymptotic sampling distribution of inverse coefficient of variation and its applications. IEEE Transactions on Reliability. 1994; 43:630-633.
- George F, Kibria BMG. Confidence intervals for estimating the population signal to noise ratio: a simulation study. Journal of Applied Statistics. 2012; 39:1225-1240.
- Albatineh AN, Kibria BMG, Zogheib B, Asymptotic sampling distribution of inverse coefficient of variation and its applications: Revisited. Journal of Advanced Statistics and Probability. 2014; 2:15-20.
- Albatineh AN, Boubakari I, Kibria BMG. New confidence interval estimator of the signal to noise ratio based on asymptotic sampling distribution. Communications in Statistics -Theory and Methods. 2017; 46:574-590.
- Niwitpong S. Confidence intervals for functions of signal-to-noise ratios of normal distributions. Studies in Computational Intelligence. 2018; 760:196-212.
- Thangjai W, Niwitpong S. Confidence intervals for the signal-to-noise ratio and difference of signal-to-noise ratios of lognormal distribution. Stats. 2019; 2:164-173.
- Thangjai W, Niwitpong S. Confidence intervals for the signal-to-noise ratio and difference of signal-to-noise ratios of gamma distributions. Advance and Applications in Mathematical Sciences. 2019; 18:503-520.
- Thangjai W, Niwitpong S. Confidence intervals for common signal-to-noise ratio of several log-normal distributions. Iranian Journal of Science and Technology, Transactions A: Science. 2020; 44:99-107.
- Roy A, Mathew T. A generalized confidence limit for the reliability function of a two-parameter exponential distribution. Journal of Statistical Planning and Inference. 2005; 128:509-517.
- Donner A, Zou GY. Closed-form confidence intervals for function of the normal mean and standard deviation. Statistical Methods in Medical Research. 2010; 21:347-359.
- Freireich TR, Gehan E, Frei E, Schroeder LR, Wolman IJ, Anbari R et al. The effect of 6-mercaptopurine on the duration of steroid induced remissions in acute leukemia: A model for evaluation of other potentially useful therapy. Blood. 1963; 21:699-716.
Cited by 2
From OpenAlex, OpenCitations and reference lists read by Scinovex
- Confidence intervals for functions of signal-to-noise ratio with application to economics and finance ↗
Warisa Thangjai, Sa‐Aat Niwitpong · Asian Journal of Economics and Banking · 2024
Purpose Confidence intervals play a crucial role in economics and finance, providing a credible range of values for an unknown parameter along with a corresponding level of certainty. Their applications encompass economic forecasting, market research, financial forecasting, econometric analysis, policy analysis, financial reporting, investment decision-making, credit risk assessment and consumer confidence surveys. Signal-to-noise ratio (SNR) finds applications in economics and…
❝ 3PDF - Confidence Intervals of the Inverse of Coefficient of Variation of Delta-Gamma Distribution ↗
Wansiri Khooriphan, Sa‐Aat Niwitpong, Suparat Niwitpong · Lobachevskii Journal of Mathematics · 2023
The inverse of the coefficient of variation (ICV), otherwise known as the signal to-noise ratio, is the ratio of the population standard deviation to the population mean. It has often been used in the fields of finance and image processing, among others. In this study, various methods were applied to estimate the confidence intervals (CIs) for the difference between and…
❝ 0