
Research article · 2020 · Full text
International Journal of Statistics and Applied MathematicsManipulating large-scale data in software reliability studies
Volume 5(4) · Pages 100–102
Research areasSoftware Reliability and Analysis Research
Abstract
Author-writtenAvailability of information is abundant in this modern world due to the developments taking place in this ICT field. Drawing inference from such data requires the development of new methodologies. Dimensionality reduction with less amount of loss of information can be considered as one of the suitable solutions to this issue. This paper proposes a statistical methodology to reduce the dimension of the data with less amount of loss of information. The procedure was hierarchical Clustering method and extraction of principal components analysis. Applications of the methodology are illustrated with a data set.
Summary
Source-checkedPlain-language reading of the full paper, prepared with AI and checked against the text. Each point links to the authors' own words.
Why it matters
- High-dimensional data is difficult to process and analyze, making dimensionality reduction essential for further study. View evidence ↗
- Software reliability is typically analyzed using failure test data. View evidence ↗
- Previous research has identified various environmental factors (EFs), ranging from 26 to 34, as potential indicators for studying software reliability. View evidence ↗
The question
- The study aims to propose a two-stage methodology to reduce data dimensionality while minimizing the loss of information. View evidence ↗
What they did
- Data was collected via questionnaires sent to 85 randomly selected individuals across 14 software development organizations. View evidence ↗
- The respondent group consisted of 13 managers (15%), 25 system engineers (29%), 15 testers (18%), and 32 programmers (38%). View evidence ↗
- The methodology involves first grouping factors into clusters based on similarity, followed by a two-stage Principal Component Analysis (PCA). View evidence ↗
- The first PCA stage extracts intra-cluster components explaining 90% of variation, which then serve as variables for a second inter-cluster PCA stage. View evidence ↗
What they found
- The cluster analysis resulted in the selection of 6 distinct clusters of environmental factors. View evidence ↗
- The first stage of PCA extracted a total of 22 intra-cluster principal components across the six clusters. View evidence ↗
- In the second stage, the first 11 inter-cluster principal components explained 91.732% of the total variance of the 22 intra-cluster components. View evidence ↗
- The first two inter-group principal components alone accounted for 26.186% and 14.530% of the total variance, respectively. View evidence ↗
What it means
- The authors conclude that their proposed methodology is appropriate for analyzing large-scale data as it reduces dimensions with minimal information loss. View evidence ↗
Visual summary
3 visualsIllustrations explain the paper; charts are replotted from the paper's own table values.
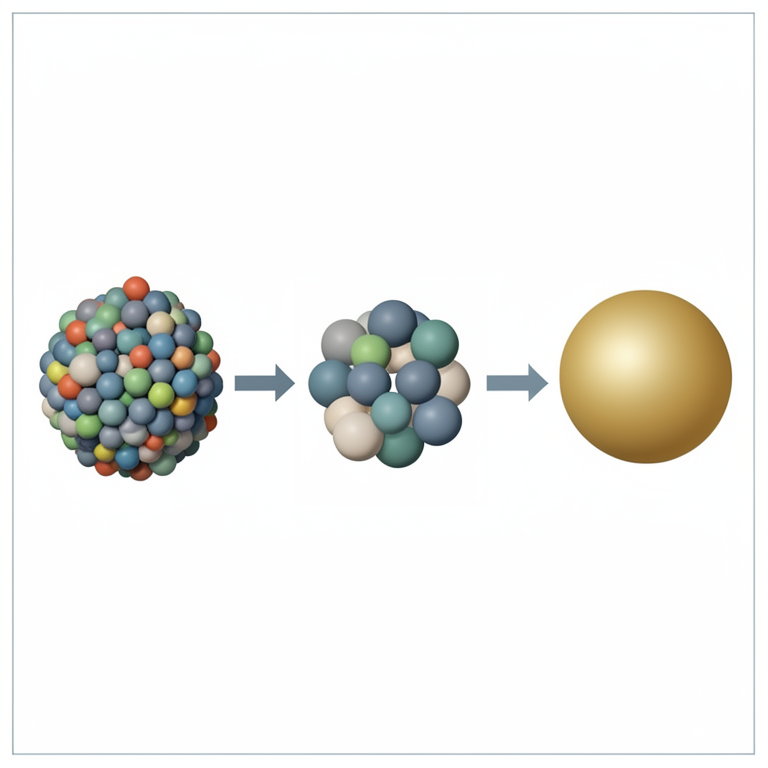
Two-Stage Dimensionality Reduction Workflow
AI-generated conceptual illustration (A digital data cloud represented as a collection of multicolored geometric spheres). It explains the idea and does not show study data.
View source evidence ↗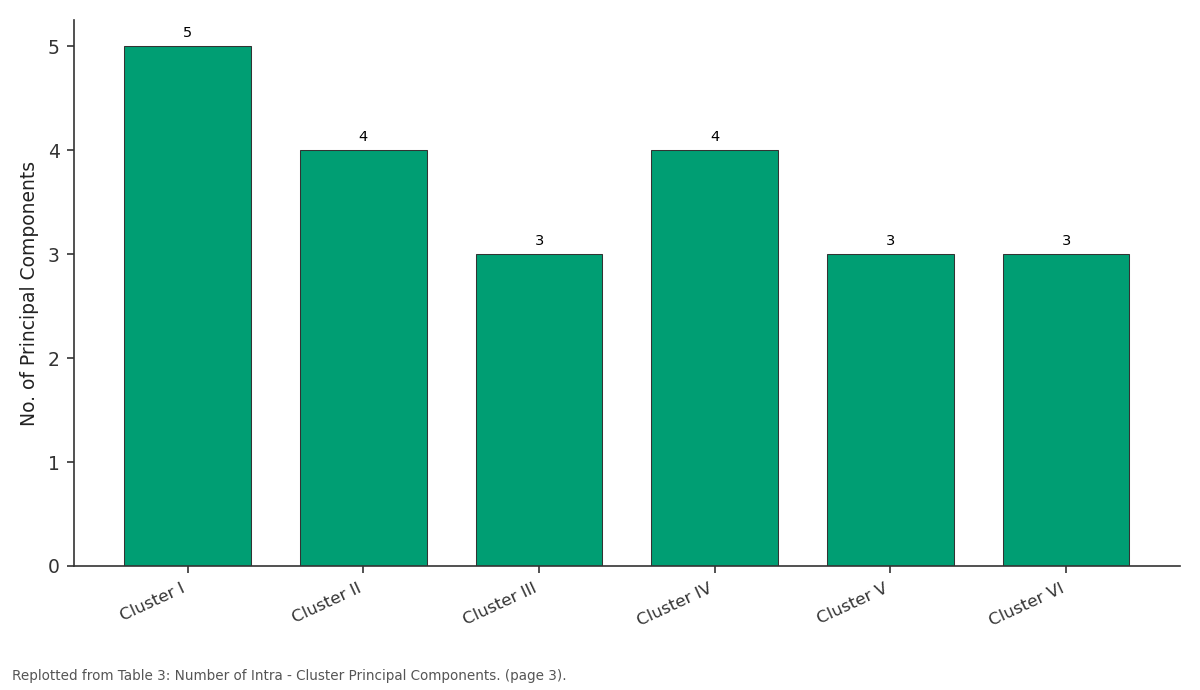
No. of Principal Components: Cluster I vs Cluster II vs Cluster III vs Cluster IV vs Cluster V
Replotted from Table 3 (page 3) of the original paper. Every bar is the paper's own table value.
View source evidence ↗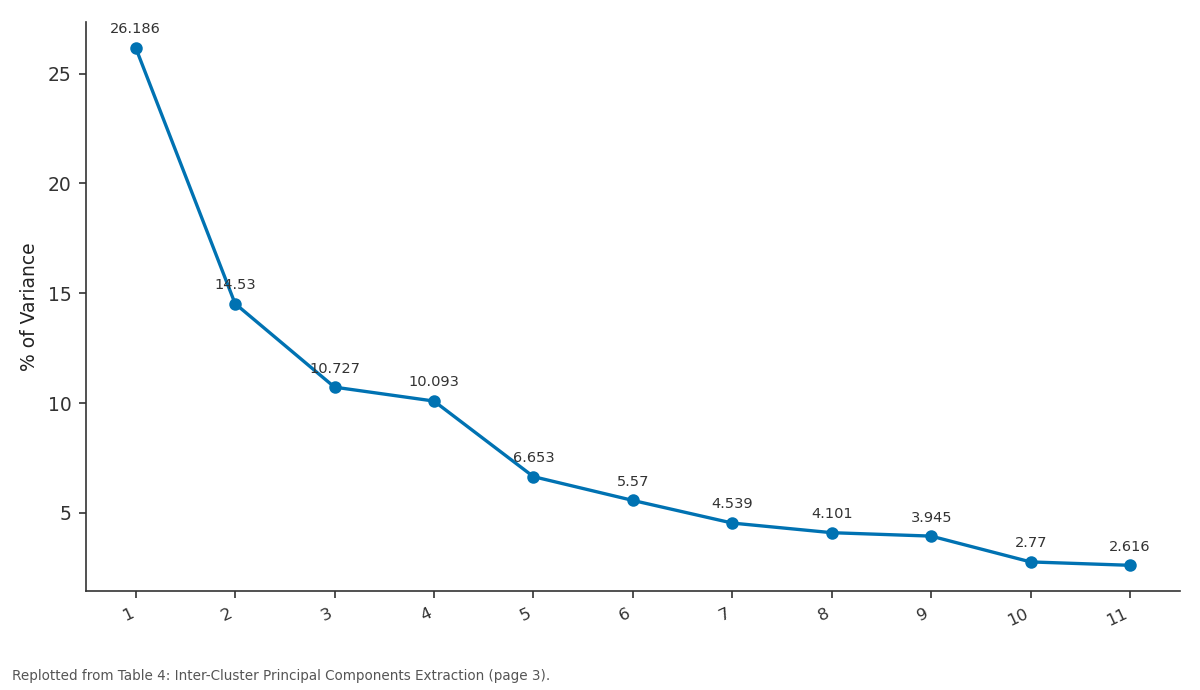
% of Variance: 1 vs 2 vs 3 vs 4 vs 5
Replotted from Table 4 (page 3) of the original paper. Every bar is the paper's own table value.
View source evidence ↗Figures & tables
From the original paper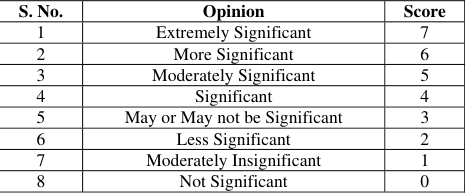 Table 1
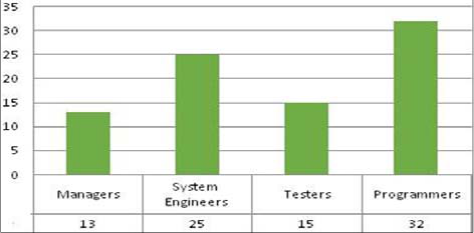 Figure 1
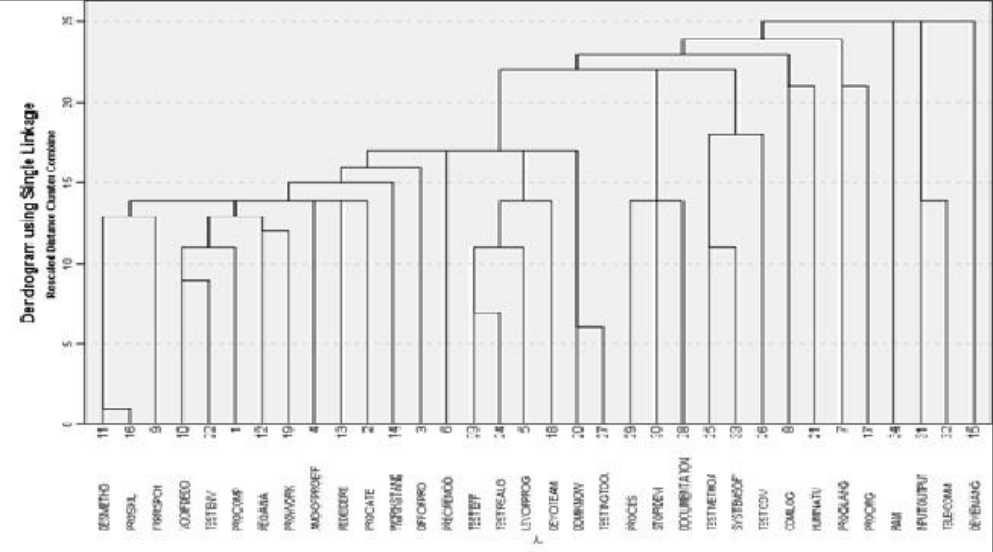 Figure 2
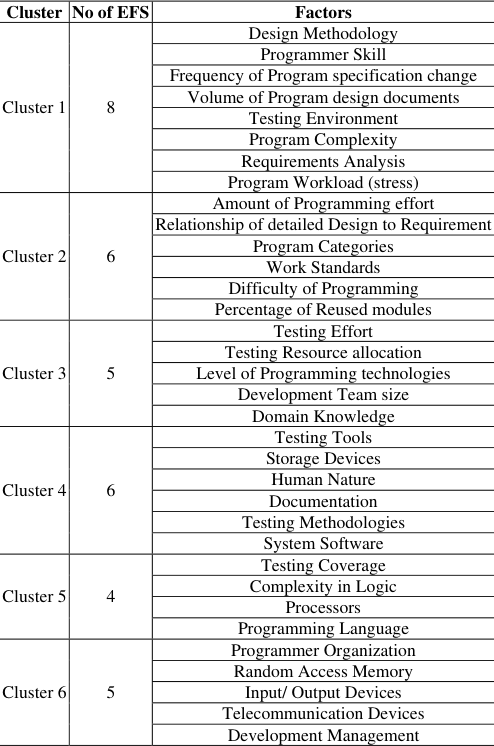 Table 2
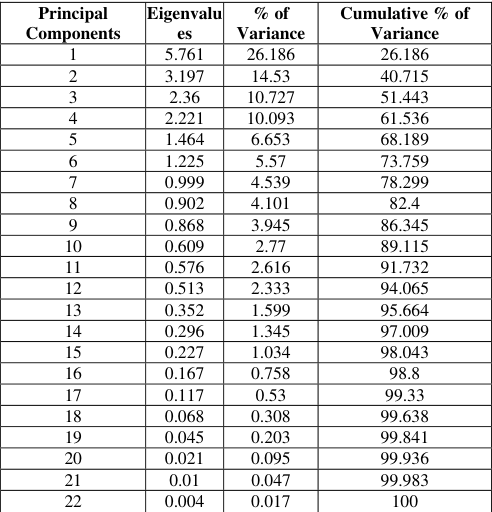 Table 4
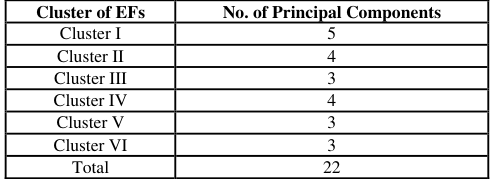 Table 3
Introduction
In a modern world, data might be represented in a spreadsheet, with one column representing each dimension. Dimensionality in statistics states that how many attributes a data set has. Naturally, healthcare records are notorious for having huge amounts of variables. High dimensional, that the number of dimensions is staggeringly high so calculations become extremely difficult. Dimensionality reduction is the process of reducing the dimensional of the feature data set with some acceptable level of loss of information. In the present world, data scientists observe large volumes of data, which is tough to process, information can be raw, unstructured, and high dimensional. Handling high dimensional data is hard, so the dimensionality reduction is essential to handling the data to analyze further. This paper proposes a methodology to reduce the dimensionality with less amount of loss of information in two different stages. Principal components analysis is used to reduce the dimensionality. The methodology is justified by the data which is collected to study the reliability of the software with Environmental factors. In software reliability studies, the reliability of the software studied through failure test data. Pham (2000) [6] and Patwa and Malviya (2014) [5] proposed Some environmental factors (EFs) to study the reliability of the software. Pham (2000) [6] proposed 32 EFs and Patwa and Malviya (2014) [5] used 26 EFs, from 26, 24 EFs are already used by Pham (2000) [6] , Patwa and Malviya (2014) [5] introduced two EFs. Loganathan and Muthuraj (2016) [3] proposed that the 34 EFs are potential to study the reliability of the software.
Methodology
The Principal Components Analysis (PCA) is one of the classical methods of multivariate statistical data analysis. PCA is a dimensionality reduction technique, which is used to transform a high-dimensional dataset into a smaller-dimensional subspace. It is difficult to generate independent explanatory variables from these EFs. However, it is possible to extract uncorrelated explanatory variables from these EFs conducting principal components analysis (PCA). A methodology is used to reduce the volume of the data with less amount of loss of information with two stages. Cluster analysis subdivides a given set of individuals/objects into several disjoint subsets, called clusters, such that individuals /objects in the same cluster are more similar than individuals /objects in different clusters according to the same acceptable criterion of similarity. Clustering methods can be broadly categorized into two viz., hierarchical methods and non-hierarchical methods. Here 34 EFs has to be considered for the analysis, first, the factor is grouped into five clustered based on their similarities. Here it is proposed to perform principal component analysis in two stages. In the first stage, the principal components explaining 90% of the variation among the EFs in each cluster are extracted i.e., Intra-Cluster principal components extraction. Then, again principal components analysis is performed treating the intra-clusters principal components as variables. The Inter-Clusters principal components explaining 90% of the variation of the intra-cluster principal components are extracted and such principal components will be considered for further analysis.
Data Description
An investigation survey was conducted to studying the impact level of all the 34 EFs in view of the technical experts who are involved in developing and maintaining software. A questionnaire was designed to collect opinions of Managers, System Engineers, Software testers and Programmers. The respondents were given eight ( 8) options to express their opinion about the significance of each EF on determining software reliability. The opinions were scaled in 8-point scale as listed in Table 1. The questionnaire was sent to a randomly selected 85 persons who were working in 14 software development organizations.
| S. No. | Opinion | Score |
|---|---|---|
| 1 | Extremely Significant | 7 |
| 2 | More Significant | 6 |
| 3 | Moderately Significant | 5 |
| 4 | Significant | 4 |
| 5 | May or May not be Significant | 3 |
| 6 | Less Significant | 2 |
| 7 | Moderately Insignificant | 1 |
| 8 | Not Significant | 0 |
Table text extracted from the original PDF; superscript letters are shown inline. The original table image is below.
View original table image
The respondents were communicated through e-mail attached with the questionnaire. The questionnaires were sent to the respondents along with Commercial Billing software for collecting their opinion on the significance of each EF with the aim of studying the reliability of this software. The total number of respondents is 85. Among them, 15% (13) of them were Managers, 29% (25) of them were System Engineers, another 18% (15) of them were testers and the remaining 38% (32) were Programmers. The information about the respondents is graphically presented in Fig. 1. The process of fusion is described in the dendrogram, which is displayed in Figure 2. A set of 6 clusters is selected and details of the cluster members are presented in Table 2.
| Cluster | No of EFS | Factors |
|---|---|---|
| Cluster 1 | 8 | Design Methodology |
| Programmer Skill | ||
| Frequency of Program specification change | ||
| Volume of Program design documents | ||
| Testing Environment | ||
| Program Complexity | ||
| Requirements Analysis | ||
| Program Workload (stress) | ||
| Cluster 2 | 6 | Amount of Programming effort |
| Relationship of detailed Design to Requirement | ||
| Program Categories | ||
| Work Standards | ||
| Difficulty of Programming | ||
| Percentage of Reused modules | ||
| Cluster 3 | 5 | Testing Effort |
| Testing Resource allocation | ||
| Level of Programming technologies | ||
| Development Team size | ||
| Domain Knowledge | ||
| Cluster 4 | 6 | Testing Tools |
| Storage Devices | ||
| Human Nature | ||
| Documentation | ||
| Testing Methodologies | ||
| System Software | ||
| Cluster 5 | 4 | Testing Coverage |
| Complexity in Logic | ||
| Processors | ||
| Programming Language | ||
| Cluster 6 | 5 | Programmer Organization |
| Random Access Memory | ||
| Input/ Output Devices | ||
| Telecommunication Devices | ||
| Development Management |
Table text extracted from the original PDF; superscript letters are shown inline. The original table image is below.
View original table image
Intra-Cluster Principal Components Extraction
It is proposed to perform principal component analysis in two stages. In the first stage, the principal components explaining 90% of the variation among the EFs in each cluster are extracted i.e., Intra-Cluster principal components extraction. Then, again principal components analysis is performed treating the intra-clusters principal components as variables.
Conclusion
This study considered 34 potential environmental factors which are important to study the reliability of the software. It is proposed that, while handling large-scale data, the proposed methodology is appropriate for further analysis with less amount of loss of information and with less dimensions.
Figures and tables from the paper
| Principal Components | Eigenvalu es | % of Variance | Cumulative % of Variance |
|---|---|---|---|
| 1 | 5.761 | 26.186 | 26.186 |
| 2 | 3.197 | 14.53 | 40.715 |
| 3 | 2.36 | 10.727 | 51.443 |
| 4 | 2.221 | 10.093 | 61.536 |
| 5 | 1.464 | 6.653 | 68.189 |
| 6 | 1.225 | 5.57 | 73.759 |
| 7 | 0.999 | 4.539 | 78.299 |
| 8 | 0.902 | 4.101 | 82.4 |
| 9 | 0.868 | 3.945 | 86.345 |
| 10 | 0.609 | 2.77 | 89.115 |
| 11 | 0.576 | 2.616 | 91.732 |
| 12 | 0.513 | 2.333 | 94.065 |
| 13 | 0.352 | 1.599 | 95.664 |
| 14 | 0.296 | 1.345 | 97.009 |
| 15 | 0.227 | 1.034 | 98.043 |
| 16 | 0.167 | 0.758 | 98.8 |
| 17 | 0.117 | 0.53 | 99.33 |
| 18 | 0.068 | 0.308 | 99.638 |
| 19 | 0.045 | 0.203 | 99.841 |
| 20 | 0.021 | 0.095 | 99.936 |
| 21 | 0.01 | 0.047 | 99.983 |
| 22 | 0.004 | 0.017 | 100 |
Table text extracted from the original PDF; superscript letters are shown inline. The original table image is below.
View original table image
| Cluster of EFs | No. of Principal Components |
|---|---|
| Cluster I | 5 |
| Cluster II | 4 |
| Cluster III | 3 |
| Cluster IV | 4 |
| Cluster V | 3 |
| Cluster VI | 3 |
| Total | 22 |
Table text extracted from the original PDF; superscript letters are shown inline. The original table image is below.
View original table image
References
9 in the original paper- Garson GD. Cluster Analysis, Statistical Associate Publishers USA, 2012.
- Jelinski Z, Moranda P. In Statistical Computer Performance Evaluation, in W. Freiberger, Ed. New York: Academic Press, 1972, 465-484.
- Loganathan A, Muthuraj RJ Importance of Environmental Factors affecting Software Reliability, Global and Stochastic Analysis. 2016; 2:101-105.
- Loganathan A, Muthuraj RJ. A new methodology for data reduction in software reliability studies, Communications in Statistics: Case Studies, Data Analysis and Applications. 2017; 4:119-125.
- Patwa S, Malviya K. A Survey on Factors affecting Testing Techniques in Object-Oriented Software, International Journal of Applied Research on Information Technology and Computing. 2014; 5:78-85.
- Pham H.: System Software Reliability, Springer Series in Reliability Engineering, 2000.
- Zhang X, Pham H. An analysis of factors affecting software reliability. Journal of Systems and Software. 2000; 50(1):43-56.
- Zhang X, Shin MY, Pham H. Exploratory analysis of environmental factors for enhancing the software reliability assessment, Journal of Systems and Software. 2001; 57:73-78.
- Zhang X, Zhu MY, Pham H. A comparison analysis of environmental factors affecting software reliability, Journal of Systems and Software. 2015; 109:150-160.