
Research article · 2019 · Full text
International Journal of Statistics and Applied MathematicsFitting a Markovian queuing model to bus park revenue collection point in Kisii town, Kenya
Volume 4(2) · Pages 26–30
Research areasHealthcare Operations and Scheduling OptimizationAdvanced Queuing Theory Analysis
Abstract
Author-writtenIn queuing theory one deals with the mathematical analysis of the performance of queuing systems. In our daily lives customers encounter queues while seeking services in institutions. The increase in the number of customers has resulted to congestion at revenue collection points in Kenyan towns. There is therefore need to study the queuing systems to identify possible remedies. This study sought to fit a queuing model to bus park revenue collection point as a preliminary action in studying the congestion problem in Kisii town, Kenya. The study considered and collected data on the inter-arrival times, service times and the number of servers at Kisii Bus Park Revenue Collection Point. The inter-arrival and service times were plotted and compared to a plot of a theoretical exponential distribution. The inter-arrival times resembled a theoretical exponential distribution with a parameter 1.022 and the service times resembled a theoretical exponential distribution with a parameter 1.209. Further, Kolmogorov Smirnov and Anderson Darling goodness of fit tests were conducted to determine if the inter-arrival and service times were exponentially distributed. In both cases, the test statistics were less than the critical value. The study therefore established that the inter-arrival and the service times could be modeled as exponential hence Markovian. The revenue collection point used two servers. This study assumed that the servers followed the same service distribution. This study concluded that the inter-arrival and the service times had an exponential distribution and the queuing model used was M/M/2.
Summary
Source-checkedPlain-language reading of the full paper, prepared with AI and checked against the text. Each point links to the authors' own words.
Why it matters
- Congestion at revenue collection points in Kenyan towns has increased due to a growing number of customers. View evidence ↗
- Queuing models are useful for organizations to predict system performance during the design process. View evidence ↗
- These models allow organizations to calculate performance metrics such as queue lengths, traffic intensity, and waiting times. View evidence ↗
The question
- The study aimed to fit a queuing model to the bus park revenue collection point in Kisii town, Kenya, to help address congestion. View evidence ↗
What they did
- The researchers collected data on the number of servers, service times, and inter-arrival times at the Kisii Bus Park Revenue Collection Point. View evidence ↗
- To determine if the data followed an exponential distribution, Kolmogorov Smirnov (K-S) and Anderson Darling (A-D) tests were performed at a 5% significance level. View evidence ↗
- The study compared plots of the collected inter-arrival and service times against a theoretical exponential distribution. View evidence ↗
What they found
- The inter-arrival times were found to be exponentially distributed, as the K-S test statistic (0.04418) was less than the critical value (0.0693). View evidence ↗
- The A-D test confirmed the exponential distribution of inter-arrival times, with a statistic of 0.69049 compared to a critical value of 2.5018. View evidence ↗
- Service times were also found to be exponentially distributed, with a K-S test statistic of 0.0465, which is less than the critical value of 0.0693. View evidence ↗
- The A-D test for service times yielded a statistic of 1.3295, which is less than the critical value of 2.5018, confirming an exponential distribution. View evidence ↗
- The revenue collection point operated with two servers. View evidence ↗
What it means
- The authors concluded that the revenue collection point's system is a multi-server Markovian model, specifically an M/M/2 model. View evidence ↗
- The authors suggest that future research should investigate whether this queuing model remains applicable during peak and off-peak times of the day or month. View evidence ↗
Visual summary
1 visualsIllustrations explain the paper; they do not show study data.

M/M/2 Queuing System Concept
AI-generated conceptual illustration (Bus park revenue collection point in Kisii town, Kenya). It explains the idea and does not show study data.
View source evidence ↗Figures & tables
From the original paper Table 1
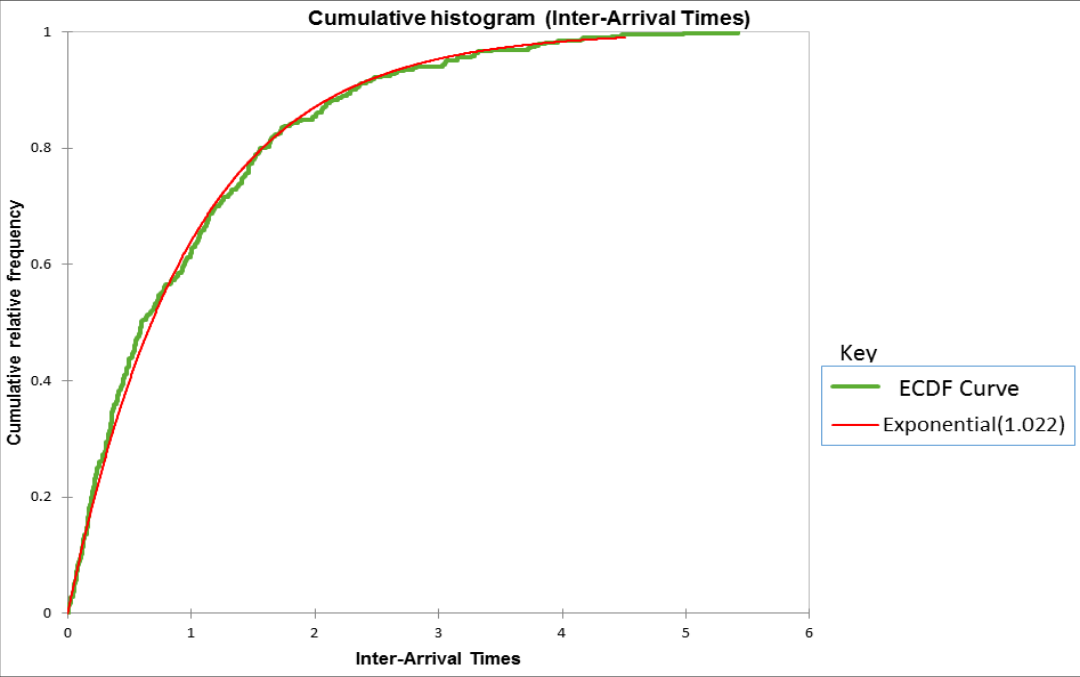 Figure 1
 Table 2
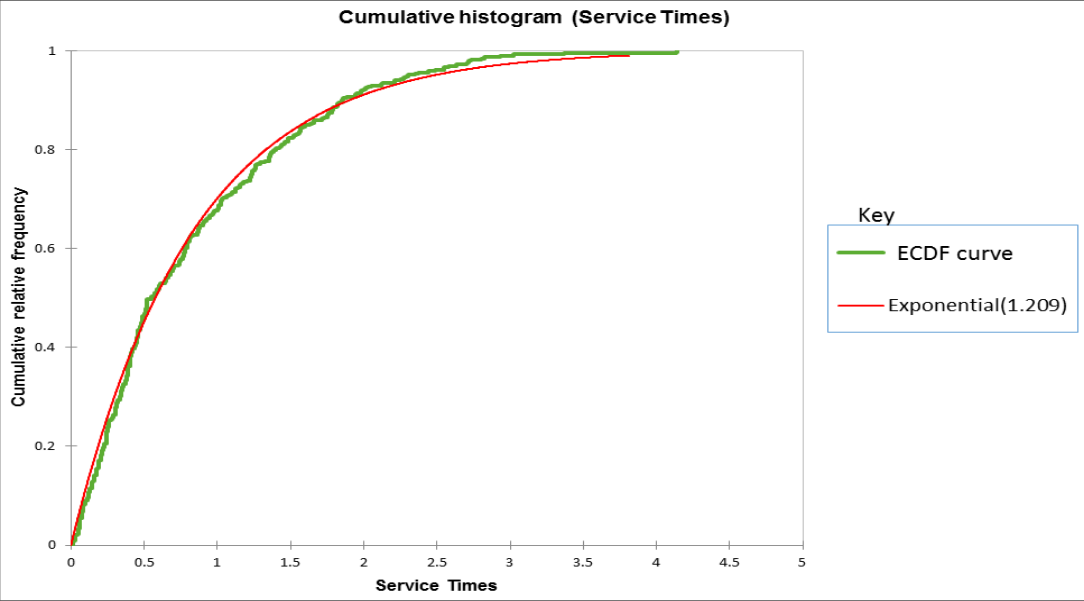 Figure 2
Introduction
Queues are experienced in our daily lives in business situations where customers have to wait for services to be delivered to them for example: in telephone exchange, in banks, in public transportation, in a supermarket, at the county revenue collection points, at a petrol station, waiting to use an automated teller machine (ATM) and people queuing to wait for their turn to vote [1,2] . When using phones to conduct daily businesses, sometimes one may be put on hold and wait for their turn to receive the services. In modern life, queues are not experienced by humans only. Modern communication systems transmit messages, like emails, from one device to another by queuing them up inside the network. Modern communication systems maintain queues called inventories of raw materials, partly finished goods, and finished goods throughout the manufacturing process of a business institution. The supply chain management in businesses is nothing but the management of queues [3] . Queuing models help in the design process by predicting system performance in organizations. For example queuing models might be used to evaluate the costs and benefits of adding a server (s) to an existing system of an institution. The models enable institutions/organizations to compute the system performance measures in terms of more basic quantities like the waiting times, traffic intensity and the queue lengths in the systems. Some crucial measures of system (s) performance are: the mean queue length, probability of a customer waiting for service in the system, the probability of finding the system being idle, the probability distribution of the number of customers in the system, the utilization of the server (s) and customer waiting time [2] . Queuing systems have a wide range of applications in modern times [3] . The first queuing theory problem was found in the telephone exchange congestion studied by A.K. Erlang (1878-1929).
A.K. Erlang, a Mathematician, was the chief advisor of a Telephone Company based in Copenhagen. In 1917, Erlang was able to publish a paper on the telephone exchange traffic in which he outlined the methodologies of solving the long waiting line and the large number of arrivals to the company when the systems were in a steady state. A.K. Erlang formed the basis for the development of the queuing models and systems being studied by other scholars. Queuing systems have the following crucial components: Customers who arrive at a service station to receive a certain service. If the customers cannot be served immediately upon arrival they wait in a queue for their turn to be attended to and upon receiving the service they leave the service station immediately [4] .
Markovian Multi-Server Queuing Models i. M/M/c/∞ Model: This refers to a MSQM with
Markovian arrivals and exponential service time distribution. Both the input population and the system capacity are infinite. The first M in this case stands for Markovian/ Memory less, the second M stands for the exponential service distribution. The number of servers is represented by m which is greater than one. The system capacity is infinite [2,5] . ii. M/M/c/K Model: This queuing model is the same as the M/M/m model except that it has a finite system capacity represented by N [5] . iii. M/M/∞ Model: This is a queuing model with infinite number of servers. When customers arrive they proceed directly to the available server to be attended to that is instant service delivery is experienced in this queuing system. In this queuing system the probability of queuing is zero-that is queues are usually not experienced in this type of queuing system. The inputs follow a Poisson distribution and the outputs follow the exponential distribution [2,3,5] .
Methodology
Both primary and secondary data were collected. Primary data entailed both the inter-arrival and service times. The secondary data involved Kisii County estimated arrival and service rates specifically for Bus Park revenue collection point. The cumulative distributions of the inter-arrival and service times were plotted and a comparison was made to their respective theoretical exponential distributions. Further, goodness of fit tests was conducted to both the inter-arrival and service times to determine how best the collected data fitted the identified distributions. Kolmogorov Smirnov (K-S) and Anderson Darling (A-D) tests were used to determine if the inter-arrival and service time data are exponentially distributed. K-S and A-D tests were conducted at 5% significance level [7] .
Exponential Distribution PDF and CDF
"Consider a nonnegative random variable with parameter ʎ > 0 with the following probability density function (PDF);
The corresponding Cumulative Distribution Function (CDF) can be computed as
If the random variable x has units of time then the parameter ʎ has units of 𝑡𝑖𝑚𝑒 -1 '' [3]
Kolmogorov Smirnov (K-S) Goodness of Fit Test
The K-S test is a nonparametric test. The cumulative probabilities of values in the data are compared with the cumulative probabilities in a theoretical distribution. The K-S test tends to be more sensitive near the center of the distribution than at the tails. The following K-S test statistic was employed after the data had been arranged in ascending order
The hypothesis tested was defined as: H0: the data follow a negative exponential distribution Ha: the data do not follow a negative exponential distribution If the calculated value is less than the critical value fail to reject the null hypothesis and if the computed value is greater than the critical value reject the null hypothesis [8] .
Anderson Darling (A-D) Goodness of Fit Test
A-D test was designed by Anderson and Darling in 1954 to place more weight to the distribution at the tails. This is crucial when the tails of a selected distribution are of practical significance. To conduct A-D test, first the data is arranged in ascending order. The cumulative distribution function is then evaluated. Then the A-D statistic is obtained by the following formula.
The next step involves computing the adjusted statistics (𝐴 𝑎𝑑 ). For an exponential distribution;
The critical value for an exponential distribution was determined. The adjusted statistics was compared to the critical value and this formed the basis of failing to reject (rejecting) the null hypothesis. The A-D test is valid for a sample size greater than seven [9] .
Results
Results
Inter-arrival Times Distribution
The cumulative distribution of the Inter-arrival times was plotted alongside the cumulative distribution of a theoretical exponential distribution. This was done in order to determine if there was a relationship between the two distributions. From fig 1, it can be observed that there is no significant difference between the two distributions hence deducing that the data could be modeled as an exponential distribution. To affirm if the sample followed exponential distribution, this study went further and conducted a K-S and A-D goodness of fit test. From table 1, it can be deduced that K-S test the statistic = 0.04418< the critical value = 0.0693 indicating that the data is exponentially distributed. In A-D test the statistic = 0.69049 < critical value = 2.5018 confirming that the sample data is exponentially distributed. This forms the basis of concluding that Bus Park revenue collection point inter-arrival times followed the exponential distribution hence Markovian.
| Description | Kolmogorov-Smirnov Test | Anderson-Darling Test |
|---|---|---|
| Statistic | 0.04418 | 0.69049 |
| α | 0.05 | 0.05 |
| Critical Value | 0.0693 | 2.5018 |
| Reject? | No | No |
Table text extracted from the original PDF; superscript letters are shown inline. The original table image is below.
View original table image
K-S and A-D goodness of fit test
K-S and A-D goodness of fit test
Service Times Distribution
The service time distribution was plotted alongside the theoretical cumulative distribution of an exponential distribution and comparison made. From fig 2, it can be observed that the service time cumulative distribution graph doesn't vary significantly from the theoretical cumulative distribution graph. To affirm that the service times followed the exponential distribution, this study took a step further and conducted a K-S and A-D tests to determine if the sample data indeed followed the exponential distribution.
Service K-S and A-D Goodness of Fit Tests
Service K-S and A-D Goodness of Fit Tests
Conclusion
The empirical cumulative distributions for inter-arrival and service times were plotted together with the theoretical distribution of an exponential distribution. Comparison was made to determine if there was a relationship. There was no significant difference in the plots of the cumulative distributions. Further, K-S and A-D goodness of fit test was conducted to both the inter-arrival and service times. For the case of inter-arrival times, K-S statistic = 0.04418 < critical value = 0.0693 while the A-D statistic =0.69049 < critical value = 2.5018. Both the K-S and A-D goodness of fit test confirmed that the inter-arrival times had the exponential distribution. On the other hand, service times K-S statistic = 0.0465 < critical value = 0.0693 while the A-D statistic = 1.3295 < critical value = 2.5018 indicating that the STs fitted the exponential distribution. This study concluded that both the inter-arrival and service times were exponentially distributed It was deduced that the inter-arrival and service times were Markovian. The revenue collection point used 2 servers. These indicate that the structure of the model used at Bus Park Revenue collection point was a multi-server model defined as M/M/2.
Recommendations
i. The methodology employed in this study can be extended to other revenue collection points within the County to determine if they are also Markovian or not. ii. Kisii County Government and/ or future researchers can use the fitted queuing model (M/M/2) to analyze the performance of the model at Bus Park Revenue collection point. iii. Future researchers should study to determine whether the inter-arrival and service times can fit the non-Markovian queuing models. iv. Future researchers should do an investigation to determine if the queuing model applies to the peak and off-peak times of the day/ month.
Acknowledgement
I wish to thank all the individuals whose information was of value in conducting this study. Special thanks to Kisii County
Figures and tables from the paper
| Description | Kolmogorov-Smirnov Test | Anderson-Darling Test |
|---|---|---|
| Statistic | 0.0465 | 1.3295 |
| α | 0.05 | 0.05 |
| Critical Value | 0.0693 | 2.5018 |
| Reject? | No | No |
Table text extracted from the original PDF; superscript letters are shown inline. The original table image is below.
View original table image
References
8 in the original paper- Sammy Kariuki Mwangi, Thomas Mageto Ombuni. An empirical analysis of queuing model and queuing behaviour in relation to customer satisfaction at JKUAT student finance office. American Journal of theoretical and applied statistics, 2015, 233-246.
- Howard Taylor M, Samuel Karlin. An introduction to Stochastic Modeling (3rd edition ed.). Carlifornia: Academic Press, 1998.
- Kulkarni V. Introduction to modeling and Analysis of Stochastic Systems (second edition ed.). Newyork: Springer Science + Business Media, 2011.
- Wiley D. Queueing Systems. In C. C. Larfortune, Introduction to Discrete Events (p. Chapter 6). Saint Etienne: Ecole Nationale Superieure des Mines Saintetienne, 2016.
- Benard Tonui et al. On Markovian Queuing Models. International Journal of Science and research, 2014.
- Moshe Z. Introduction to Queueing Theory and Stochastic Teletraffic Models. Hong Kong: City University of Hong Kong, 2017.
- McNickle D. Teaching Note-Fitting Theoretical Model to a Real Queue. Maryland, USA: INFORMS Transaction on Education. 2011; 11(3).
- Anuradha B. Kolmogorov-Smirnov test [K-S Test], 2017. Retrieved from Computer Simulation and Modelling: http://www.anuradhabhatia.com