
Research article · 2020 · Full text
International Journal of Statistics and Applied MathematicsA report on analysis of vaccine in Tamil Nadu using sampling techniques
Volume 5(5) · Pages 16–19 · DOI: 10.22271/maths.2020.v5.i5a.578 ↗
Research areasCOVID-19 epidemiological studiesSARS-CoV-2 and COVID-19 ResearchDiverse Scientific Research Studies
Abstract
Author-writtenStatistics is a division of arithmetic managing the gather, analysis, interpretation, presentation, and organization of information. Data are distinct pieces of information and is collected, observed, or created, for the purposes of analysis to produce original research results. There are many methods used to collect or obtain data for statistical analysis and it can be categorized as Census, Sample Survey, Experiment and etc. In the rapid growth of population and avaricious attitude of industries and residents are generated huge amount of pollutions and diseases which affects our immune system at high level. Due to this reason, the health issues of people are uncontrolled and it becomes a big task to the government. So, many countries interested to influence the awareness among people through campaign, vaccination, and by conducting health camps. A vaccine is a biological preparation that provides an active acquired immunity to a particular disease. Vaccines led to the eradication of smallpox, Hepatitis, polio, measles, mumps, and chicken-pox which are deadly diseases in humans. In this paper, we analyze the people’s awareness about vaccination in and around Tamilnadu by using sampling techniques.
Summary
Source-checkedPlain-language reading of the full paper, prepared with AI and checked against the text. Each point links to the authors' own words.
Why it matters
- Rapid population growth and industrial pollution have increased the prevalence of diseases that negatively impact the human immune system. View evidence ↗
- Vaccines are biological preparations used to provide acquired immunity and have been instrumental in eradicating deadly diseases such as smallpox and polio. View evidence ↗
The question
- The study aims to analyze the level of awareness regarding vaccination among people in and around Tamil Nadu using sampling techniques. View evidence ↗
What they did
- Data for the study was collected through interviews and discussions with residents of the study area. View evidence ↗
- The sample consisted of 500 respondents, of which 81.2% were male and 18.8% were female. View evidence ↗
- The researchers used simple percentages, correlation, and other statistical tools to analyze and interpret the collected data. View evidence ↗
- A chi-squared (χ2) test was employed to compare statistical data sets and determine the likelihood of observed results. View evidence ↗
What they found
- The majority of respondents (95.8%) were natives of their town panchayat, while only 4.2% were migrants. View evidence ↗
- Respondent distribution by zone was highest in the south (28.7%) and west (27.3%), moderate in the east (24.2%), and lowest in the north (19.8%). View evidence ↗
- Native families accounted for 98.9% of the vaccination respondents in Tamil Nadu. View evidence ↗
What it means
- The authors conclude that there is no significant difference in vaccination awareness across the four regions for children vaccinated between 2010 and 2020. View evidence ↗
Figures & tables
From the original paper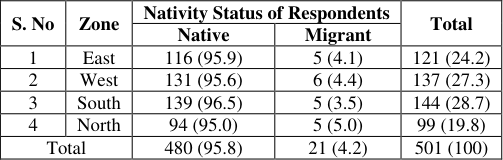 Table 2
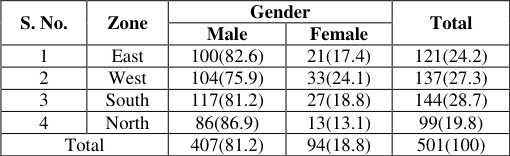 Table 1
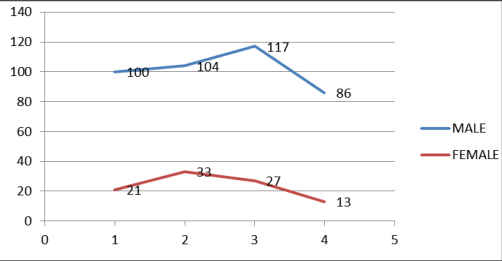 Figure 1
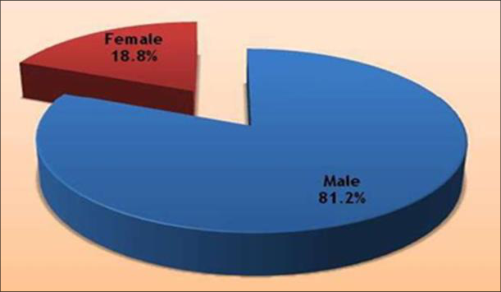 Figure 2
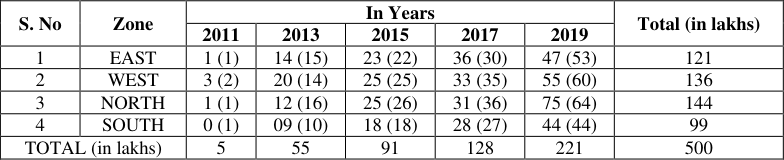 Table 3
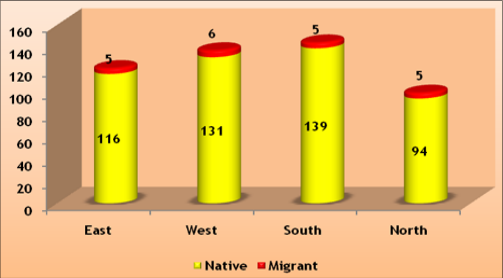 Figure 3
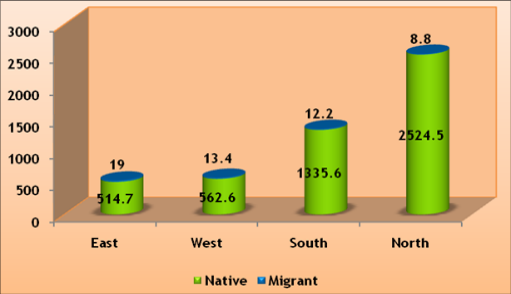 Figure 4
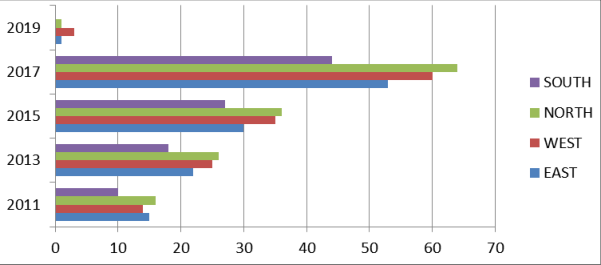 Figure 5
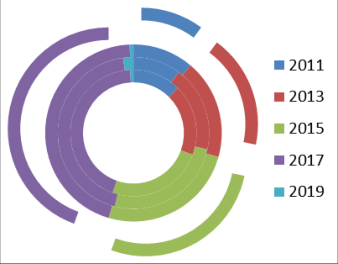 Figure 6
Introduction
Statistics is the tool device to probability and anticipate through accurate model. An analyst gathers test information by creating particular trial plans and study tests. Analogies may be one of the fertile sources of hypothesis and it stimulate new valuable hypotheses. Concepts in Hempel's deductive nomological model [1] play a key role in the development and testing of hypotheses. The standard move towards is to test an unacceptable hypothesis against an optional hypothesis. The null hypothesis and the alternative hypothesis are chosen before the sample is drawn in which we make a rule that according to acceptance of H 0 (i.e., reject Ha) or rejection of H 0 (i.e., accept Ha). A chi-squared test is basically a data analysis on the basis of observations of a random set of variables. Usually, it's a comparison of two statistical data set and it is also represented as χ 2 test. This test was introduced by Karl Pearson [2] in 1900 for categorical data analysis and distribution. With the assumption of the null hypothesis as true, this test is used to estimate how likely the observations that are made would be. Degree of freedom refers to the number of values which are free to vary after we have given the number of restrictions imposed upon the data. It is commonly discussed in relation to chisquare (χ2) and other forms of hypotheses testing statistics. When determining the significance of a chi-square statistic and the validity of the null hypothesis, the degree (s) of freedom plays a vital role in it. If the significance level is 5 per cent and the two-tailed test is to be applied, the probability of the rejection area will be 0.05. A one-tailed test say, whether the population mean is either lower than or higher than some hypothesized value. The chi-squared test is to check if there is any difference between the observed value and expected value and it is calculated by using the formula, χ2 = (Observed -Expected) 2 /Expected Value
Vaccine Action Plan
Most countries among those responding to the regional survey (17-19 of 20) have carried out several activities for developing and disseminating an evidence base on the public health value of vaccines and immunization and the economic benefits of immunization, while many countries need technical assistance to further expand the evidence base, including tocollect, analyse and disseminate evidence [3] . Most countries responding to the survey (18 of 20) have already included immunization in the agendas of governing body meetings while some Pacific island countries and areas (such as Fiji, Guam, Niue and Tokelau) need external support for this activity. The School Health Programme aims to create a healthy environment in the school, to optimize children's health status, to detect health problems and disabilities in school children, and to build partnerships in health. To achieve these objectives, the Ministry of Health coordinates or provides health education, health screening, vaccination, curative and referral services, dental health services, and environmental health services, while the Ministry of Education addresses nutrition and health education through the curriculum [4] . The school health immunization programme is one component of school health services and is provided by school health teams including doctors, assistant medical officers, and public health and community nurses. The school health team gives six vaccines, including vaccines against diphtheria/pertussis, oral polio, measles and tuberculosis (BCG, if no scar) for children (see [5,6] ). For the past 20 years, the National Immunization Programme has conducted much immunization-related research, including seroprevalence of hepatitis B nationwide measles in selected regions, measuring a baseline and evaluating progress towards control immunogenicity studies of measles second-dose vaccination, cost effectiveness analysis of rubella and rotavirus vaccines showing that both vaccines would produce health benefits and would be cost-effective;
Main Results
The proposed study is basically empirical in nature and analysis focused on the status and factors for the awareness of vaccination among the people in Tamilnadu districts by using sampling techniques. The survey data collected through interview and discussion with the residence of the study area.
The study has used the following tools such as simple percentage along with correlation and other suitable statistical tools for analysis and interpretation of the data. The Sample Study covers 500 respondents comprising of 81.2 percent of male and 18.8 percent female, indicating that the male constitute the vast majority in total respondents (Table -1). The zone wise representation indicates that the south and west zones with 28.7 and 27.3 percent to the total respondents. While the representation is moderate with 24.2 precent in case of weastzone and it is least in case of north zone with 19.8 percent. Gender based intra-zone classification of respondents shows that it is almost of the represntative of the overall picture in the case ofeast and south zones while in other zones, there has been a slight difference in the gender representation with in the zones as shown in Fig. 1. Thus it can be stated that inter and intra zone differnce are not so much in the distribution of the respondents under study.
Figures in the parenthesis represent percentage
The zone wise analysis indicates that there was no much difference across the zones with the figures ranging from 95.9 per cent in east zone to 95.0 per cent in the north zone indicating that the percentage of inter-zone differences was very insignificant. Similar is the case of migrant respondents in all zones in the study area as shown in Fig. 3. An attempt to analysis the data on the vaccination by native and migrant families in Tamilnadu brought forth the fact that the total respondents by the native families contributed for the 98.9 per cent of the vaccination in Tamilnadu (Table II and Figure 3).It is so because of the fact that the native residents constituted the majority of the vaccination respondents. The migrant families which accounted for 4.2 per cent in the total have contributed less proportionately to native. Thus, it is evident that there is considerable difference between native and migrant respondents with regard to the extent of contribution to the vaccination in Tamil nadu Zone wise. The following table III gives the statistics for the awareness of vaccination among people in four regions from the year 2010 -2020. In parenthesis, the expected frequencies are given and the results are tested region-wise as well as year wise by using chi -square test formula.
Given that X 2 = ∑ (observed value -Expected value) 2 /Expected value.
The collected data between the years 2010 and 2020 are computed by using the following formula. Fig. 4 shows that the year wise statistics of respondents of each zone. Among them the north zone has been shown more awareness towards other zone people. The same vaccination, related activities shown poor response in eastern zones. Every year the awareness program have shown remarkable improvement.
Figures and tables from the paper
| S. No | Zone | Nativity Status of Respondents | — | Total |
|---|---|---|---|---|
| Native | Migrant | |||
| 1 | East | 116 (95.9) | 5 (4.1) | 121 (24.2) |
| 2 | West | 131 (95.6) | 6 (4.4) | 137 (27.3) |
| 3 | South | 139 (96.5) | 5 (3.5) | 144 (28.7) |
| 4 | North | 94 (95.0) | 5 (5.0) | 99 (19.8) |
| Total | 480 (95.8) | 21 (4.2) | 501 (100) |
Table text extracted from the original PDF; superscript letters are shown inline. The original table image is below.
View original table image
| S. No. | Zone | Gender | — | Total |
|---|---|---|---|---|
| Male | Female | |||
| 1 | East | 100(82.6) | 21(17.4) | 121(24.2) |
| 2 | West | 104(75.9) | 33(24.1) | 137(27.3) |
| 3 | South | 117(81.2) | 27(18.8) | 144(28.7) |
| 4 | North | 86(86.9) | 13(13.1) | 99(19.8) |
| Total | 407(81.2) | 94(18.8) | 501(100) |
Table text extracted from the original PDF; superscript letters are shown inline. The original table image is below.
View original table image
| S. No | Zone | In Years | — | — | — | — | Total (in lakhs) |
|---|---|---|---|---|---|---|---|
| 2011 | 2013 | 2015 | 2017 | 2019 | |||
| 1 | EAST | 1 (1) | 14 (15) | 23 (22) | 36 (30) | 47 (53) | 121 |
| 2 | WEST | 3 (2) | 20 (14) | 25 (25) | 33 (35) | 55 (60) | 136 |
| 3 | NORTH | 1 (1) | 12 (16) | 25 (26) | 31 (36) | 75 (64) | 144 |
| 4 | SOUTH | 0 (1) | 09 (10) | 18 (18) | 28 (27) | 44 (44) | 99 |
| TOTAL (in lakhs) | 5 | 55 | 91 | 128 | 221 | 500 |
Table text extracted from the original PDF; superscript letters are shown inline. The original table image is below.
View original table image
References
6 in the original paper- Hempel CG. Fundamentals of concept formation in empirical science. Chicago, Illinois: The University of Chicago Press, 1952, 36.
- Fisher R. Statistical Methods and Scientific Induction. Journal of the Royal Statistical Society, Series B. 1955; 17(1):69-78.
- Hubbard R, Parsa AR, Luthy MR. The Spread of Statistical Significance Testing in Psychology: The Case of the Journal of Applied Psychology, Theory and Psychology, 1997.
- Lehmann EL, Romano Joseph P. Testing Statistical Hypotheses (3E ed.). New York: Springer, 2005. ISBN 0387-98864-5.
- Lenhard Johannes. Models and Statistical Inference: The Controversy between Fisher and Neyman-Pearson. Brit. J Phil. Sci. 2006; 57:69-91. doi:10.1093/bjps/axi152.
- Siegrist Kyle. Hypothesis Testing Introduction, 2018. www.randomservices.org.
Cited by 2
From OpenAlex, OpenCitations and reference lists read by Scinovex
- WITHDRAWN: The Emberger Bioclimatic Classification System for the Forestry Management Under the Climate Change in the Mediterranean Region ↗
Müge Külahlıoğlu, Süha Berberoğlu, G. Kurt, Cenk Dönmez, Merve Şahingöz · Research Square · 2025
❝ 0PDF - WITHDRAWN: The Emberger Bioclimatic Classification System for the Forestry Management Under the Climate Change in the Mediterranean Region ↗
Müge Külahlıoğlu, Süha Berberoğlu, G. Kurt, Cenk Dönmez, Merve Şahingöz · Research Square · 2025
❝ 0PDF