
Research article · 2017 · Full text
International Journal of Statistics and Applied MathematicsEstimation of non-linear models for fitting growth curves of cotton in India
Volume 2(6) · Pages 190–196
Research areasAgricultural Economics and PracticesResearch in Cotton Cultivation
Abstract
Author-writtenThe objective of this study were to compare the goodness of fit of six non-linear growth model Monomolecular, Logistic, Gompertz, Richards, Quadratic and Reciprocal growth in India Cotton Area, Production and Productivity data collected during 1950-2012. The models parameters (a, b and c), Coefficient of Determination (R2), Residual Sum of Square (RSS) and Root Mean Square Error (RMSE) results. The “Run test” and “Shapiro-Wilk” test were also used to test the compliance of the error term to the underlying assumptions. Among the six models, under study predicted closely the observed values of top area, production and productivity in the selected nonlinear growth model has been selected for its accuracy of fit according to the highest R2, Lower Residual Sum of Square and Mean Square Error.
Summary
Source-checkedPlain-language reading of the full paper, prepared with AI and checked against the text. Each point links to the authors' own words.
Why it matters
- Cotton is a critical cash crop for India, which leads the world in terms of cultivation acreage. View evidence ↗
- As of 2014, India was a major global producer, contributing approximately 24% of the world's cotton with 27 million bales. View evidence ↗
- Developing non-linear growth models for cotton area, production, and productivity allows for a better understanding of past performance and more accurate future forecasting. View evidence ↗
The question
- The study aimed to compare the goodness of fit of six non-linear growth models (Monomolecular, Logistic, Gompertz, Richards, Quadratic, and Reciprocal) using Indian cotton data from 1950-2012. View evidence ↗
What they did
- The researchers used secondary data from the Cotton Corporation of India (CCI) covering the period from 1980 to 2013. View evidence ↗
- The researchers applied the Shapiro-Wilk test to check for normality of residuals and the Run test to check for randomness. View evidence ↗
What they found
- For cotton cultivated area, the Quadratic model provided the best fit, achieving the highest R-square of 56%, the lowest SSE (33.49), and the lowest RMS (0.56). View evidence ↗
What it means
- The authors conclude that non-linear models are promising tools for analyzing cotton crop data in India. View evidence ↗
- The authors suggest that these non-linear estimation techniques can help determine economic information and marketing strategies for plant-based businesses. View evidence ↗
Visual summary
3 visualsIllustrations explain the paper; charts are replotted from the paper's own table values.
Best Fit Model Summary
AI-generated conceptual illustration (cotton plants in an agricultural field). It explains the idea and does not show study data.
View source evidence ↗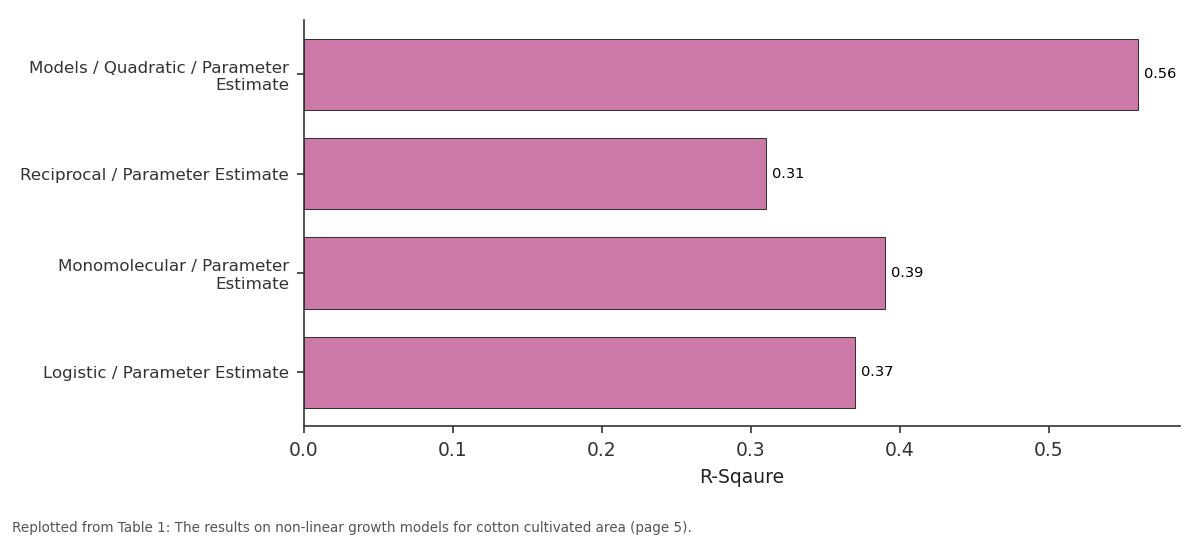
R-Sqaure: Models / Quadratic /... vs Reciprocal / Parameter... vs Monomolecular /... vs Logistic / Parameter...
Replotted from Table 1 (page 5) of the original paper. Every bar is the paper's own table value.
View source evidence ↗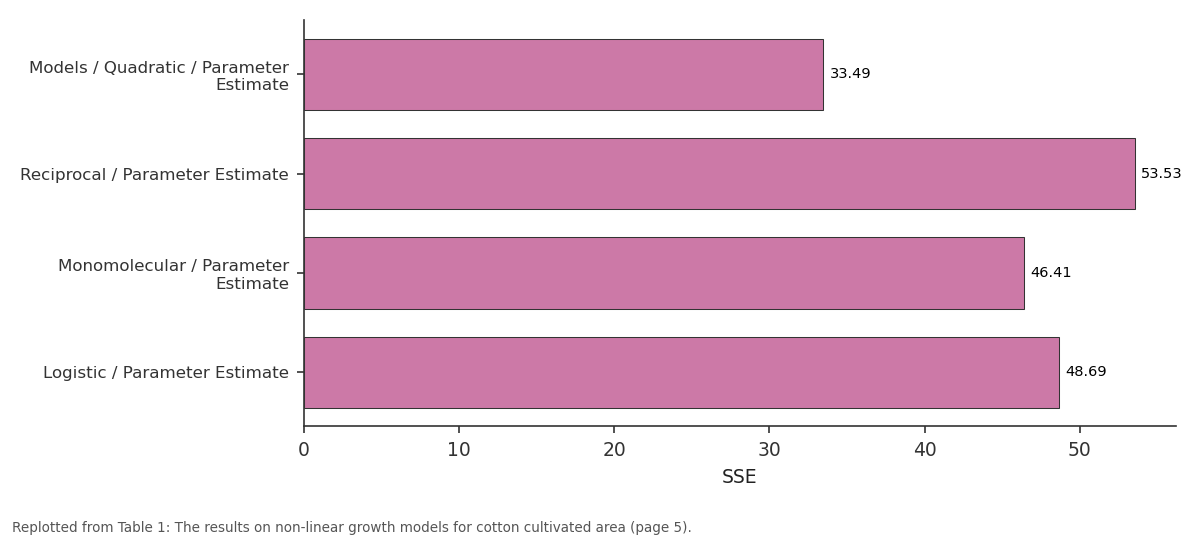
SSE: Models / Quadratic /... vs Reciprocal / Parameter... vs Monomolecular /... vs Logistic / Parameter...
Replotted from Table 1 (page 5) of the original paper. Every bar is the paper's own table value.
View source evidence ↗Figures & tables
From the original paper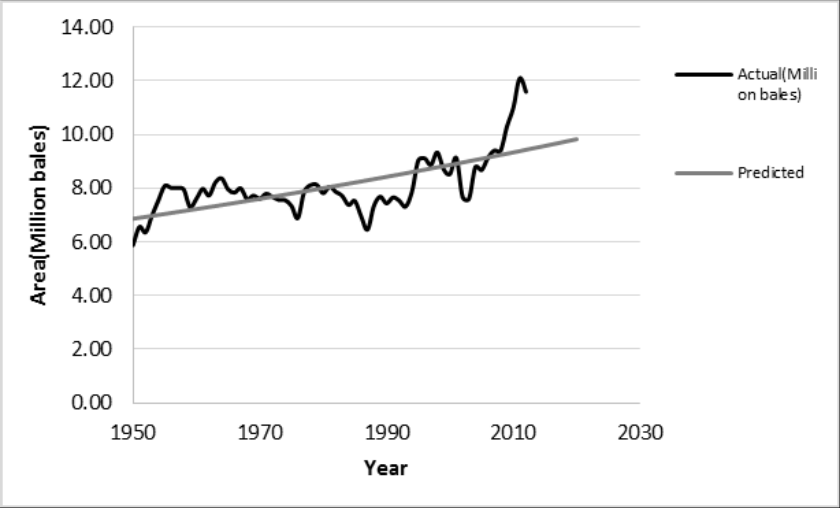 Figure 1
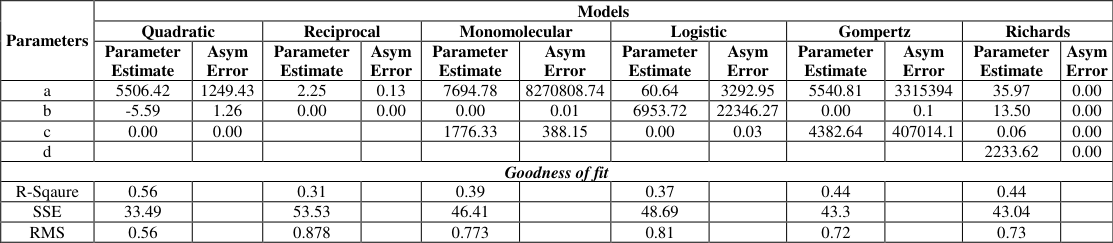 Table 1
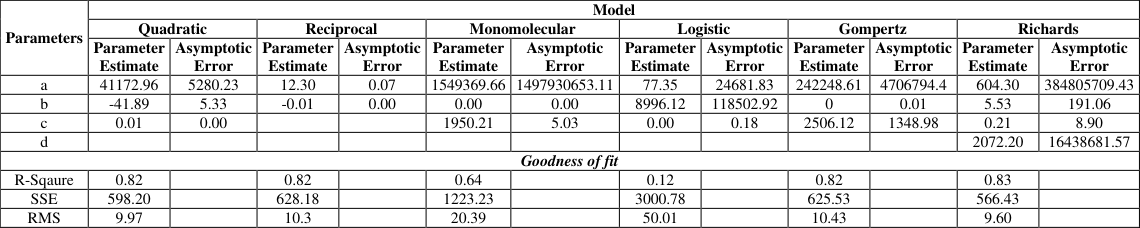 Table 2
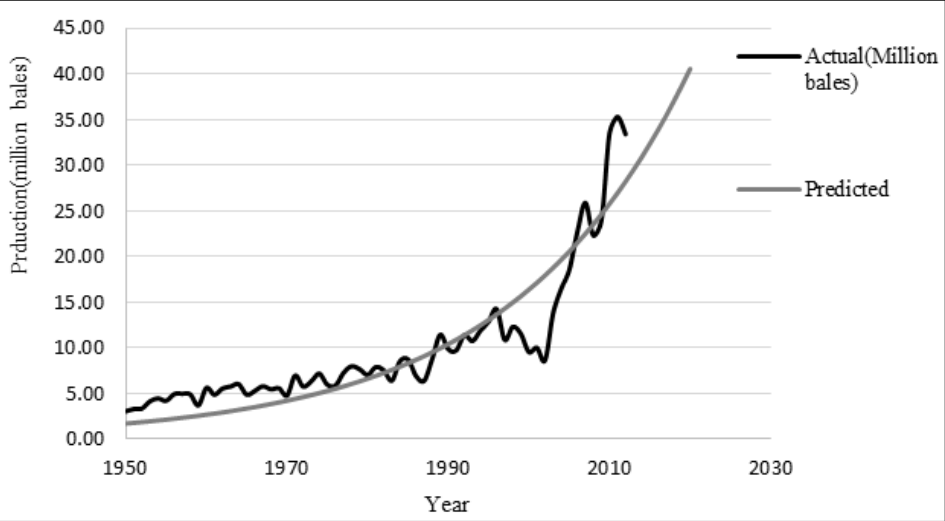 Figure 2
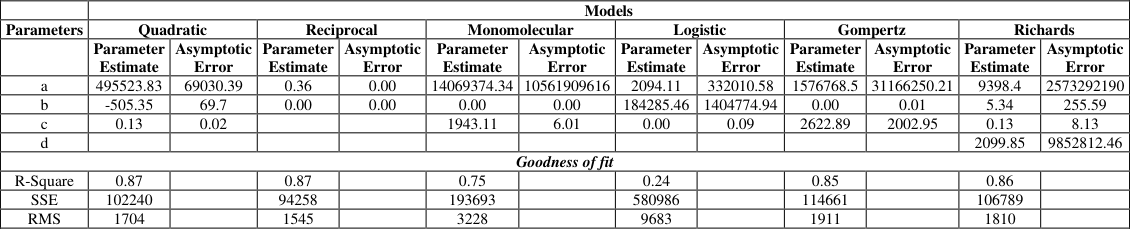 Table 3
 Table 4
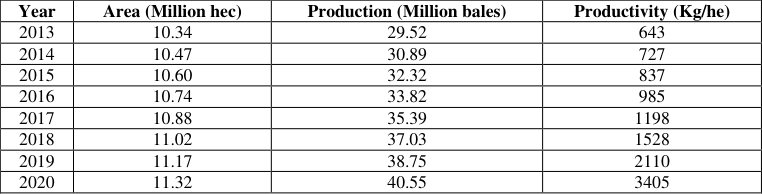 Table 5
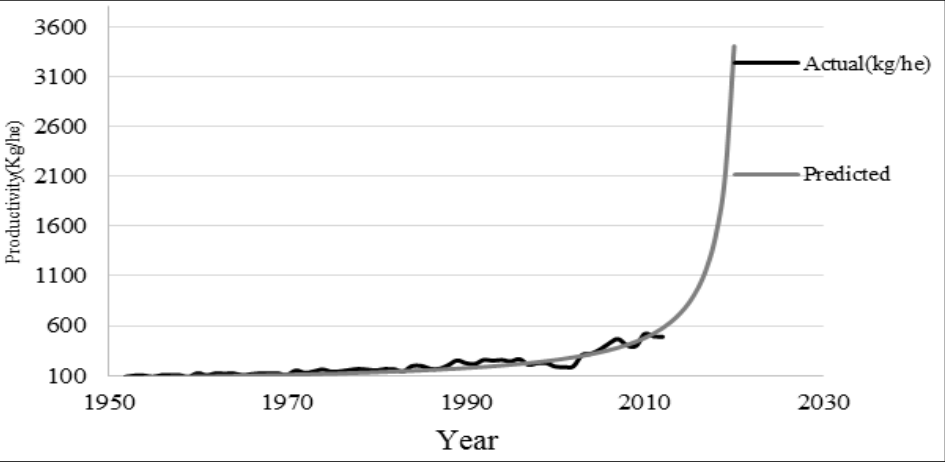 Figure 3
Introduction
Cotton is an important cash crop and India cultivates the highest acreage in the world. It provides the basic raw material (cotton fibre) to the cotton textile industry. Cotton also known as 'White Gold' dominates India's cash crops, and makes up 65 per cent of the raw material requirements of the Indian textile. Cotton play a vital role in economy in many cotton producing nations. India is the major cotton producing nation with 27 million bales production which is approximately account for 24% of global cotton production (2014). India has tripled cotton production form 13 million bales to 40 million bales and has doubled its market share of global cotton production form 12% in 2002 to 25% in 2014, representing a quarter of total global cotton production. The major cotton growing states in India are Punjab, Haryana, Rajasthan, Madhya Pradesh, Gujarat, Maharashtra, Andhra Pradesh, Tamil Nadu and Karnataka.
The main objective of this study was to focus on past and future trends of cotton area production and productivity in India by using appropriate nonlinear growth models analysis model. Many nonlinear theoretical/mechanistic models (Logistic, Gompertz, Monomolecular, Richards, Reciprocal and Quadratic) rather than empirical models. Growth rates analyses are widely employed to study the long-term trends in various agricultural crops (Panse, 1964) [14] . Reported that for area the second degree (Quadratic) polynomial; for production and productivity the first degree polynomial model were found suitable to fit the trend of tobacco crop grown in Gujrat state for the period of 1950-51 to 1990-91. In model discussed by Gan-Yan tai et al., (1996) [5] worked on evaluation of selected nonlinear regression models in quantifying seedling emergence rate of spring wheat. Prajneshu and Das (1998) [17] carried out a detailed study dealing with modelling of wheat production data at State level in post-Green revolution era. Specifically, several mechanistic nonlinear growth models, viz. monomolecular, logistic, Gompertz, mixed-influence and Richards were applied using Levenberg Marquardt procedure. The heartening feature of a mechanistic model is that the parameters have specific agricultural/ biological interpretation and provide insight into the underlying mechanism. Six major wheat growing States, viz. Punjab, Haryana, Uttar Pradesh, Madhya Pradesh, Rajasthan and Bihar were considered. For each of these States, it was found that logistic model has performed the best. These mechanistic models were employed in several other studies (Seber and Wild, 1989; Chandran K. P and Prajneshu, 2004) [24,3] . Prajneshu and Das (1998) [17] used the logistic and Gompertz nonlinear models for studying the comparative performance of various states in respect of wheat production. Growth models can provide a fitting data summary can be useful for forecasting future trends. Bergamasco et al. (2001) [1] attempted to study Non-linear models fitting to growth data in females of the Holstein heifers. Brody, Gompertz and Logistic models applied to growth data in Holstein heifers were evaluated. The proportion of area time-series data under high yielding varieties of wheat in India during post-Green revolution era was modelled by Prajneshu and Kandala (2002) through mixed-influence nonlinear growth model. Khamis et al. (2005) [8] studied the basic needs of parameters estimation for nonlinear growth model such as partial derivatives of each model and determination of initial values for each parameter. Mohanty et al., (2006) [12] analyzed the impact of puddling, tillage and residue management on wheat (Triticum aestivum L.) seedling emergence and growth in a rice-wheat system using nonlinear regression models. Zahedi and Jenner (2003) [27] defined the growth trend in wheat plants using the nonlinear Gompertz model. Gaddour et al. (2008) [6] analyzed on adjustment of the kid's growth curve in pure goat breeds and crosses under southern Tunisian conditions. Panwar et al. (2009) [16] developed nonlinear growth models to study onion export trend in India. Accordingly, Chandran and Prajneshu (2005a) [2] theoretically developed generalizations of monomolecular, logistic and Gompertz models and applied these to powdery mildew disease data of mango. Emphasized that plant growth was a fundamental ecological process and plant growth models are nowadays particularly important for describing biological processes with environmental conditions and provide the basis for more advanced researches in plant sciences. In model focused Wayan Surya Wardhani and Prawitra Kusumastut, (2013) [26] Logistic model that fitted the data of corn growth better, as it gave higher coefficient of determination. In discussed Koncagul and S. Cadirci (2009) [9] , lengths of growth period in Japanese quails selected fitted model. Narinc et al. (2010) [13] fitted several nonlinear growth models for modeling age-related changes of body weight growth in Japanese quail. Developed a 3parameter Iogistic model for describing wheat production and fitted it to the wheat-production data of India for 1950-91, using non-linear estimation procedure. The Gompertz models generally provided the best fit and adequately describe of the postnatal growth of many mammals and the growth path of chickens. Keeping above points in view, the present study was aimed to develop appropriate nonlinear statistical growth models with a view to provide analytical approach to describe the cotton area, production and productivity trends in India. Based on performance of models fits, three best nonlinear growth models were chosen for future projection of cotton crop trends in India. The Growth model approach is simple to understand and apply for projection of future trends, and is competent of curve fitting a whole range of different models. In this trend investigation studies on cotton will provide insight to policy makers, stake holders and researchers in policy making strategies on sustainable cotton production in the future.
Material and Methods
The present study has been conducted on area, production and productivity of cotton crop in India for the period 1980-2013. The cotton crop secondary data were collected from Cotton Corporation of India (CCI). In his study we have compared different models viz Logistic, Gompertz, Monomolecular, Richards, Reciprocal and Quadratic model for estimating the growth of cotton crop on area, production, and productivity to find the best fit using the statistical methods such as highest 2 R , Residual sum of square and Root mean square. Subsequently forecasted the cotton growth using the same statistical ncss software version 10. In this section we describe different growth models that can describe nonlinear curve fitting change patterns. Non -linear estimation is a general fitting procedure that will estimate any relationship between a dependent (or response variable), and a list of independent variables. This work will help for better forecast, and in developing nonlinear growth models for area, production and productivity of cotton for India. This modelling effort will help on one hand, to understand the past performance and on the other to forecast future possibility.
Linear and Non-linear models
A linear model is one which is directly proportional to input. In such a model, all the parameters appear linearly. In contrast to this, nonlinear model is one in which at least one of the parameters appear nonlinearly. For example, following equations:
(ii) represents a linear model, whereas equation:
Represents a nonlinear model. A consequence of nonlinearity is that it has curved solution locus, whereas linear model has straight line solution locus. We consider two types of nonlinear model given by following equation, respectively:
Although, both these models are nonlinear as the parameters A and B appear nonlinearly but they are of essentially different characters. Equ.(iv) can be transformed, by taking natural algorithm, into the form:
Which is linear in parameters. The model given in Equ(iv) is called intrinsically linear since it can be transformed into linear form. Equ(iii) however, cannot be converted into a form which is linear in parameters. Such a model is said to be intrinsically nonlinear (Draper and Smith, 1981) [4] .
Some important nonlinear growth models
A mathematical model is an equation or a set of equations which represents the behaviour of a system. We now discuss briefly some well-known nonlinear growth models. The following nonlinear growth models (Seber and Wild, 1989) [24] of Logistic, Gompertz, Monomolecular, Richards, Reciprocal and Quadratic etc., have been tried.
Monomolecular
This model describe the progress of a growth situation in which it is believed that the rate of growth at any time is proportional to the resources yet to be achieved by the equation. This model is represented by the equation:
Where symbols have their usual meaning.
Logistic Model
The parameters of this model have a simple physical interpretation. The mathematical form of the model is given by.
Gompertz Model
This model has sigmoid type of behavior and is found quite use full in the biological work. However, unlike logistics model, this is not symmetric about its point of inflexion. This model is given by.
Quadratic Model
The quadratic or second-order polynomial model results in the familiar parabola.
Richards Model
It is a four parameter growth model. It is proposed by Richards (1959) and is represented by: ]
The upper sign within the brackets is applicable when is positive and lower sign when ä lies in the range
Richards model is a generalization of logistic (when
). In such cases, the solution is to either study more advanced single-species growth models, such as Richard's model and mixed influence model, or apply non-parametric regression procedures (Chandran and Prajneshu, 2004) [3] .
Reciprocal Model
This model, known as the reciprocal or Shinozaki and Kira model, is mentioned in Ratkowsky (1989, page 89) and Seber (1989, page 362) [24] , and is given by
So we regress the reciprocal of the dependent variable upon the untransformed independent variables. The data were analysed using the non-linear as well as the nonparametric regression models and the conclusion is given based on the best model to study the trends and growth rate of cotton crop area, production and productivity in India.
Model Evaluation
The following measure of goodness of fit vis-a-via comparison among different competing model developed. The goodness of fit is examined by using the co-efficient of determination
appear in the literature. One of the most frequent mistakes occurs when the fits of a linear and a nonlinear model are compared by using the same 2 R expression but different variables. The 2 R is generally interpreted as a measure of goodness of fit of even the original nonlinear model, which is incorrect. Scott and Wild (1991) have given a real example where two models are identical for all practical purpose and yet have very different values of 2 R calculated on the transformed scales. Kvalseth (1985) [10] has emphasized that, although 2 R given by
This is most appropriate for nonlinear statistical model. It would be used as the coefficient of determination for fit. The potential range of values of this 2 R is well defined with end points corresponding to perfect fit and complete lack of fit, such as
for any reasonable model specification. For nonlinear models its value can be negative, if the selected model fit worse than the mean.
Residual sum of square (RSS)
The RSS is defined as Mean square error (MSE)
The smaller the value of MSE the better is the model.
Here n denotes the total number of observed values and p denotes the number of model parameter. Ratkowsky (1990) mentioned that MSE is the best goodness of fit statistic as it explicitly considers number of parameters in the definition.
Examination of residuals
As a measure of goodness of fit the residual analysis of the models is carried out. The main assumptions made in the models are i. Error are random ii. Errors are normally distributed.
To test whether the residuals are normally distributed Shapiro-Wilk test has been performed. If the fitted model is correct, the residuals should exhibit tendencies that tend to confirm or at least should not exhibit a denial of the assumptions. The procedure for carrying out the Shapiro-Wilk test has been explained in brief. Let 'm' be the number of positive signs, 'n' be the number of runs.
For large sample, the test statistic is
Result and Discussion
Results of the study shows that among the six models considered for India, converged (Table 1, 2 and 3). Further, the table reveals that difference between each model could explain area, production and productivity of cotton crop data, based on the goodness of fit statistics presented same tables given below.
| Parameters | Models | — | — | — | — | — | — | — | — | — | — | — |
|---|---|---|---|---|---|---|---|---|---|---|---|---|
| Quadratic | Reciprocal | Monomolecular | Logistic | Gompertz | Richards | |||||||
| Parameter Estimate | Asym Error | Parameter Estimate | Asym Error | Parameter Estimate | Asym Error | Parameter Estimate | Asym Error | Parameter Estimate | Asym Error | Parameter Estimate | Asym Error | |
| a | 5506.42 | 1249.43 | 2.25 | 0.13 | 7694.78 | 8270808.74 | 60.64 | 3292.95 | 5540.81 | 3315394 | 35.97 | 0.00 |
| b | -5.59 | 1.26 | 0.00 | 0.00 | 0.00 | 0.01 | 6953.72 | 22346.27 | 0.00 | 0.1 | 13.50 | 0.00 |
| c | 0.00 | 0.00 | 1776.33 | 388.15 | 0.00 | 0.03 | 4382.64 | 407014.1 | 0.06 | 0.00 | ||
| d | 2233.62 | 0.00 | ||||||||||
| Goodness of fit | ||||||||||||
| R-Sqaure | 0.56 | 0.31 | 0.39 | 0.37 | 0.44 | 0.44 | ||||||
| SSE | 33.49 | 53.53 | 46.41 | 48.69 | 43.3 | 43.04 | ||||||
| RMS | 0.56 | 0.878 | 0.773 | 0.81 | 0.72 | 0.73 |
Table text extracted from the original PDF; superscript letters are shown inline. The original table image is below.
View original table image
Trends in Area based on Non-linear Models
The result presented (Table 1) for the area under the cultivation of cotton crop revealed that among the different non-linear models fitted, the highest R-square (56%) was observed in case of Quadratic function with lowest value of SSE(33.49) and RMS (0.56) in comparison to that of other non-linear models. Based on the performance of these models, it found that Quadratic model is found to be best fit. All the parameters were found to be significant. Statistical tests for normality are more precise since actual probabilities are calculated. The above (Table 4) presents the results from the tests of normality are run. However the Shapiro-Wilks, test value 0.97 with p-value 0.17 (test for normality) was found to be non-significant the residuals due to this model. Moreover, run-test statistic (test for random value -1.39 which gives p=0.16 (Table 4) were found to be.
| Normality Test | Residual from the fitted model | — | — | — | — | — |
|---|---|---|---|---|---|---|
| Area | Production | Productivity | ||||
| Statistic | P. value | Statistic | P. value | Statistic | P. value | |
| Shapiro- Wilk | 0.97 | 0.17 | 0.92 | 0.00 | 0.91 | 0.00* |
| Randomness test | ||||||
| Run test z value | -1.39 | 0.16 | -4.95 | 0.00 | -5.72 | 0.00 |
Table text extracted from the original PDF; superscript letters are shown inline. The original table image is below.
View original table image
Conclusion
In conclusion, nonlinear models shows promising results when applied to data on cotton crop of India. The nonlinear models viz., monomolecular, logistic, gompertz, quadratic, richards and reciprocal model were applied for cotton crop in India. Based on performance of these fits, best non-linear models were chosen for the selected series. In the first instance, attempts were made to identify the model that best described this data set. It is evident, from the analysis, area, production and productivity of cotton is fluctuating and all six nonlinear models are suitable to fit. The intialization of parameter done results are compared using statistics such as, 2 R , residual sum of square and mean square error accuracy than their source model (Table1, 2 and 3). Run-test statistic 2). And also productivity selected for reciprocal as the goodness of fit comparing other models. The results with the shapiro-wilk test normality and runt test randomness criteria and the correlation characteristic are summarized in Table 5. A graphical representation of the adequacy of the fitted models is presented in Fig. 1, 2 and 3. Furthermore, nonlinear estimation techniques may contribute to determining of the economic information and marketing strategies in plant-based enterprises.
| Year | Area (Million hec) | Production (Million bales) | Productivity (Kg/he) |
|---|---|---|---|
| 2013 | 10.34 | 29.52 | 643 |
| 2014 | 10.47 | 30.89 | 727 |
| 2015 | 10.60 | 32.32 | 837 |
| 2016 | 10.74 | 33.82 | 985 |
| 2017 | 10.88 | 35.39 | 1198 |
| 2018 | 11.02 | 37.03 | 1528 |
| 2019 | 11.17 | 38.75 | 2110 |
| 2020 | 11.32 | 40.55 | 3405 |
Table text extracted from the original PDF; superscript letters are shown inline. The original table image is below.
View original table image
Figures and tables from the paper
References
25 in the original paper- Bergamasco AF, Aquino H-de L, Muniz JA. Non-linear models fitting to growth data in females of the Holstein heifers, Ciencia-e-Agrotecnologia, 2001; 25(2):235-241.
- Chandran KP, Prajneshu. Computation of growth rates in agriculture: Nonparametric regression approach. Journal of the Indian Society of Agricultural Statistics. 2004; 57:382-392.
- Draper NR, Smith H. Applied regression analysis, 2 nd ed., John wiley, New York. 1981, 382-92.
- Gan-YanTai, Stobbe EH, Njue C. Evaluation of selected nonlinear regression models in quantifying seedling emergence rate of spring wheat, Crop-Science, Canada, 1996; 36(1):165-168.
- Gaddour A, Najari S. Adjustment of the kid's growth curve in pure goat breeds and crosses under southern Tunisian conditions. Journal of Applied Animal Research. 2008; 34(2):117-120.
- Gunartha L. Mechanistic models in lettuce growth. Ph. D. Thesis. University of Sidney. Australia, 1995.
- Khamis A, Ismail Z, Haron K, Mohammed AT. Nonlinear growth models for modeling oil palm yield growth, J. Mathematics & Statistics, 2005; 1(3):225-233.
- Koncagul S, Cadirci S. Comparison of three non-linear models when data truncated at different lengths of growth period in Japanese quails. European Poultry Science. 2009; 73(1):7-12.
- Kvalseth TO. Cautionary note about R 2 , Amer, Statistician, 1985; 39:279-8.
- Mohanty M, Painuli DK, Misra AK, Bandyopadhyaya KK, Ghosh PK. Estimating impact of puddling, tillage and residue management on wheat (Triticum aestivum,L.) seedling emergence and growth in a rice-wheat system using nonlinear regression models, Soil and Tillage Research, 2006; 87(1):119-130.
- Narinc D, Karaman E, Firat MZ, Aksoy T. Comparison of nonlinear growth models to describe the growth in Japanese quail, J. Animal & Veterinary Advances. 2010; 9(14):1961-1966.
- Panse VG. Yield trends of rice and wheat in first two five-year plans in India. J. Ind. Soc. Agric. Statistics. 1964; 16:1-50.
- Paine CE, Marthews TR, Vogt DR, Purves D, Rees M, Hector A et al. How to fit nonlinear plant growth models and calculate growth rates: an update for ecologists. Methods in Ecology and Evolution. 2012; 3(2):245-256.
- Panwar S, Sharma SC, Kumar A. A critical study of onion (Allium cepa) export of India: non-linear approach, Indian J. Agric. Sci. 2009; 73(3):178.
- Prajnesu, Das PK. Modelling wheat (Triticum aestivum) production at state level in post-green revolution era. Indian Journal agricultural Sciences. 1998; 68(I):23-6.
- Prajneshu, Kandala VM. Mixed-influence nonlinear growth model. J. Ind. Soc. Ag. Stat. 2003; 56:19-24.
- Prajneshu, Chandran KP. Computation of compound growth rates in agriculture: Revisited. Agricultural Economics Research Review, 2005; 18:317-32.
- Ratkowsky DA. Statistical properties of alternative parameterization of the von Bartalanffy growth curve. Can. J. Fish. Aquat. Sci. 1986; 43:742-747.
- Royston JP. An extension of Shapiro and Wilk's W test for normality to large samples. Appl. Stat. 1982; 31:115124.
- Richards FJ. A flexible growth function for empirical use. Journal of Experimental Botany. 1959; 10:290-300.
- Shapiro SS, Wilk MB. An analysis of variance test for the exponential distribution (complete samples), Technometrics. 1972; 14:355-370.
- Seber GAF, Wild CJ. Nonlinear regression, John Wiley, 1989.
- Syariffudin M, Abdullah R, Abdul SR. Adapting Runs Test as Pattern Generator for Protein Secondary Structure Recognition, 2nd IMT-GT Regional conference on mathematics, statistics and Application University sains Malaysia, Penang, 2006, 13-15.
- Wardhani WS, Kusumastuti P. Describing the height growth of corn using logistic and gompertz model. Agrivita, 2013; 35(3):237.
- Zahedi M, Jenner CF. Analysis of effects in wheat of high temperature on grain filling attributes estimated from mathematical models of grain filling. Journal of Agric. Sci. 2003; 141:203-212.
Cited by 1
From OpenAlex, OpenCitations and reference lists read by Scinovex
- Analysis of trends in arrivals and prices of arecanut in selected markets of Karnataka
Siddeshwari Tamgond, Sachindra Babu, H. Manjunatha, R Devaraju, Y. Nagaraju, Akshay Kumar · International Journal of Agriculture Extension and Social Development · 2026
Aim: To analyse the trends in arrivals and prices of arecanut in selected major markets of Karnataka and identify the most suitable models for describing long-term market behaviour.Study Design: The study utilized annual arrivals and modal price data of arecanut from five major markets of Karnataka, namely Shivamogga, Sirsi, Sagara, Channagiri, and Yellapura, covering the period from 2007 to 2023. Linear and non-linear trend models were fitted and compared using statistical criteria.Place and Duration of Study: The study was conducted using secondary data collected from Krishi Marata Vahini an