
Research article · 2017 · Full text
International Journal of Statistics and Applied MathematicsReliability analysis of a model with regard to undertaking the failed unit by ordinary or expert repairman with the concept of instruction and replacement time
Volume 2(6) · Pages 216–222
Research areasReliability and Maintenance Optimization
Abstract
Author-writtenThe present paper introduces the instruction time and the possibility that ordinary repairman may damage the unit to the extent that: (i) it rather goes to more degraded stage but repairable (ii) it may become irreparable and hence replaced. Two-unit cold standby system is examined with the assumptions that every failed unit first goes under the repair of ordinary repairman who starts repair after getting instructions from expert. The model has been analyzed by making use of Semi-Markov Processes and regenerative point technique. Various measures of system effectiveness including profit incurred have been evaluated. Various conclusions have been drawn through graphical study for a particular case.
Summary
Source-checkedPlain-language reading of the full paper, prepared with AI and checked against the text. Each point links to the authors' own words.
Why it matters
- Redundancy, specifically through two-unit standby systems, is commonly used to improve the reliability of various systems. View evidence ↗
- Using an expert repairman for all tasks is costly, leading to the use of ordinary repairmen who may require instructions from an expert for complex tasks. View evidence ↗
- Ordinary repairmen may accidentally damage a unit during repair, either worsening its condition or making it irreparable, necessitating a full replacement. View evidence ↗
What they did
- The researchers investigated a two-unit cold standby system that utilizes a specific repair policy involving both instructions and unit replacement. View evidence ↗
- The model assumes that failure times follow exponential distributions, while other time distributions are treated as arbitrary. View evidence ↗
- The system was analyzed using the regenerative point technique and Semi-Markov Processes. View evidence ↗
What they found
- For a specific case (where failure rate = 0.05 and repair rate = 1), the Mean Time to System Failure (MTSF) was 340.4345 and the system availability was 0.9105324. View evidence ↗
- System profit is negatively impacted by an increasing failure rate and positively impacted by a higher repair rate. View evidence ↗
- The failure rate threshold for maintaining a positive profit increases as the repair rate increases: from 0.0964 at =1 to 0.112 at =2. View evidence ↗
- Profit increases as system revenue (C0) increases and decreases as the cost associated with the expert repairman (C2) increases. View evidence ↗
- Profit decreases as the cost of expert visits (C5) increases, but improves when the instruction rate () is higher. View evidence ↗
- Increasing the replacement cost (C7) reduces profit, while a higher replacement repair rate (4) increases it. View evidence ↗
- Profit increases when there is a higher probability that the ordinary repairman can complete the repair (p1) and a higher probability that the resume repair policy is adopted (a). View evidence ↗
What it means
- The authors conclude that system effectiveness and profit can be evaluated and optimized by analyzing the relationships between failure rates, repair rates, and associated costs. View evidence ↗
Figures & tables
From the original paper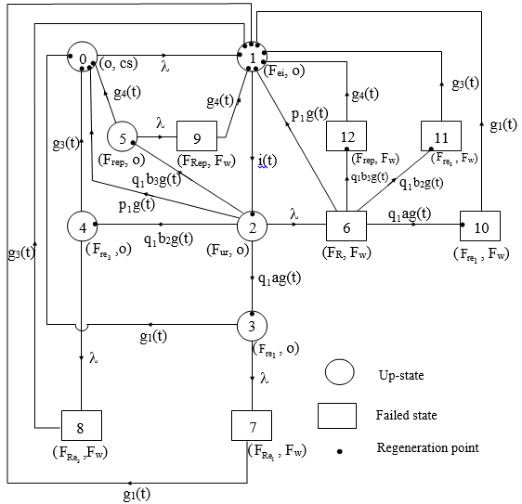 Figure 1
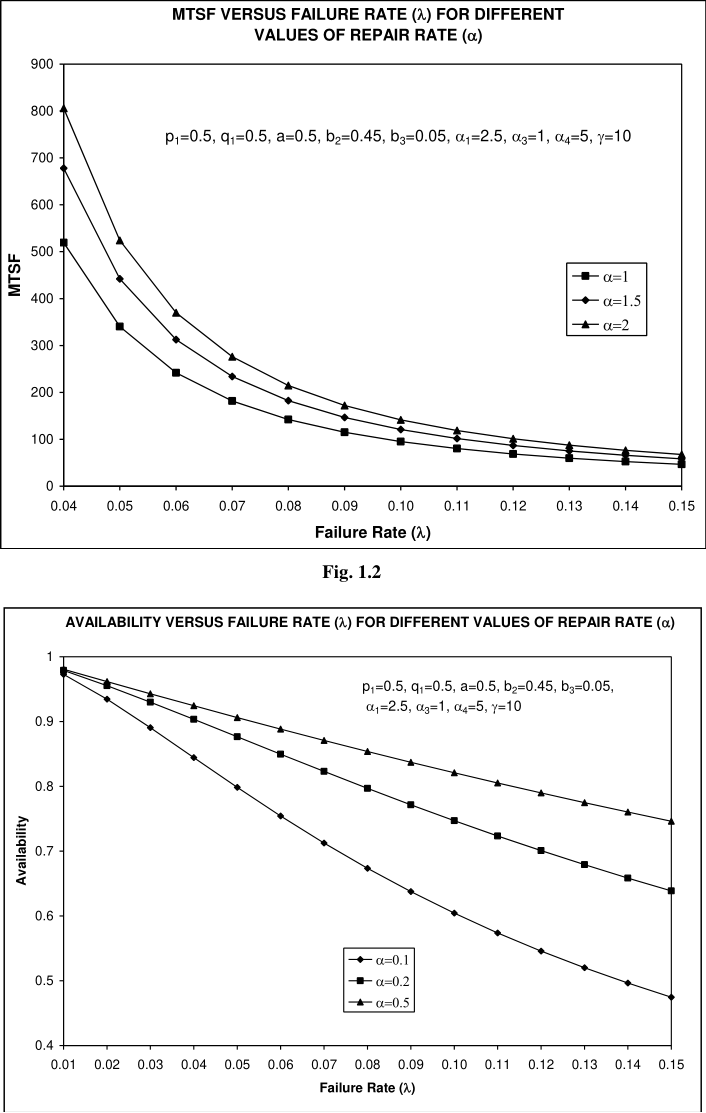 Figure 1
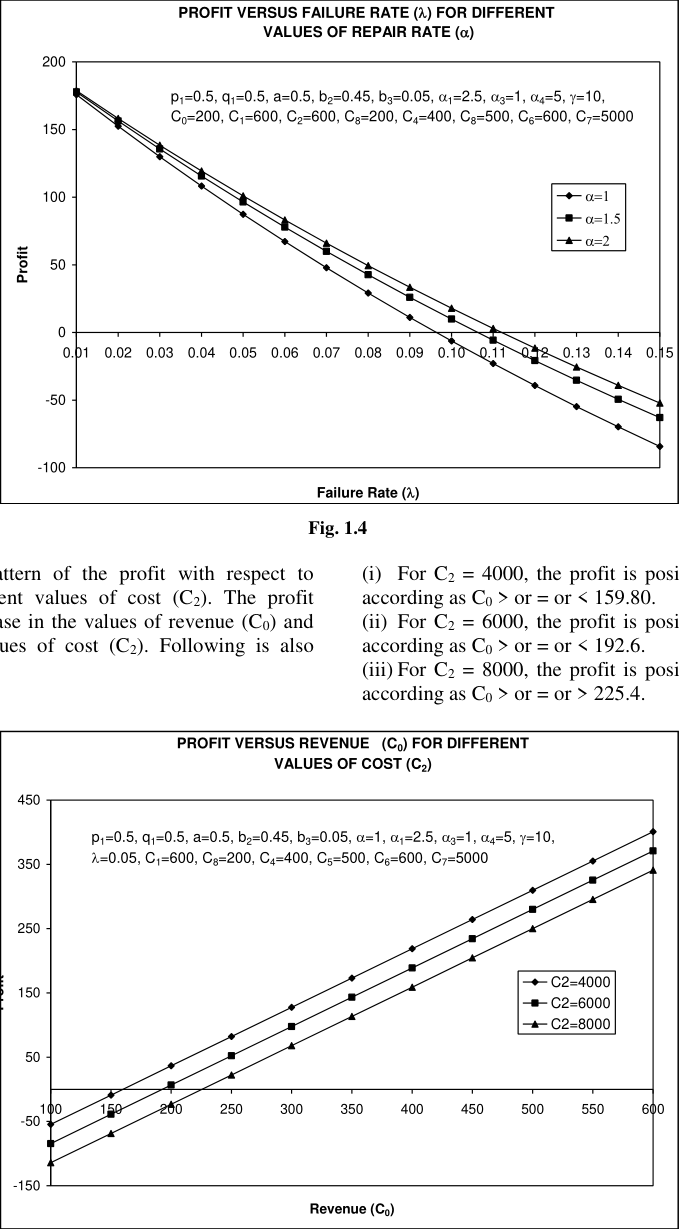 Fig. 1
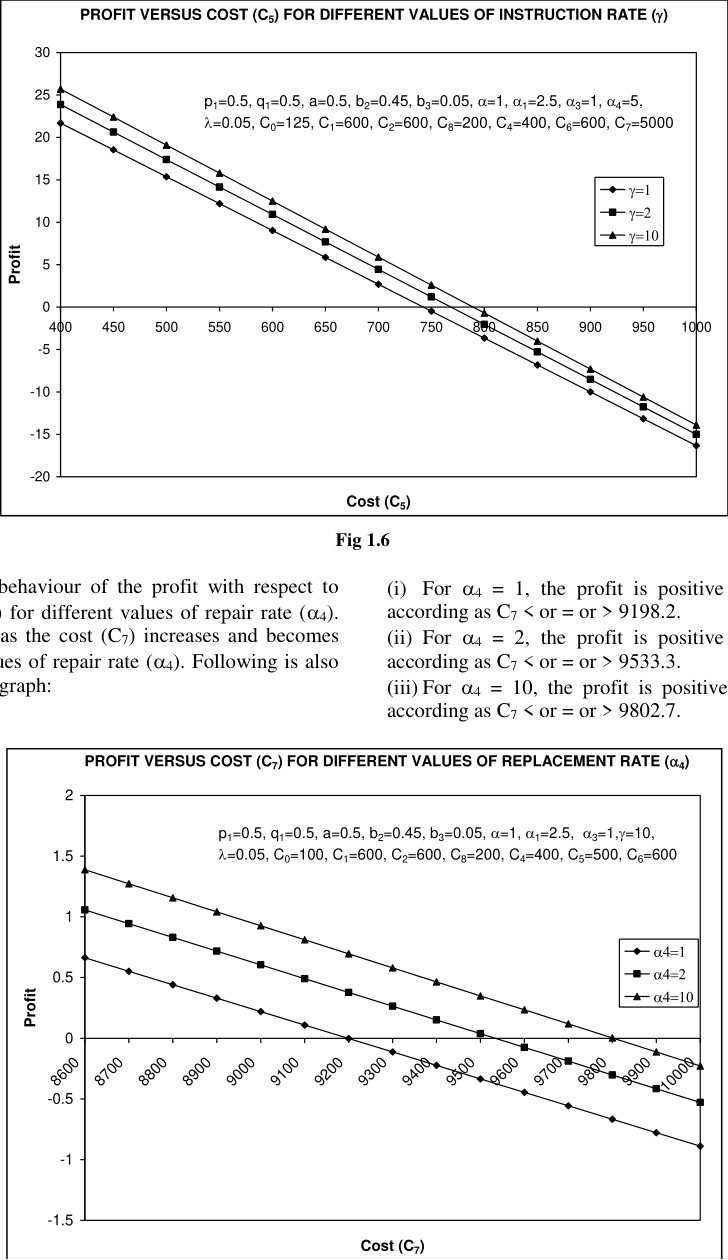 Fig. 1
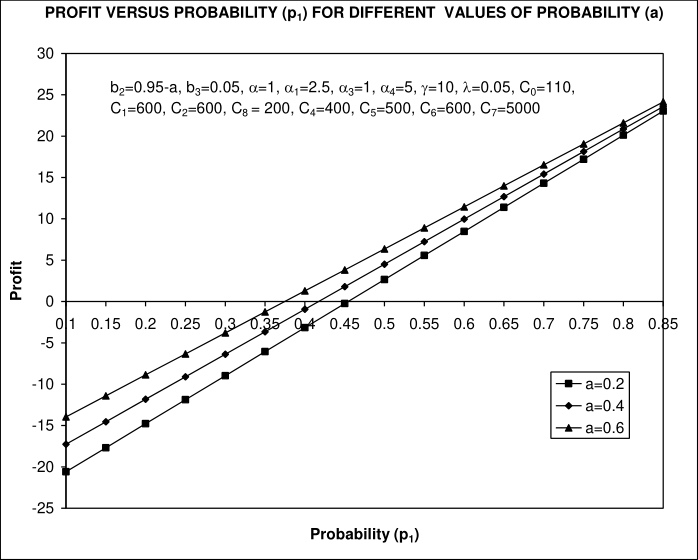 Figure 1
Introduction
In order to increase the reliability, concept of redundancy is used by the users of various systems. As a result, two-unit standby systems have widely been studied in the field of reliability. Concept of two types of repairman has been considered in some of these studies including [3][4][5][6][7] wherein one of the repairman had been taken as an ordinary and the other as an expert. The ordinary repairman may not be able to do some complex repairs and then an expert comes. Long stay of the expert with the system may be costly and hence idea of instruction time was introduced by Kumar et al [8] . There may also be situations when the ordinary repairman even after getting the instruction may damage the failed unit during his try for repair. This leads to the unit in more degraded stage and sometimes to a stage where we are left with no other option but to replace it by a new one. The purpose of the present study is. 1. to introduce redundancy 2. to introduce a new type of repair policy which is defined as : "when the ordinary repairman makes the unit damaged and leads it to more degraded stage due to mishandling, it is undertaken by the expert at much earlier stage than the stage at which its repair has been started by the ordinary repairman" 3. to make the replacement when the failed unit is made no more repairable by the ordinary repairman 4. To reduce the stay of the expert. The present paper, therefore, investigates two-unit cold standby system introducing the aforesaid repair policy together with instruction and replacement. The additional assumptions taken for the model is that every failed unit first goes under the repair of ordinary repairman who starts repair after getting instructions from expert. Failure times are assumed to follow exponential distributions whereas other time distributions are arbitrary. Other assumptions are as usual.
The system has been analysed by making use of Semi-Markov Processes and regenerative point technique. Various measures of system effectiveness including profit incurred have been evaluated. Various conclusions have been drawn through graphical study for a particular case.
Notations
: constant failure rate of a unit 1 p : probability that the ordinary repairman is able to complete the repair 1 q : probability that the ordinary repairman is unable to complete the repair a : probability that resume repair policy is adopted b2 : probability that unit is damaged but repairable b3 : probability that the unit is damaged but irreparable g(t), G(t) : p.d.f. and c.d.f. of the repair time of the ordinary repairman g1(t) G1(t) : p.d.f. and c.d.f. of repair time of the expert repairman when resume repair policy is adopted g2(t), G2(t) : p.d.f. and c.d.f. of repair time of the expert repairman when repeat repair policy (type-I) is adopted g3(t), G3(t) : p.d.f. and c.d.f. of repair time of the expert repairman when repeat repair policy (type-II) is adopted g4(t), G4(t) : p.d.f. and c.d.f. of replacement time i(t), I(t) : p.d.f. and c.d.f. of time when expert gives instruction to ordinary repairman Symbols for the state of system are o: operative unit cs: cold standby unit Fr: failed unit under repair of ordinary repairman FR: repair of the failed unit by the ordinary repairman is continuing from previous state 1 re F : Failed unit under repair of the expert repairman when resume repair policy is adopted The nonzero elements pij are: The mean sojourn time (i) in state i are
The unconditional mean time taken by the system to transit for any state j when it is counted from epoch of entrance into state i is mathematically stated as
Profit Analysis
The expected total profit incurred to the system in steadystate is given by
Where C0 = revenue per unit up time of the system C1 = cost per unit time for which the ordinary repairman is busy for repairing the failed unit C2 = cost per unit time for which the expert repairman is busy for repairing the unit C4 = cost per visit of the ordinary repairman C5 = cost per visit of the expert repairman. C6 = per unit time for which the repairman is busy for replacing the unit C7 = cost per replacement C8 = cost per unit time for which the expert repairman is busy in giving the instructions to the ordinary repairman
Particular Case
For graphical interpretation, the following particular case is considered
Graphical Interpretation
The above particular case is considered for the graphical interpretation.
Figs. 1.2 and 1.3 show the behaviour of MTSF and Availability with respect to failure rate (). It is observed that both MTSF and Availability get decreased with increase in the values of failure rate () and have higher values for higher values of repair rate (). The profit decreases as the failure rate () increases and is higher for higher values of . Following is also observed from the graph:
(i) For = 1, the profit is positive or zero or negative according as < or = or > 0.0964. (ii) For = 1.5, the profit is positive or zero or negative according as < or = or > 0.106. (iii) For = 2, the profit is positive or zero or negative according as < or = or > 0.112. Fig. 1.5 reveals the pattern of the profit with respect to revenue (C0) for different values of cost (C2). The profit increases with the increase in the values of revenue (C0) and is lower for higher values of cost (C2). Following is also observed:
MTSF VERSUS FAILURE RATE () FOR DIFFERENT VALUES OF REPAIR RATE ()
(i) For C2 = 4000, the profit is positive or zero or negative according as C0 > or = or < 159.80.
(ii) For C2 = 6000, the profit is positive or zero or negative according as C0 > or = or < 192.6.
(iii) For C2 = 8000, the profit is positive or zero or negative according as C0 > or = or > 225.4. Following inferences can also be made through the graph:
(i) For = 1, the profit is positive or zero or negative according as C5 < or = or > 742.4.
(ii) For = 2, the profit is positive or zero or negative according as C5 < or = or > 768.5.
(iii) For = 10, the profit is positive or zero or negative according as C5 < or = or > 789.4. The profit decreases as the cost (C7) increases and becomes higher for higher values of repair rate (4). Following is also observed through the graph:
(i) For 4 = 1, the profit is positive or zero or negative according as C7 < or = or > 9198.2.
(ii) For 4 = 2, the profit is positive or zero or negative according as C7 < or = or > 9533.3.
(iii) For 4 = 10, the profit is positive or zero or negative according as C7 < or = or > 9802.7.
References
9 in the original paper- Gupta Suresh Kumar, Gupta Rashmi. Analysis of a Reliability Model with Instruction and Two of the Three Types of Repair Policy. Journal of the Indian Association for Productivity, Quality and Reliability. 2017; 41(2):139-153.
- Gupta SK, Gupta Rashmi. Economic Analysis of a Relaiablility Model for Two-Unit Cold Standby System with Three Types of Repair Policy. Aryabhatta Journal of Mathematics & Informatics. 2016; 8(2):243-252.
- Goyal V, Murari K. Cost analysis of a two-unit standby system with two types of repairman Microelectron. Reliab. 1984; 24:849-855.
- Gupta KC, Taneja AK. Comparative study of two models for a two-unit standby system with instructions and two types of repairman, J. Indian Soc. Stat. Opers. Res. 2002; XXIII(1-4):23-39.
- Kumar A, Gupta SK, Taneja G. Comparative study of the profit of a two server system including patience time and instruction time. Microelectron. Reliab. 1996; 36(10):1595-1601.
- Tuteja RK, Taneja G. Cost-benefit analysis of a twoserver, two-unit, warm standby system with different types of failure, Microelectron. Reliab. 1992; 32:13531359.
- Taneja G, Naveen V, Madan DK. Reliability and profit analysis of a system with an ordinary and an expert repairman wherein the latter may not always be available. Pure and Applied Mathematika Science. 2001; LIV(12):11-25.
- Kumar A, Gupta SK, Taneja G. Probabilistic analysis of a two-unit cold standby system with instructions at need. Micelectron. Reliab. 1995; 35(5):829-832.
- Rander MC, Kumar S, Kumar A. Cost analysis of two dissimilar cold standby system with preventive maintenance and replacement of standby, Microelectron. Reliab. 1994; 34(7):171-174.