
Research article · 2019 · Full text
International Journal of Advanced Biochemistry ResearchA study on correlation between fasting & post-prandial serum triglycerides and severity of stroke-at a tertiary care hospital
Volume 3(2) · Pages 21–25 · DOI: 10.33545/26174693.2019.v3.i2a.37 ↗
Research areasPharmacy and Medical PracticesNeurological Disease Mechanisms and Treatments
Abstract
Author-writtenAim & Objective of the study: The aim of this study is to investigate if serum TG levels predict stroke severity on admission with correlation of fasting and post-prandial serum TG levels Results: Of the 80 patients studied, 54 were males and 26 were females. Among the males, 42 had FTG≤2.3mmol/l and 12 had FTG levels >2.3mmol/l & 27 had PPTG≤2.3mmol/l and 27 had PPTG levels >2.3mmol/l. Of the 26 females 18 had FTG≤2.3mmol/l and 8 patients had FTG levels >2.3mmol/l & 15 had PPTG≤2.3mmol/l and 11 had PPTG levels >2.3mmol/l. In this study the number of patients with severe stroke (SSS≤25) were 20 of which 15 had F TG≤2.3mmol/l and only 5 patient had F TG>2.3mmol/l & 9 had PPTG≤2.3mmol/l and 12 had PPTG>2.3mmol/l. Out of 80 patients, 44 were hypertensive and 32 had FTG≤2.3mmol/l and 12 had FTG>2.3mmol/l & 19 had PPTG≤2.3mmol/l and 25 had PPTG>2.3mmol/l of the remaining 36 non hypertensive patients, 30 had FTG≤2.3mmol/l and 6 had FTG>2.3mmol/l & 25 had PPTG≤2.3mmol/l and 11 had PPTG>2.3mmol/l. 16 were IHD patients of which 12 had FTG≤2.3mmol/l and 4 had FTG>2.3mmol/l & 8 had PPTG≤2.3mmol/l and 8 had PPTG>2.3mmol/l & of the remaining 64 patients, 50 had FTG≤2.3mmol/l and 14 had FTG>2.3mmol/l & 30 had PPTG≤2.3mmol/l and 34 had PPTG>2.3mmol/l. The levels of serum FTG were not influenced by hypertension, IHD, age and sex of an individual but the level of serum PPTG were influenced by HTN. Conclusion: 1 In this study, mean serum fasting & post prandial serum triglyceride levels were not significantly associated with the severity of the stroke. As per this study hypertension, IHD, age and sex of an individual do not influence levels of serum fasting triglyceride levels but the serum post prandial triglyceride level were influenced by HTN.
Summary
Source-checkedPlain-language reading of the full paper, prepared with AI and checked against the text. Each point links to the authors' own words.
Why it matters
- Stroke is the most frequent and important neurologic disease in adult life, representing up to 20% of all central nervous system disorders in urban India. View evidence ↗
- Recent research suggests that postprandial triglyceride levels may be more strongly associated with metabolic syndrome and cardiovascular events than fasting triglyceride levels. View evidence ↗
- Because humans spend the majority of their time in a postprandial state, their arteries are primarily exposed to postprandial plasma. View evidence ↗
The question
- The study aimed to determine if fasting and postprandial serum triglyceride (TG) levels could predict the severity of stroke upon admission. View evidence ↗
What they did
- Stroke severity was measured using the Scandinavian Stroke Scale (SSS), with patients categorized as having severe stroke (SSS ≤ 25) or mild/moderate stroke (SSS > 25). View evidence ↗
- Fasting and postprandial serum triglyceride levels were measured using commercial kits between 12 and 36 hours after the onset of the stroke. View evidence ↗
- Hypertriglyceridemia was defined as a triglyceride level greater than 2.3 mmol/l. View evidence ↗
What they found
- There was no statistically significant association (at the 5% level) between fasting triglyceride (FTG) or postprandial triglyceride (PPTG) levels and stroke severity as measured by the SSS. View evidence ↗
- A statistically significant association (at the 5% level) was found between postprandial triglyceride (PPTG) levels and hypertension. View evidence ↗
- While fasting triglyceride (FTG) levels were not influenced by age, sex, ischemic heart disease (IHD), or hypertension, postprandial triglyceride (PPTG) levels were influenced by hypertension. View evidence ↗
- No statistically significant association was observed between the sex of the individual and either fasting or postprandial triglyceride levels. View evidence ↗
- No statistically significant association was found between age and either fasting or postprandial triglyceride levels. View evidence ↗
What it means
- The authors conclude that postprandial serum triglyceride levels should be measured when assessing stroke severity. View evidence ↗
- Because patients with hypertension showed higher postprandial triglyceride values and an increased risk for stroke, the authors recommend encouraging dietary and lifestyle modifications. View evidence ↗
Visual summary
3 visualsIllustrations explain the paper; charts are replotted from the paper's own table values.
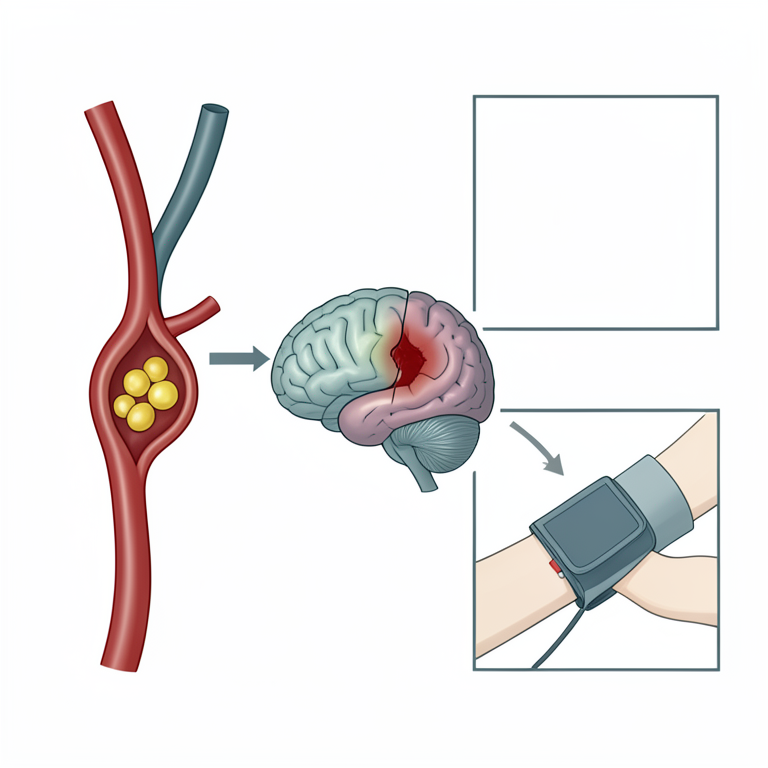
Study Variable Relationship Map
AI-generated conceptual illustration (human brain and blood vessels). It explains the idea and does not show study data.
View source evidence ↗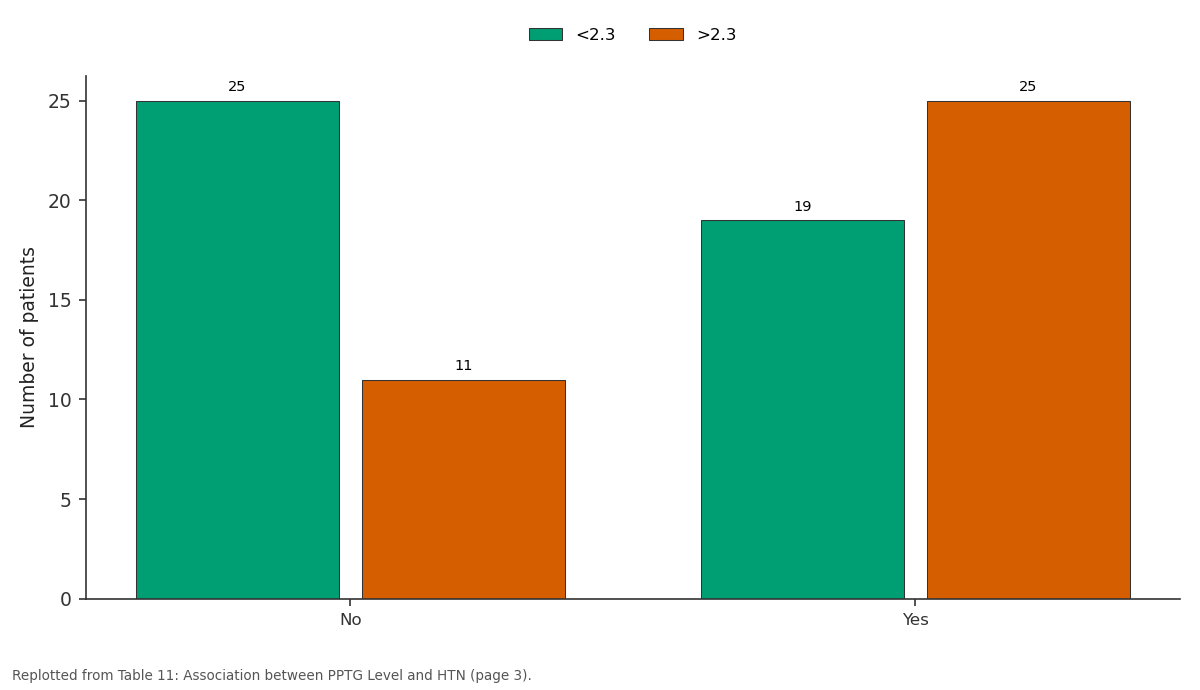
<2.3 and >2.3: No vs Yes
Replotted from Table 11 (page 3) of the original paper. Every bar is the paper's own table value.
View source evidence ↗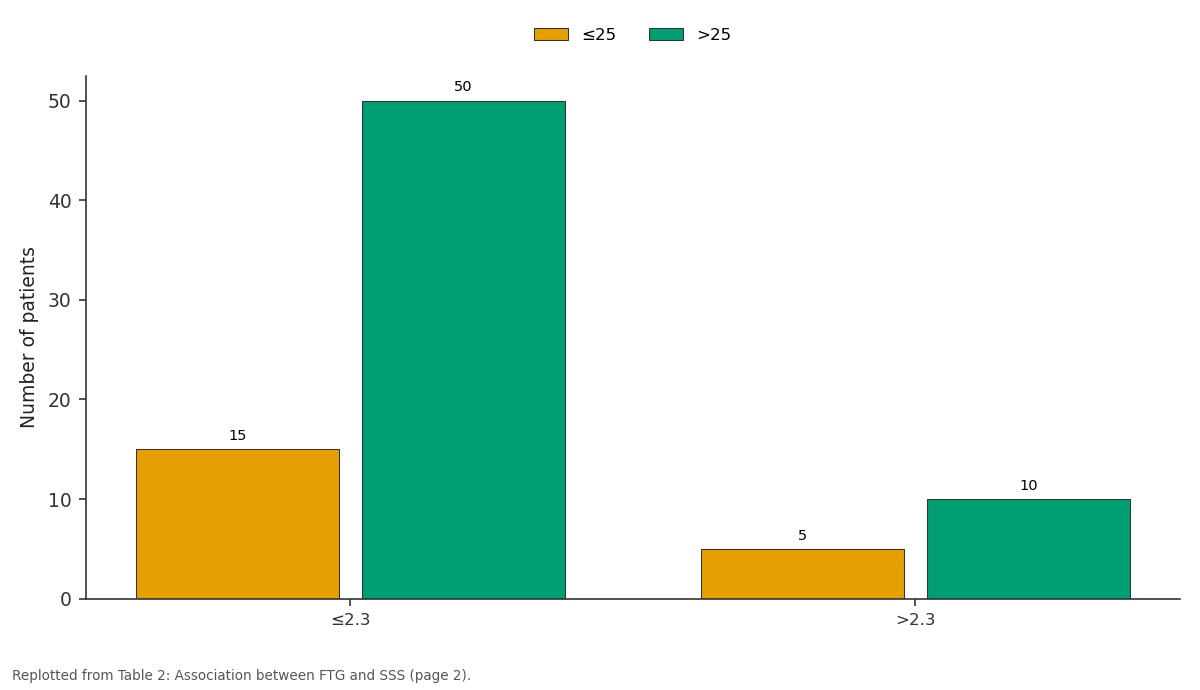
≤25 and >25: ≤2.3 vs >2.3
Replotted from Table 2 (page 2) of the original paper. Every bar is the paper's own table value.
View source evidence ↗Figures & tables
From the original paper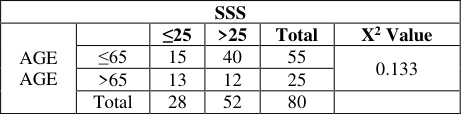 Table 1
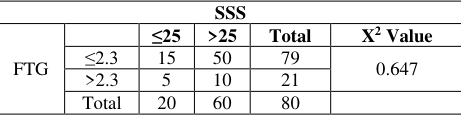 Table 2
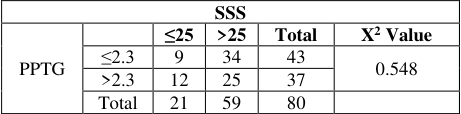 Table 3
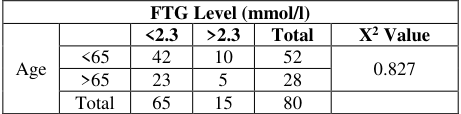 Table 4
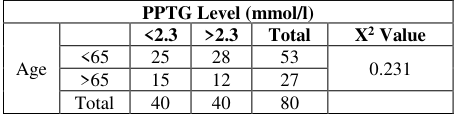 Table 5
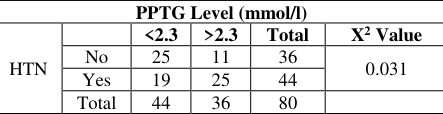 Table 11
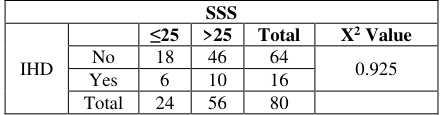 Table 12
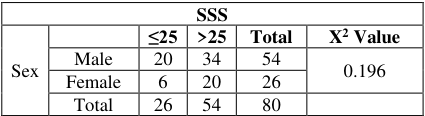 Table 6
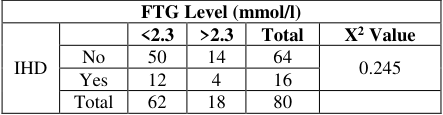 Table 13
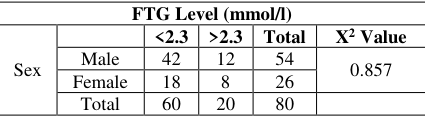 Table 7
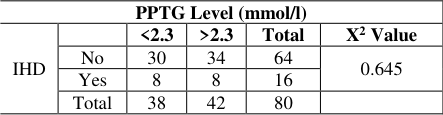 Table 14
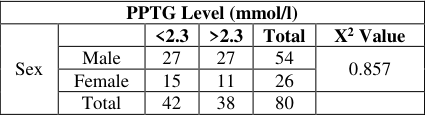 Table 8
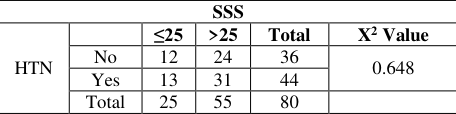 Table 9
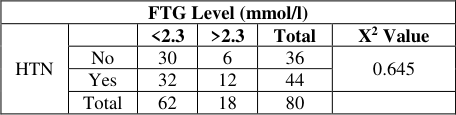 Table 10
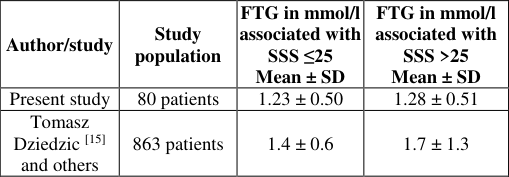 Table 15
Introduction
Among all the neurologic diseases of adult life, the stroke clearly rank first in frequency and importance accounting upto 20% of all central nervous system disorders, in the urban sectors of India. Stroke is defined as an abrupt neurologic deficit that is attributable to focal vascular cause. Risk factors for stroke include hypertension, carotid stenosis, atrial myxomas, smoking, hyperlipidemia, diabetes, myocardial infarction and atrial fibrillation. The link between hyperlipidemia and stroke, was more difficult to establish. The difficulty arose in part because of the heterogeneous nature of stroke. To investigate a possible etiologic relationship between hyperlipidemia and stroke, it became essential to distinguish ischemic from hemorrhagic stroke. It now appears likely that hyperlipidemia is an independent risk factor for ischemic stroke. Humans spend most of their time in a postprandial state, not in a fasting state, and their arteries are thus exposed to postprandial plasma most of the time. One would thus surmise that postprandial lipid values would correlate better with prognosis than fasting values.
Postprandial TG has been suggested as an independent risk factor for cardiovascular disease (CVD) in healthy subjects [1][2][3] . Several studies support the hypothesis postprandial TG is correlated with carotid IMT and waist circumference (WC), and furthermore superior to fasting TG in association with metabolic syndrome [4][5][6] . However, the potential effects of postprandial hypertriglyceridemia on the development of atherosclerosis are still controversial in subjects with type 2 diabetes (T2D) [7] . This study is undertaken to correlate fasting and postprandial serum triglyceride levels with severity of stroke as measured by Scandinavian stroke scale.
Materials and Methods
Materials and Methods
Source of Data
Eighty consecutive patients presenting with acute ischemic stroke, occurring within 24 hours, confirmed by CT scan admitted in Bhaskar Medical College & General Hospital from January 2018 to June 2019 were included in this study and in each patient fasting and post prandial serum TG levels were estimated.
Inclusion Criteria
Patients with first attack of ischemic stroke occurring within 24 hours, confirmed by CT scan, admitted to Bhaskar Medical College, RR District, Telangana, India.
Exclusion Criteria
Patients admitted to the hospital >24 hours after stroke onset. Previous history of stroke. Previous history of transient ischemic attack. Haemorrhagic stroke. Patients with space occupying lesions. Patients with CVT.
Method of Collection of Data
A CT scan head (MRI brain where required) was taken within 24 hours after stroke onset for all patients with first ever stroke admitted in Bhaskar Medical College and hospital. Stroke severity on admission was assessed using Scandinavian stroke scale (SSS). The patients were divided into 2 groups: those with severe stroke (SSS ≤ 25) and those with mild/moderate stroke (SSS >25). Arterial hypertension was diagnosed when at least 2 readings of blood pressure were ≥ 140 mm Hg (systolic) or ≥ 90mm Hg (diastolic) after the acute phase of stroke. Ischemic heart disease was diagnosed when a history of angina pectoris or myocardial infarction was present. In addition to routine investigations as per standard protocol in the evaluation of stroke patient, fasting serum triglyceride level and post prandial serum triglyceride level were measured between 12 and 36 hours after stroke onset using commercially available kits. Hypertriglyceridemia was diagnosed if TG >2.3mmol/l. Patients were followed up till they were discharged from the hospital.
Parameters
The following parameters were tested 1) Age 2) Sex
3) Hypertension 4) IHD
3) Hypertension 4) IHD
Statistical Methods
1. Descriptive statistical analysis has been carried out in the present study. Significance is assessed at 5% level of significance.
Procedure
A detailed history, clinical examination and relevant laboratory investigations were done as per proforma.
Fasting serum triglyceride levels and post prandial serum triglyceride levels were estimated in patients, quantitatively by GPO-TRINDER method based on the method of Wako and the modifications by McGOWAN et al. [8] .
The kit used was Triglycerides Kit: Ortho Clinical Diagnostics Rochester, NY, USA.
Results
The following tables show association between the fasting & post prandial triglyceride levels and severity of stroke based on SSS scale and their influence based on risk factorsage, sex, hypertension, IHD.
Discussion
Discussion
Fasting & post prandial triglycerides levels and severity of stroke
The present study involved 80 patients of acute ischemic stroke. Serum triglyceride levels are generally increased for 3-6 h after a meal [9] . Once postprandial hypertriglyceridemia occurs, it is exacerbated by the next meal and persists for the entire day. The most common pattern of dyslipidemia in type 2 diabetic patients is elevation of triglyceride levels and a decrease in HDL cholesterol levels. Therefore, measuring postprandial values for evaluation of hypertriglyceridemia in patients with diabetes is important. However, to our knowledge, the association between postprandial triglyceride (PPTG) levels and atherosclerosis has not been investigated. One would thus surmise that postprandial lipid values would correlate better with Prognosis than fasting values. This has indeed been shown in recent epidemiologic studies. Bansal and colleagues [10] analyzed the prognostic value of fasting and nonfasting triglyceride levels in a cohort of 26,509
healthy women enrolled in the Women's Health Study. After 11.4 years of follow-up, PPTG but not fasting Triglycerides in the upper tertile of the distribution were associated with an almost 2-fold increase in cardiovascular disease even after adjustment for age, blood pressure, smoking, use of hormone therapy, total and high-density lipoprotein cholesterol, diabetes mellitus, body mass index, and highsensitivity C-reactive protein.
It is important, however, not to dismiss triglyceride elevations in individuals who forget to fast for their regular blood draw. Such an elevation should prompt discussion with the patient about the link between such triglyceride elevations and insulin resistance, future cardiovascular disease, and the importance of lifestyle modifications (quality and quantity of food, weight management, physical activity) [11] .
Postprandial remnant particles of triglyceride-rich lipoproteins have also been found to be an independent risk factor for early atherosclerosis and may be responsible for the increased rate of carotid intima-media thickness in these subjects. The difference in the results of these studies may be related to measurement of triglycerides in the fasting versus postprandial state. Hypertriglyceridemia may also contribute to cerebrovascular disease through its effects on thrombosis. This effect is produced by thrombogenic alterations of the coagulation system as well as elevations in plasma viscosity. Previous study reported that 18 patients with severe hypertriglyceridemia (mean fasting plasma triglyceride level 504.4 mg/dl) had higher concentrations of plasma fibrinogen, lower fibrinolytic activity and higher levels of clotting factor Xc compared to normolipidemic controls [11] . Several studies have not found triglycerides to be an independent risk factor for IS [12] . For example, Bowman et al. [12] Conducted a prospective, randomized, nested casecontrol study among patients from the Physician Health Study, which included 296 fatal and nonfatal IS in white male physicians and an equal number of controls. Another study consisting of 121 consecutive acute ischemic stroke patients showed that a higher (≥1.70 mmol/l) fasting serum triglyceride level (within 24h after admission) was associated with a lower infarct volume (p = 0.014) [13] . The biological mechanism responsible for association between TG level and stroke severity is unknown. Low TG level may reflect poor nutritional status of the patient. [15] and others 863 patients 1.4 ± 0.6 1.7 ± 1.3
In both the studies, the level of serum triglyceride was lower in patients with severe stroke as compared to the levels in mild/moderate stroke patients, which was statistically not significant.
Age and fasting & post prandial triglyceride levels
Triglycerides increase gradually in men until about age 50 years and then decline slightly but in women, they continue to increase with age. The prevalence of mild hypertriglyceridemia is slightly more in men beginning at age 30 years and women starting at age 60 years. Fasting triglycerides gradually increase in age<65 years and severity of stroke is less (SSS<25). Post-prandial triglycerides gradually increase in age<65 years and severity of stroke is more when compared to age >65 years. The present study did not show any statistically significant association between FTG & PPTG Level and age. However, in the present study no statistically significant association between FTG & PPTG level and sex of an individual could be noticed.
IHD and Triglyceride Levels
The role of triglycerides as a risk factor of ischemic heart disease (IHD) remains controversial. In the Copenhagen Male Study on 2906 white men who were initially free of overt cardiovascular disease, an 8-year follow-up period showed that a clear gradient of risk of IHD was found with increasing triglyceride levels within each level of HDL cholesterol, including high HDL cholesterol levels, which are thought to provide protection against IHD. However, the present study did not show any significant association between FTG & PPTG Level and IHD.
Hypertension and Triglyceride Levels
Essential hypertension is frequently associated with metabolic abnormalities including glucose intolerance, hypertriglyceridemia and enhanced postprandial lipemia [14] . In this study there is statistically significant association between PPTG level and hypertension.
Conclusion
In this study, based on our review of the existing evidence, we conclude that post prandial serum triglyceride level should also be measured to assess the severity of stroke. In this study patients with HTN have higher PPTG value and has increased risk for stroke. So dietary and lifestyle modifications should be encouraged. To assess the benefit of pharmacologic and dietary TG reduction with respect to primary and secondary prevention of ischemic stroke.
Acknowledgement
AcknowledgmentThe author thankful to management of Bhaskar Medical College & General Hospital for providing all the facilities to carry out this work.
Figures and tables from the paper
| SSS | — | — | — | — | — |
|---|---|---|---|---|---|
| AGE AGE | ≤25 | >25 | Total | X2 Value | |
| ≤65 | 15 | 40 | 55 | 0.133 | |
| >65 | 13 | 12 | 25 | ||
| Total | 28 | 52 | 80 |
Table text extracted from the original PDF; superscript letters are shown inline. The original table image is below.
View original table image
| SSS | — | — | — | — | — |
|---|---|---|---|---|---|
| FTG | ≤25 | >25 | Total | X2 Value | |
| ≤2.3 | 15 | 50 | 79 | 0.647 | |
| >2.3 | 5 | 10 | 21 | ||
| Total | 20 | 60 | 80 |
Table text extracted from the original PDF; superscript letters are shown inline. The original table image is below.
View original table image
| SSS | — | — | — | — | — |
|---|---|---|---|---|---|
| PPTG | ≤25 | >25 | Total | X2 Value | |
| ≤2.3 | 9 | 34 | 43 | 0.548 | |
| >2.3 | 12 | 25 | 37 | ||
| Total | 21 | 59 | 80 |
Table text extracted from the original PDF; superscript letters are shown inline. The original table image is below.
View original table image
| FTG Level (mmol/l) | — | — | — | — | — |
|---|---|---|---|---|---|
| Age | <2.3 | >2.3 | Total | X2 Value | |
| <65 | 42 | 10 | 52 | 0.827 | |
| >65 | 23 | 5 | 28 | ||
| Total | 65 | 15 | 80 |
Table text extracted from the original PDF; superscript letters are shown inline. The original table image is below.
View original table image
| PPTG Level (mmol/l) | — | — | — | — | — |
|---|---|---|---|---|---|
| Age | <2.3 | >2.3 | Total | X2 Value | |
| <65 | 25 | 28 | 53 | 0.231 | |
| >65 | 15 | 12 | 27 | ||
| Total | 40 | 40 | 80 |
Table text extracted from the original PDF; superscript letters are shown inline. The original table image is below.
View original table image
| PPTG Level (mmol/l) | — | — | — | — | — |
|---|---|---|---|---|---|
| HTN | <2.3 | >2.3 | Total | X2 Value | |
| No | 25 | 11 | 36 | 0.031 | |
| Yes | 19 | 25 | 44 | ||
| Total | 44 | 36 | 80 |
Table text extracted from the original PDF; superscript letters are shown inline. The original table image is below.
View original table image
| FTG Level (mmol/l) | — | — | — | — | — |
|---|---|---|---|---|---|
| IHD | <2.3 | >2.3 | Total | X2 Value | |
| No | 50 | 14 | 64 | 0.245 | |
| Yes | 12 | 4 | 16 | ||
| Total | 62 | 18 | 80 |
Table text extracted from the original PDF; superscript letters are shown inline. The original table image is below.
View original table image
| FTG Level (mmol/l) | — | — | — | — | — |
|---|---|---|---|---|---|
| Sex | <2.3 | >2.3 | Total | X2 Value | |
| Male | 42 | 12 | 54 | 0.857 | |
| Female | 18 | 8 | 26 | ||
| Total | 60 | 20 | 80 |
Table text extracted from the original PDF; superscript letters are shown inline. The original table image is below.
View original table image
| PPTG Level (mmol/l) | — | — | — | — | — |
|---|---|---|---|---|---|
| IHD | <2.3 | >2.3 | Total | X2 Value | |
| No | 30 | 34 | 64 | 0.645 | |
| Yes | 8 | 8 | 16 | ||
| Total | 38 | 42 | 80 |
Table text extracted from the original PDF; superscript letters are shown inline. The original table image is below.
View original table image
| SSS | — | — | — | — | — |
|---|---|---|---|---|---|
| HTN | ≤25 | >25 | Total | X2 Value | |
| No | 12 | 24 | 36 | 0.648 | |
| Yes | 13 | 31 | 44 | ||
| Total | 25 | 55 | 80 |
Table text extracted from the original PDF; superscript letters are shown inline. The original table image is below.
View original table image
| FTG Level (mmol/l) | — | — | — | — | — |
|---|---|---|---|---|---|
| HTN | <2.3 | >2.3 | Total | X2 Value | |
| No | 30 | 6 | 36 | 0.645 | |
| Yes | 32 | 12 | 44 | ||
| Total | 62 | 18 | 80 |
Table text extracted from the original PDF; superscript letters are shown inline. The original table image is below.
View original table image
References
15 in the original paper- Stalenhoef AF, De Graaf J. Association of fasting and nonfasting serum triglycerides with cardiovascular disease and the role of remnant-like lipoproteins and small dense LDL. Curr Opin Lipidol. 2008; 19:355-61.
- Bansal S, Buring JE, Rifai N, Mora S, Sacks FM, Ridker PM. Fasting compared with nonfasting triglycerides and risk of cardiovascular events in women. JAMA. 2007; 298:309-16.
- Nordestgaard BG, Benn M, Schnohr P, Tybjaerg-Hansen A. Nonfasting triglycerides and risk of myocardial infarction, ischemic heart disease, and death in men and women. JAMA. 2007; 298:299-308.
- Ryu JE, Howard G, Craven TE, Bond MG, Hagaman AP, Crouse JR. 3rd. Postprandial triglyceridemia and International Journal of Advanced Biochemistry Research http://www.biochemjournal.com carotid atherosclerosis in middle-aged subjects. Stroke 1992; 23:823-8.
- Oka R, Kobayashi J, Miura K, Nagasawa S, Moriuchi T, Hifumi S et al. Difference between fasting and nonfasting triglyceridemia: the influence of waist circumference. J Atheroscler Thromb. 2009; 16:633-40.
- Rector RS, Linden MA, Zhang JQ, Warner SO, Altena TS, Smith BK et al. Predicting postprandial lipemia in healthy adults and in at-risk individuals with components of the cardio metabolic syndrome. J Clin. Hypertens (Greenwich). 2009; 11:663-71.
- Enkhmaa B, Ozturk Z, Anuurad E, Berglund L. Postprandial lipoproteins and cardiovascular disease risk in diabetes mellitus. Curr Diab Rep. 2010; 10:61-9.
- Gowenlock AH. Lipids and lipoproteins; Varley's practical clinical biochemistry. 6th Edn. New Delhi: CBS publishers and distributors, 1988, 464-466.
- Bjorkegren J, Karpe F, Milne RW, Hamsten A. Differences in apolipoprotein and lipid composition between human chylomicron remnants and very low density lipopro-teins isolated from fasting and postprandial plasma. J Lipid Res. 1998; 39:1412-1420.
- Bansal S, Buring JE, Rifai N, Mora S, Sacks FM, Ridker PM. Fasting compared with nonfasting triglycerides and risk of cardiovascular events in women. JAMA. 2007; 298:309-316.
- National Cholesterol Education Program Expert Panel on Detection, Evaluation, and Treatment of High Blood Cholesterol in Adults (Adult Treatment Panel III). Third report of the National Cholesterol Education Program (NCEP) Expert Panel on Detection, Evaluation, and Treatment of High Blood Cholesterol in Adults (Adult Treatment Panel III) final report. Circulation. 2002; 106:3143-3421.
- Hackman A, Abe Y, Insull W Jr, Pownall H, Smith L, Dunn K et al. Levels of soluble cell adhesion molecules in patients with dyslipidemia. Circulation. 1996; 93:1334-1338.
- Pikija S, Milevcić D, Trkulja V, Kidemet-Piskac S, Pavlicek I, Sokol N. Higher serum triglyceride level in patients with acute ischemic stroke is associated with lower infarct volume on CT brain scans. Eur. Neurol. 2006; 55(2):89-92.
- Venkatesan A, Hemalatha A, Zachariah B, Selvaraj N, Sathiyapriya. Effect of smoking on lipid profile and lipid peroxidation in normal subjects. Indian J Physiol Pharmacol. 2006; 50(3):273-278.
- Tomasz D, Agnieszka S, Elzbieta AG, Szczudlik A. Lower serum triglyceride level is associated with increased stroke severity. Stroke. 2004; 35:e151-e152.