
Research article · 2019 · Full text
International Journal of Statistics and Applied MathematicsComparative statistical studies of air pollution index of Agra and Kolkata city
Volume 4(6) · Pages 154–157
Research areasWater Quality and Pollution AssessmentMedicinal Plant StudiesEngine and Fuel Emissions
Abstract
Author-writtenThe presence of one or more air pollutants contaminants in such quantity and duration which may prove the injurious to human health, plants and animal life. The property is unreasonaly interfere with comfort and enjoyment of life, property and conduct of the business is termed as air pollution. Present investigation mainly deals with the comparative statistical studies of air pollution index of Agra and Kolkata city.
Summary
Source-checkedPlain-language reading of the full paper, prepared with AI and checked against the text. Each point links to the authors' own words.
Why it matters
- Air pollution is defined as the presence of contaminants in quantities and durations that can harm human health, plants, animal life, and property, or interfere with the enjoyment of life and business. View evidence ↗
- In the Agra region, sulfur dioxide (SO2) from refineries and industries can combine with atmospheric moisture to create acid rain, which corrodes the white marble of historical monuments. View evidence ↗
The question
- The study aims to perform a comparative statistical analysis of the air pollution index in the cities of Agra and Kolkata. View evidence ↗
What they did
- The researchers applied constant mean, locally constant mean, and water forecast models to air pollution data for NO2, SO2, and Suspended Particulate Matter (SPM) collected between 1996 and 2000. View evidence ↗
- Air pollutant levels (SO2, NO2, and SPM) in Agra were monitored by the Central Pollution Control Board (CPCB) across six different sites. View evidence ↗
What they found
- In Agra, St. John's Crossing (a commercial area) showed high pollutant levels with an average concentration of 21 µ gm–3 for SO2, 19 µ gm–3 for NO2, and 751 µ gm–3 for SPM. View evidence ↗
- The Taratola station in Kolkata showed an average NO2 concentration of 272.1 µ g/m3, which is more than double the N.A.A.S of 120 µ g/m3. View evidence ↗
- Among the Agra sites, Manas Nagar had the highest calculated Air Pollution Index at 498.09. View evidence ↗
- Among the Kolkata sites, Hazra had the highest calculated Air Pollution Index at 480.00. View evidence ↗
- Foundry Nagar in Agra recorded the lowest Air Pollution Index among the studied sites at 86.203. View evidence ↗
What it means
- The authors conclude that air pollution is hazardous in several areas of both cities, including TajGanj, St. John's crossing, Manas Nagar, and Sadar Bazar in Agra, as well as Gariahat, Shyam Bazar, and Hazra in Kolkata. View evidence ↗
- The authors state that air pollution leads to health risks, death, reduced visibility, economic losses, and the deterioration of cities and historical monuments. View evidence ↗
Visual summary
1 visualsIllustrations explain the paper; charts are replotted from the paper's own table values.
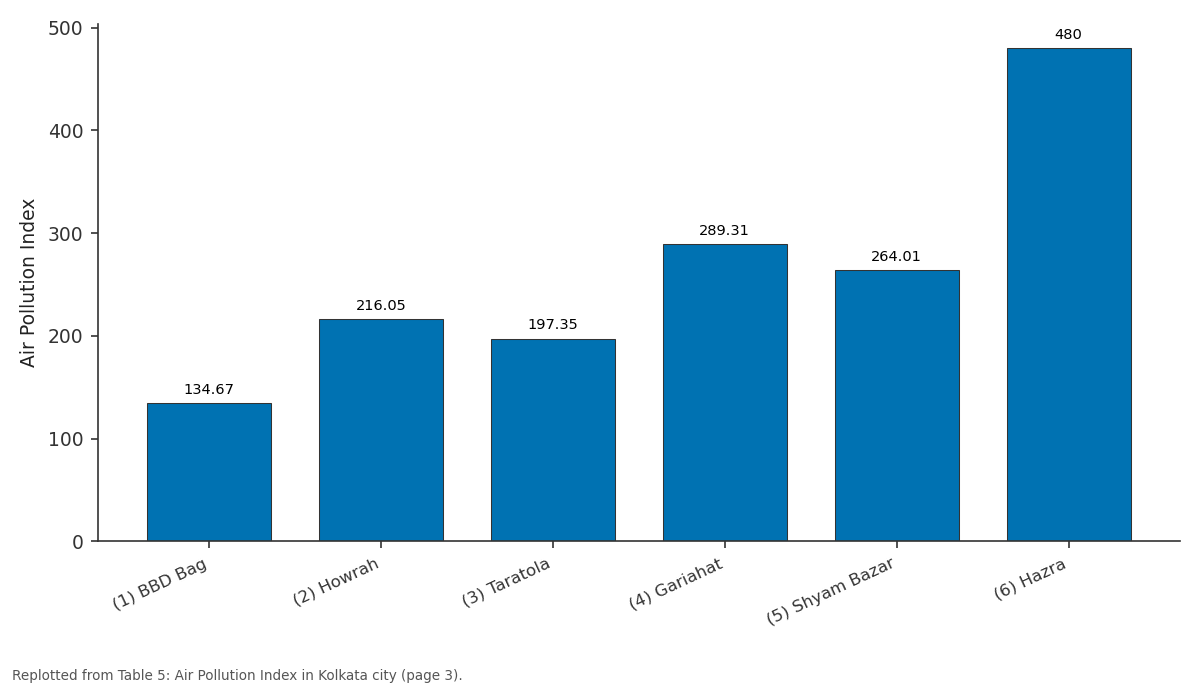
Air Pollution Index: (1) BBD Bag vs (2) Howrah vs (3) Taratola vs (4) Gariahat vs (5) Shyam Bazar
Replotted from Table 5 (page 3) of the original paper. Every bar is the paper's own table value.
View source evidence ↗Figures & tables
From the original paper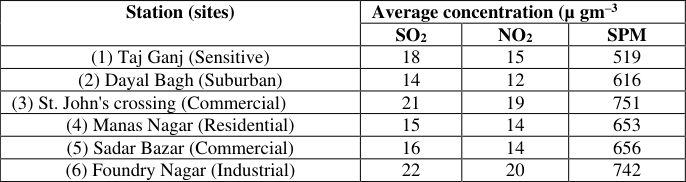 Table 1
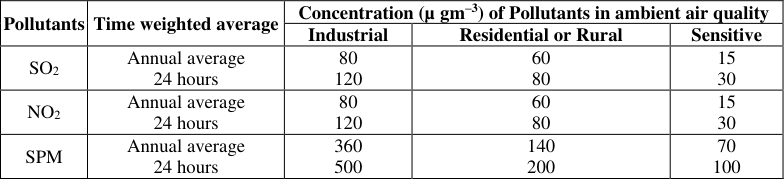 Table 2
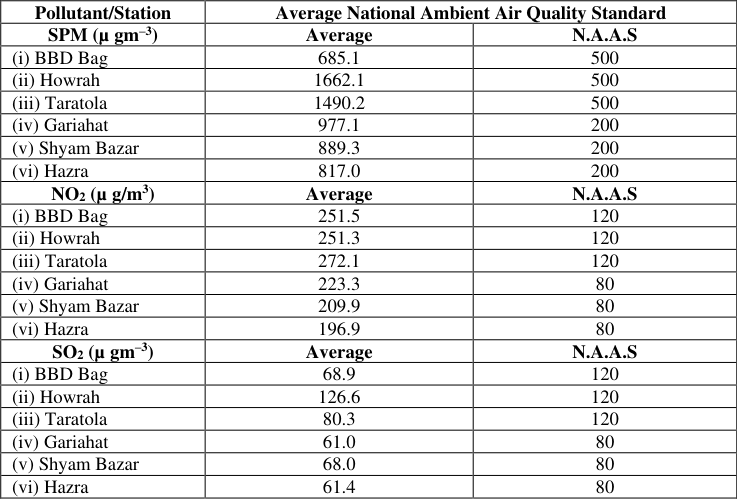 Table 3
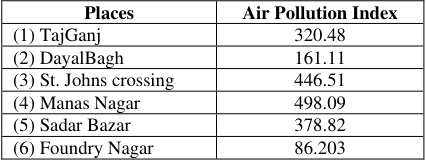 Table 4
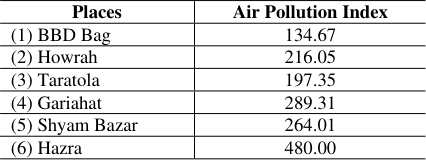 Table 5
Introduction
Plants, animals and living organisms have to be entirely depends upon environment for sustaining their life. All living being are directly and indirectly affected by environment. The environmental pollution is the unfavorable alternation of our surrounding through direct or indirect effects of changes in energy patterns radiation level, chemical and physical constitution and abundance of living organisms. The present investigation mainly deals with the study of air pollution index in Agra and Kolkata city. The constant mean model, locally constant mean model and water forecast procedure are applied on air pollution data of NO 2 , SO 2 and SPM from 1996-2000. The air pollution means [1][2][3][4][5] are present in the outdoor atmosphere of one or more contaminants such as dust, fumes, gas, mist, odour smoke and vapour are present in quantities. The characteristics of these pollutants regarding the durations such as to be injurious to human, plant, animal life or property or which unreasonably interfere with the comfortable enjoyment of life and property.
Materials and Methods
Clear and dry air contains 78.09% nitrogen and 20.94% oxygen by volume. The remaining 0.79% is composed of a gaseous mixture of CO 2 , He, Ar, Kr, Nitrous oxide and xenon as well as very small amounts of some other organic and inorganic gases whose amount in the atmosphere vary with time and places. Various amounts of air pollution contaminants [6][7][8][9][10] continuously enter the atmosphere through both natural and man-made process that exists upon the earth. The portion of those substances which interacts with the environment to cause the toxicity, disease, aesthetic, distress, physiological effects, or environmental decay has been labelled by man as a "pollutant"'. Air pollution contaminants [11][12][13][14][15][16][17] are either natural or may be the results of various activity of man like industrial operation. Air pollutants are identified as follows: (i) Natural contaminants pollutants are as follows:
Natural fog, Pollen grain, Bacteria and Product of volume eruption. (ii) Aerosols pollutants are as follows:
Dust, smoke, mists, fog and fumes. (iii) Gaseous and vapours pollutants.
Other important contaminants are as follows: a) Sulphur compounds: SO 2 , SO 3 , H 2 S etc. b) Nitrogen compounds: NO, NO 2 , NH 3 etc. c) Oxygen compounds: O 3 , CO, CO 2 etc. d) Halogen compounds: HF, HCl, etc. e) Organic compounds: Aldehyde, Hydrocarbon and Radioactivity.
Results and Discussion
Air pollution study of Agra city Perhaps, no other historical monuments has evoked as much awareness and administration of tourists and travelers, alike as the magnificent TajMahal, fondly called people as the ultimate requiem of love, from the great Mughal Emperor Shah Jahan to his beloved wife. Agra is a historical city and situated on bank of River Yamuna in Uttar Pradesh (India). It is situated in the North Central part (27° 10' N, 78° 05 E, 169 m.) above the mean sea level of India. It is semi arid region bounded by the desert of Rajasthan on two third of its peripheries. It was founded by Sikandar Lodhi. So over whelming is exquisite beauty presence of this marble mausoleum that centuries later today even the very land whose it has been located Agra has been important as the city of Taj. The latter part of Indian history outline the origins of Agra to 1475 A.D., when the region of Raja Badal Singh. Later in 1526 A.D. the Mughal Emperor Babar took upon himself the task for rendoring Agra, a unique character and beauty of its own. TajMahal, Sheer Poetry in marble and Majesty Magnificance, unrevalled. The TajMahal is one and only one of its kind across the World.
Findings
No pollution monitoring [18][19][20][21][22] Firozabad when combined with moisture in the atmosphere forms sulphuric acid and causes 'Acid rain' which has a corroding effect on the gleaming white marble.
Constitution of Mahajan Committee
The Mahajan Committee was constituted by the order of Hon'ble Supreme Court on 05.02.1996. The Hon'ble Supreme Court on 30.08.1996 directed the Mahajan Committee to inspect the progress of the green belt developed around the TajMahal every three months and submit progress report in the court for the period of next three years. Earlier, on the basis of the report submitted by the NEERI regarding development of the green belt around the TajMahal, The Hon'ble Supreme Court on 30.08.1996 and 30.12.1996 directed the Ministry of Environment and Forests, Government of India for monitoring maintenance of the trees planted in the green belt. On the direction of the Hon'ble Supreme Court on 13.09.2000, the Central Pollution Control Board inspected the Foundry Nagar Industrial Area, Agra and the premises of the TajMahal and submitted its report with its recommendation. The city of Taj (Agra) has the sever problem of air pollution [23] . The main air pollutants are as: CO 2 , SPM, oxides of Nitrogen (NO 2 ), Sulphur dioxide (SO 2) , Carbon monoxide (CO), etc.
(1) TajGanj: A sensitive area where TajMahal is situated.
The area is surrounded a green belt extending for a radial distance of 1 k.m. Several small scale industries are also located within the region. Every day, in a peak season about 2500 visitors come, mostly by vehicles to see TajMahal.
(2) DayalBagh: A suburban area located in the north of the city, has low residential density and no industrial activity.
(3) St. John's Crossing: Major business and commercial center of the city. The traffic density is maximum about 30,000 vehicles per day.
(4) Manas Nagar: A residential area, has no industrial activity and low traffic density.
Figures and tables from the paper
| Station (sites) | Average concentration (µ gm–3 | — | — |
|---|---|---|---|
| SO2 | NO2 | SPM | |
| (1) Taj Ganj (Sensitive) | 18 | 15 | 519 |
| (2) Dayal Bagh (Suburban) | 14 | 12 | 616 |
| (3) St. John's crossing (Commercial) | 21 | 19 | 751 |
| (4) Manas Nagar (Residential) | 15 | 14 | 653 |
| (5) Sadar Bazar (Commercial) | 16 | 14 | 656 |
| (6) Foundry Nagar (Industrial) | 22 | 20 | 742 |
Table text extracted from the original PDF; superscript letters are shown inline. The original table image is below.
View original table image
| Pollutants | Time weighted average | Concentration (µ gm–3) of Pollutants in ambient air quality | — | — |
|---|---|---|---|---|
| Industrial | Residential or Rural | Sensitive | ||
| SO2 | Annual average 24 hours | 80 120 | 60 80 | 15 30 |
| NO2 | Annual average 24 hours | 80 120 | 60 80 | 15 30 |
| SPM | Annual average 24 hours | 360 500 | 140 200 | 70 100 |
Table text extracted from the original PDF; superscript letters are shown inline. The original table image is below.
View original table image
| Pollutant/Station | Average National Ambient Air Quality Standard | — |
|---|---|---|
| SPM (µ gm–3) | Average | N.A.A.S |
| (i) BBD Bag | 685.1 | 500 |
| (ii) Howrah | 1662.1 | 500 |
| (iii) Taratola | 1490.2 | 500 |
| (iv) Gariahat | 977.1 | 200 |
| (v) Shyam Bazar | 889.3 | 200 |
| (vi) Hazra | 817.0 | 200 |
| NO2 (µ g/m3) | Average | N.A.A.S |
| (i) BBD Bag | 251.5 | 120 |
| (ii) Howrah | 251.3 | 120 |
| (iii) Taratola | 272.1 | 120 |
| (iv) Gariahat | 223.3 | 80 |
| (v) Shyam Bazar | 209.9 | 80 |
| (vi) Hazra | 196.9 | 80 |
| SO2 (µ gm–3) | Average | N.A.A.S |
| (i) BBD Bag | 68.9 | 120 |
| (ii) Howrah | 126.6 | 120 |
| (iii) Taratola | 80.3 | 120 |
| (iv) Gariahat | 61.0 | 80 |
| (v) Shyam Bazar | 68.0 | 80 |
| (vi) Hazra | 61.4 | 80 |
Table text extracted from the original PDF; superscript letters are shown inline. The original table image is below.
View original table image
| Places | Air Pollution Index |
|---|---|
| (1) TajGanj | 320.48 |
| (2) DayalBagh | 161.11 |
| (3) St. Johns crossing | 446.51 |
| (4) Manas Nagar | 498.09 |
| (5) Sadar Bazar | 378.82 |
| (6) Foundry Nagar | 86.203 |
Table text extracted from the original PDF; superscript letters are shown inline. The original table image is below.
View original table image
| Places | Air Pollution Index |
|---|---|
| (1) BBD Bag | 134.67 |
| (2) Howrah | 216.05 |
| (3) Taratola | 197.35 |
| (4) Gariahat | 289.31 |
| (5) Shyam Bazar | 264.01 |
| (6) Hazra | 480.00 |
Table text extracted from the original PDF; superscript letters are shown inline. The original table image is below.
View original table image
References
22 in the original paper- Teller AJ. Air Pollution Control Chemical Engineering Desk Book, May, 1972.
- Shukla SC. Problem of Air Pollution in India, All India Conference on air pollution, Bombay, P.B.-1, September, 1980.
- Strauss W. Air Pollution Part-III, Wiley Intersciences, New York, 1978.
- Selected Method of Air pollution WHO of/set. 1976, 24.
- Sastry CA, Srinivasan TK. Air Pollution in Madras city, CPHERI Report, 1973.
- Rao MN. Status of Air Pollution in India, Paper presented at the tousertier Air pollution Programme, organised by the National Productivity council, Bangalore, March, 1982.
- Ram Prasad G et al., Emission of lead from automobiles in Ahmedabad, Ind. Journal of Industrial Medicine, 1973, 19.
- Ram Parsad G. et al., Qualitative and Quantitative Aspect of dust pollution in small scale flour mills, Food Industry and the Environment, It. Symp., Budapest, Hungary, 1982.
- Ram Prasad G. et al., Emission of Lead from Automobiles in Ahmedabad 2 nd . J of Industrial Medicine, 1973, 19.
- Paul F. Pannelly, Primary and Secondary Particulates as Pollutants, J of Air Pollution Control.1967; 20(1):697.
- Nichlois JE et al., Inlet Manifold Water Injections or control of Nitrogen oxides, Theory and Exp. Paper No. 690018, SAE International auto, Engg. Congress, Detroit, January, 1969.
- Kenneth W, Cecil F. Warner, Air Pollution, its origin and control, IEPA Dun-Doinhally publishers New York, 1976.
- Joe O, Led Batter, Air pollution, Part (A) Analysis, Marcel Deekker, Inc. New York, 1972, 7.
- Hanumanth Rao S, Air and water Pollution Control, Paper presented at the institution of engineers, Karnataka Centre, Bangalore, 1984, 1.
- Hamilton KE. Principles of Environmental Statistics, IAOS conference proceedings, 1991, 1.
- Gopal Krishnan KV et al., Air pollution due to automobile, Proceedings of Seminar. A study of environmental pollution in Madras city, 1971.
- Faith WL, Aurthor A, Atkinson Air Pollution wiley Inter Science New York, 1972, 2.
- A study of Air Pollution is Bangalore, Regional Occupational Health Centre, Annual Report, 1980.
- Briggs DJ. Environmental Statistics for Environmental Policy data Generology and quality. Journal of Environmental Management. 1995; 44:39-54.
- Central Board for Prevention and control of water pollution, emission Regulations Part I and II, Comprehensive Industry Documents series, New Delhi, 1985.
- Environmental Analysis of the vanium fuel cycle, Pt. II, Nuclear Power Reactors, Washington DC. Environmental Protection Agency, 1973.
- Misra D, Gopal P. Development of artificial intelligence based NO2 forecasting models at Taj Mahal, Agra, Atmospheric Pollution Research, 2015, 99-106.