
Research article · 2019 · Full text
International Journal of Advanced Biochemistry ResearchEstimation of serum creatinine, blood urea nitrogen and urine analysis in patients with diabetes to assess the renal impairments
Volume 3(2) · Pages 01–04 · DOI: 10.33545/26174693.2019.v3.i2a.32 ↗
Research areasDiet and metabolism studiesLiver Disease Diagnosis and TreatmentChronic Kidney Disease and Diabetes
Abstract
Author-writtenIntroduction: Serum urea and creatinine are most widely accepted parameters to assess renal impairment (CKD) in diabetes. Aim: To assess e the serum Blood urea nitrogen, creatinine and protein levels in diabetes mellitus subjects to identify the renal impairments. Materials and Methods: This cross-sectional study was done on 40 subjects involving 15 Type 1, 15 Type 2 diabetic and 10 healthy controls. After collection of blood samples, urea creatinine, blood sugar and proteins were analyzed by enzymatic and calorimetric method. Results: In the present study, a total of n=40 diabetic subjects were included, out of which n=20 were male and n=20 were female subjects. The male to female ratio was 1:1. The age of the subjects ranged from 35 - 55 years and the mean age was 50.92 years. The age of the healthy controls ranged from 45 – 52 years and the mean age was 47.72 years. Mean value of Blood glucose (FBS) levels in type 2 diabetes and type were found to be (145.13±10.84; 152.2±9.03) whereas in control group was observed to be 110±7.91). The mean (±SD) value of creatinine in type 2 diabetes group were found to be (2.53±10.84), whereas in type 1 diabetes group were found to be (2.99±0.67). The mean value of creatinine in control group was observed to be 0.80±0.08. Thus, the mean blood urea and serum creatinine levels were statistically significantly (p≤0.05). Blood urea nitrogen in both the diabetic patients compared to healthy controls. (In type 2, 49.66±6.91; Type 1, 48.66±6.73 and in healthy controls was observed to be 10.91±1.68). Urine pH also slightly high in diabetic patients compared to healthy controls. Mean value of proteins in type 1 diabetes found to be 143.13±21.53; whereas in type 2 142.53±28.80. In healthy control subjects mean protein value was observed to be 114.2±3.04. Conclusion: Strong relationship of blood urea and serum creatinine levels was found with blood sugar levels. Blood urea and serum creatinine levels along with blood glucose levels would be helpful to monitor the diabetes patients to assess renal function.
Summary
Source-checkedPlain-language reading of the full paper, prepared with AI and checked against the text. Each point links to the authors' own words.
Why it matters
- Chronic Kidney Disease (CKD) involves a progressive loss of the kidneys' normal regulatory and excretory functions. View evidence ↗
- Diabetic nephropathy affects 30% of all diabetic patients and is a primary cause of end-stage renal disease. View evidence ↗
- Blood Urea Nitrogen (BUN) and serum creatinine are the most widely accepted parameters for assessing renal function. View evidence ↗
The question
- The study aimed to quantitatively measure serum glucose, urea, creatinine, and protein levels in patients with Type 1 and Type 2 diabetes. View evidence ↗
What they did
- This was a 6-month cross-sectional study conducted in Telangana, India, involving 40 subjects aged 30 to 70 years. View evidence ↗
- Blood sugar was measured via GOD-POD assay, blood urea via enzymatic urease method, and serum creatinine via alkaline Jaffe’s Picrate method. View evidence ↗
- Data were expressed as mean ± SD and analyzed using student's t-test, with p ≤ 0.05 considered statistically significant. View evidence ↗
What they found
- Serum creatinine levels were significantly higher in Type 2 (2.53±10.84) and Type 1 (2.99±0.67) diabetes than in controls (0.80±0.08). View evidence ↗
- Blood urea nitrogen (BUN) was significantly elevated in Type 2 (49.66±6.91) and Type 1 (48.66±6.73) diabetes compared to controls (10.91±1.68). View evidence ↗
- Mean protein levels were higher in Type 1 (143.13±21.53) and Type 2 (142.53±28.80) diabetes than in healthy controls (114.2±3.04). View evidence ↗
- A statistically significant relationship (p ≤ 0.05) was found between increased blood sugar levels and increased blood urea levels. View evidence ↗
What it means
- The authors conclude that measuring blood urea and serum creatinine levels provides a simple way to assess renal function in patients with poorly controlled diabetes. View evidence ↗
- The authors state that effective blood sugar control can prevent the progression to diabetic nephropathy, reducing associated morbidity and mortality. View evidence ↗
Visual summary
1 visualsIllustrations explain the paper; they do not show study data.
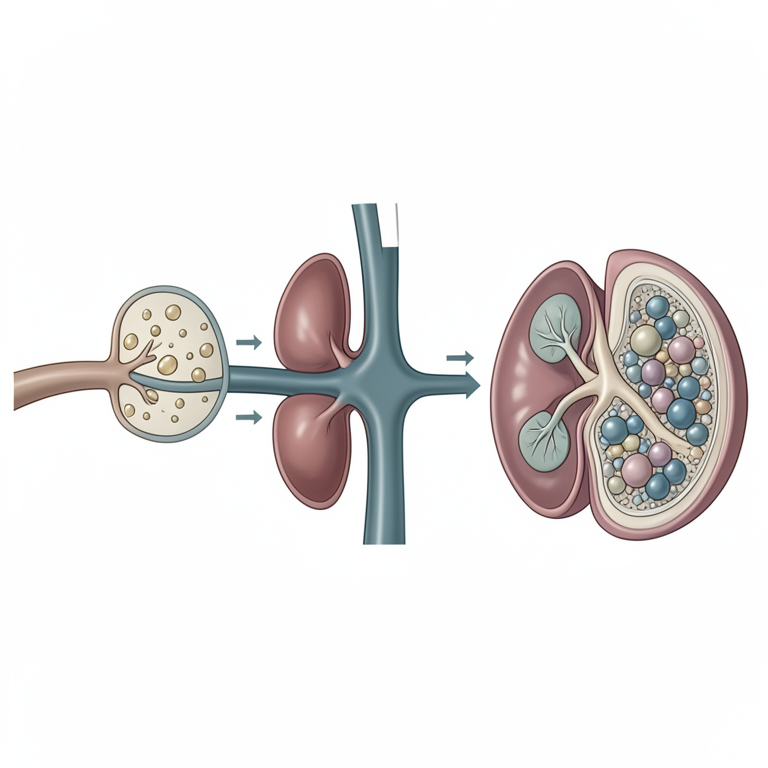
Relationship between Glycemia and Renal Markers
AI-generated conceptual illustration (human kidneys and blood vessels). It explains the idea and does not show study data.
View source evidence ↗Figures & tables
From the original paper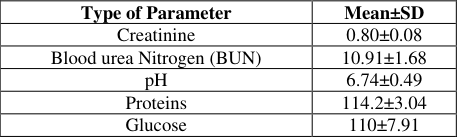 Table 1
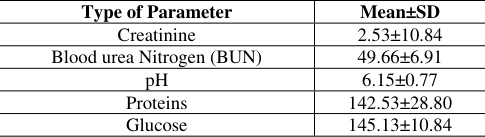 Table 1
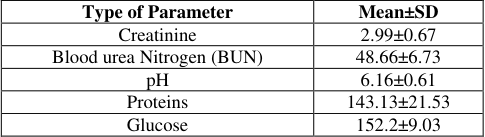 Table 2
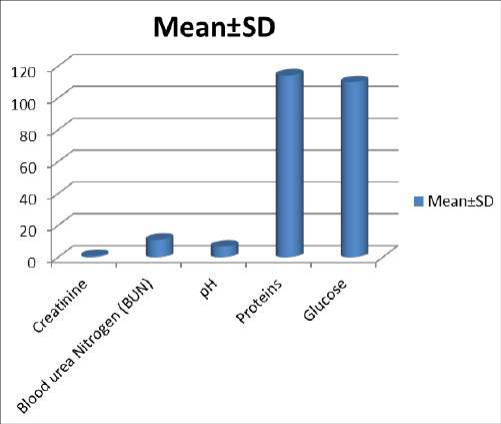 Figure 1
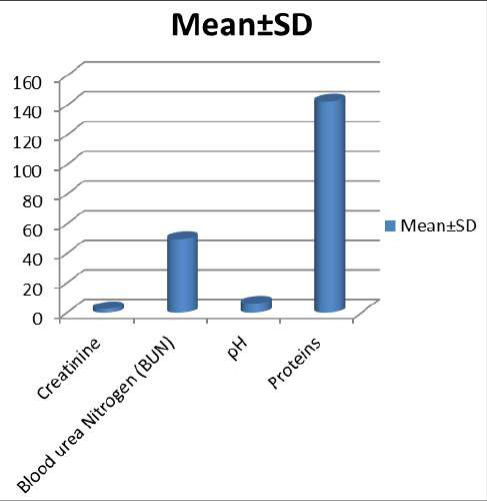 Figure 2
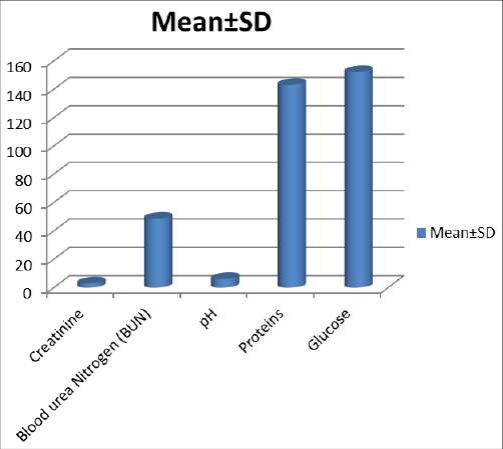 Figure 3
Introduction
Chronic Kidney Disease (CKD) is a progressive reduction in renal function [1] . It is a condition where the kidneys lose their normal function, especially excretory and regulatory functions which can be due to infections, autoimmune diseases, diabetes, hypertension, cancer and toxic chemicals [2] . CKD is heading towards becoming a major health problem [3] and is rapidly assuming epidemic proportions globally [4] . India has highest number of diabetics in the world having a prevalence of 3.8% in rural and 11.8% in urban adults [3] . It is associated with adverse outcomes in all stages of CKD [5] . It has been estimated that approximately 25-40% of diabetic and hypertensive patients usually develop CKD (Nephropathy) [3] . Studies conducted on renal patients revealed that up to 90% were found to have oral symptoms of uremia like ammonia like taste and smell, stomatitis, gingivitis, decreased salivary flow, xerostomia and parotitis [2] . The objectives of early diagnosis is identification of asymptomatic disease at that time when intervention has a reasonable potential of a positive impact on outcome [3] . Diabetes is also one of the major causes of kidney failure [6] . Diabetic nephropathy (DN) is the most common clinical condition of the diabetic patients with progressive deterioration of renal function and structure during their life time [7,8] . DN affects 30% of all diabetics and it is the major leading cause of end stage renal disease (ESRD) in many countries [9][10][11][12] . DN is characterized by abnormal levels (more than 300 mg/day) of albumin in the urine, referred as macro albuminuria [13,14] and abnormal renal function as represented by an abnormality in blood urea and serum creatinine. In DN, bio-markers viz. blood urea and serum creatinine are known to be raised with hyperglycemia in uncontrolled diabetics, usually correlating with kidney damage severity. Measurements of blood urea and serum creatinine are easily available tests which can assist in detection and prevention of diabetic kidney diseases at an early stage thereby, limit the progression to end stage renal disease [15,16] . Biochemical markers play an important role in accurate diagnosis and in assessing risk and adopting therapy to improve clinical outcome. Instead of urine analysis which is relatively discomforting for patient, serum analysis of renal function markers like urea, creatinine, uric acid and electrolytes are used routinely [17] . Blood tests for Blood Urea Nitrogen (BUN) [18] which is a major nitrogenous end product of protein and amino acid catabolism [17] and creatinine [18] which is a breakdown product of creatinine phosphate in muscle [17] are excreted by kidneys. BUN is an indirect and rough measurement of renal function that measures the amount of urea nitrogen in blood and is directly related to excretory function of kidney. Creatinine tests diagnose impaired renal function and measure the amount of creatinine phosphate in blood. Urea and creatinine are good indicators of a normal functioning kidney and increase in the serum are indications of kidney dysfunction. BUN and serum creatinine are widely accepted and most commonest parameters to assess renal functions [19] . The aim of this study was to quantitatively estimate the amount of urea, creatinine, protein analysis and glucose present in the serumof type 1 and type 2 diabetes patients.
Materials and Methods
A cross-sectional study was conducted in Government Medical College and Hospital, Siddipet, Telangana, India for 6 months duration on 40 subjects of either sex aged between 30 to 70 years.
Subjects included in the study were divided into three groups Group I: 15 subjects with Type 2 Diabetes Group II: 15 subjects with diabetes (Type 1) Group III: 10 subjects healthy adults as controls
Inclusion criteria
Subjects with diagnosed type II diabetes mellitus and Type 1 diabetes were included in the study.
Exclusion Criteria
Pregnant women, subjects with recent history of hospitalization, infusions and trauma, subjects known to have any salivary gland or oral diseases, subjects who are critically ill or unconscious, subjects not willing to participate and approve the informed consent were excluded from the study.
Blood Sample Collection and Analysis
Blood samples of all these subjects were collected to study the parameters such as blood urea and serum creatinine with relation to blood sugar level (BSL). Under aseptic conditions 2ml of the patient's intra-venous blood was collected for measuring serum creatinine, glucose and urea. For biochemical investigations serum was separated by centrifugation at 4000 rpm for 10 minutes and kept at -4 °C until analysis. Blood sugar levels were estimated by glucose oxidase and peroxidase (GOD-POD) end point assay method [20] , blood urea was estimated by enzymatic urease method [21] , while serum creatinine was estimated by alkaline Jaffe's Picrate method [22] . The normal ranges for blood sugar level (BSL), fasting is 70 -110 mg/dl, post prandial (PP) is <140 mg/dl. Similarly, the normal range for blood urea is 15-40 mg/dl, and 0.6 -1.4 mg/dl and 0.5 -1.2 mg/dl for serum creatinine for males / females respectively. Post prandial (PP) is(FBG), post prandial blood glucose (PPBG), blood urea and serum creatinine parameters were analyzed using Human reagent kits and with the help of semi auto analyser (Humalyser 3500, Germany).
Statistical analysis
The data collected was analyzed using Excel 2003. The statistical data was analyzed by student's t-test to compare the significance between diabetic and non-diabetic control groups. The data was expressed as mean and standard deviation (mean±SD). p value of less than 0.05 (P≤0.05) was considered as statistically significant.
Results and Discussion
In the present study, a total of n=40 diabetic subjects were included, out of which n=20 were male and n=20 were female subjects. The male to female ratio was 1:1. The age of the subjects ranged from 35 -55 years and the mean age was 50.92 years. The age of the healthy controls ranged from 45 -52 years and the mean age was 47.72 years.
In the present study mean value of Blood glucose (FBS) levels in type 2 diabetes and type were found to be (145.13±10.84; 152.2±9.03) whereas in control group was observed to be 110±7.91). High blood sugar levels damage millions of nephrons resulting in inability of kidneys to maintain fluid and electrolyte homeostasis. Creatinine is filtered by glomerulus and thus, serum creatinine level is considered as an indirect measure of glomerular filtration. Diminishing of glomerluar filtration rate results in rise of plasma concentrations of serum creatinine and urea. Patients with type 1 and type 2 diabetes found high levels of renal markers such as creatinine, blood urea nitrogen and protein levels compared healthy controls. The mean (±SD) value of creatinine in type 2 diabates group were found to be (2.53±10.84), whereas in type 1 diabetes group were found to be (2.99±0.67). The mean value of creatinine in control group was observed to be 0.80±0.08. Thus, the mean blood urea and serum creatinine levels were significantly (p≤0.05) higher in the diabetic subjects over non-diabetic control group. Various previous studies showed that the blood urea levels increased proportionally to the increase in serum creatinine [23,24] . The results of our study in agreement with earlier studies which showed that raised serum creatinine and blood urea levels in diabetic patients may indicate a prerenal problem and it reduce the normal kidney function [25,26] . In the present study we found increased mean value of Blood urea nitrogen in both the diabetic patients compared to healthy controls. (In type 2, 49.66±6.91; Type 1, 48.66±6.73 and in healthy controls was observed to be 10.91±1.68). Urine pH also slightly high in diabetic patients compared to healthy controls. Mean value of proteins in type 1 diabetes found to be 143.13±21.53; whereas in type 2 142.53±28.80. In healthy control subjects mean protein value was observed to be 114.2±3.04.
In the present study, the mean value of blood urea and serum creatinine when compared to mean value of the blood sugar, the p value was found to be statistically significant (p ≤ 0.05). These findings show that there is a relationship of increased blood sugar level with blood urea level indicating that as there is persistent increase in blood sugar level and increase in blood urea levels. Our study results shows that poorly controlled blood sugar levels would cause increase in the blood urea levels and it leads to the development of diabetic nephropathy. Our study accordance with the earlier study reports that hyperglycemia is one of the major causes of progressive renal damage [27,28] . In our study, we found that increase of blood urea level with the increment of blood sugar level clearly indicates that long standing high blood sugar levels causes damage to the kidney it leads to the development chronic kidney diseases. In previous studies found that increase blood urea and serum creatinine in diabetic rats indicates progressive renal damage [27] . Serum levels of urea and creatinine can be used as prognostic markers and predictors of renal damage in diabetic patients. Effective control of blood sugar levels can stop progression to diabetic nephropathy and thus remarkably reduce the morbidity and mortality associated with this metabolic disease.
Conclusion
The present study revealed that poor glycemic status will lead to the progress of impaired renal function. We conclude that blood urea and serum creatinine levels are simple tests helpful in poorly controlled diabetes to assess the renal function.
Acknowledgement
AcknowledgementThe author thankful to Department of Biochemistry, Government Medical College & Hospital, Siddipet for providing all the facilities to carry out this research work.
Figures and tables from the paper
| Type of Parameter | Mean±SD |
|---|---|
| Creatinine | 0.80±0.08 |
| Blood urea Nitrogen (BUN) | 10.91±1.68 |
| pH | 6.74±0.49 |
| Proteins | 114.2±3.04 |
| Glucose | 110±7.91 |
Table text extracted from the original PDF; superscript letters are shown inline. The original table image is below.
View original table image
| Type of Parameter | Mean±SD |
|---|---|
| Creatinine | 2.53±10.84 |
| Blood urea Nitrogen (BUN) | 49.66±6.91 |
| pH | 6.15±0.77 |
| Proteins | 142.53±28.80 |
| Glucose | 145.13±10.84 |
Table text extracted from the original PDF; superscript letters are shown inline. The original table image is below.
View original table image
| Type of Parameter | Mean±SD |
|---|---|
| Creatinine | 2.99±0.67 |
| Blood urea Nitrogen (BUN) | 48.66±6.73 |
| pH | 6.16±0.61 |
| Proteins | 143.13±21.53 |
| Glucose | 152.2±9.03 |
Table text extracted from the original PDF; superscript letters are shown inline. The original table image is below.
View original table image
References
28 in the original paper- Venktapathy R, Govindarajan V, Oza N, Parameswaran S, Dhanasekaran BP, Prashad KV. Salivary creatinine estimation as an alternative to serum creatinine in chronic kidney disease patnties. IJN, 2014, 6 Article ID 742724,
- Abdulla HI, Al-Kotany MY, Mahdi KA. Assessment of oral manifestations of patients with renal failure undergoing hemodialysis by serum and salivary biomarkers. MDJ. 2012; 9(1):118-29.
- Narula AS. Chronic kidney disease. The looming threat. MJAFI. 2008; 64(1):2-3.
- Anupama YJ, Uma G. Prevalence of chronic kidney disease among adults in a rural community in South India: Results from the kidney disease screening (KIDS) project. IJN. 2014; 24(4):214-21.
- Thomas R, Kanso A, Sedor JR. Chronic kidney disease and its complications. Prim Care. 2008; 35(2):1-15.
- United States Renal Data System, USRDS 2007 Annual Data Report, Bethesda, MD, National Institute of Diabetes and Digestive and Kidney Diseases, National Institutes of Health, U.S. Department of Health and Human Services, 2007.
- Sheth JJ. Diabetes, Microalbuminuria and Hypertension. Clinical Experiment Hypertensive. 1999; 21:61-68.
- Remuzzi G, Schieppati A, Ruggenenti P. Nephropathy in Patients with Type 2 Diabetes, N Engl J Med. 2002; 346:1145-1151.
- Atkins RC. The epidemiology of chronic kidney disease. Kidney Int. 2005; 67(94):S14-18.
- Stewart JH, McCredie MR, Williams SM, Jager KJ, Trpeski L, McDonald SP. ESRD Incidence Study Group. Trends in incidence of treated end-stage renal disease, overall and by primary renal disease, in persons aged 20-64 years in Europe, Canada and the AsiaPacific region, 1998-2002. Nephrology (Carlton). 2007; 12:520-527.
- Boddana P, Caskey F, Casula A, Ansell D. UK Renal Registry 11th Annual Report (December 2008): Chapter 14 UK Renal Registry and international comparisons. Nephron Clin Pract. 2009; 111(1):c269276.
- US Renal Data System -USRDS 2010 Annual Data Report. Bethesda, MA: National Institute of Health, National Institute of Diabetes and Digestive and Kidney Diseases, 2010.
- Parving HH. Microalbuminuria in essential hypertension and diabetes mellitus. Journal Hypertension Supplement. 1996; 14:89-94.
- Lane JT. Microalbuminuria as a marker of cardiovascular and renal risk in type 2 diabetes mellitus: a temporal perspective. Am J Physiol Renal Physiol. 2004; 286(3):442-445.
- Shlomo M, Polonsky KS, Larsen PR, Kronenberg HM. Diabetes Mellitus. Willams textbook of endocrinology, 12th Ed. Philadelphia: Elsevier/Saunders. 2011, 13711435.
- Zimmet P, Alberti KG, Shaw J. Global and societal implications of the diabetes. Nature. 2001; 414:782787.
- Gowda S, Desai PB, Kulkarni SS, Hull VV, Math AAK, Vernekar SN. Markers of renal function tests. N Am J Med Sci. 2010; 2(4):170-73.
- Kamal A. Estimation of blood urea (BUN) and serum creatinine level in patients of renal disorder. IJFALS. 2014; 4(4):199-202.
- Suresh G, Ravi Kiran A, Samata Y, Naik P, Kumar V. Analysis of blood and salivary urea levels in patients undergoing haemodialysis and kidney transplant. J Clin Diagn Res. 2014; 8(7):ZC18-20
- Trinder P. Determination of glucose in blood using glucose oxidase with an alternative oxygen acceptor. Ann Clin Biochem. 1969; 6:24-27.
- Fawcett JK, Scott JE. A rapid and precise method for the determination of urea. J Clin Pathol. 1960; 13:156159.
- Owen JA, Iggo B, Scandrett FJ, Stewart CP. The determination of creatinine in plasma or serum, and in urine; a critica1examination. Biochem J. 1954; 58(3):426-437.
- Mittal A, Sathian B, Kumar A, Chandrashekharan N, Sunka A. Diabetes mellitus as a potential risk factor for renal disease among Nepalese: A hospital based control study. Nepal J Epidemiol. 2010; 1:22-25.
- Kapoor S, Cohen D, Townsend R. Effects of Chronic Kidney Disease on Pulse Counter Analysis. Indian J Nephrol. 2007; 17:91-94.
- Aldler AI, Stevens RJ, Manley SE. Development and progression of nephropathy in type 2 diabetes (the United Kingdom prospective diabetes study). Kideny Int. 2003; 63:225-232.
- Judykay T. Nutrition for reducing urea and creatinine in the blood. Diabetes Care. 2007; 27:2191-2192.
- Anjaneyulu M, Chopra K. Quercetin, an antioxidant bioflavonoid, attenuates diabetic nephropathy in rats. Clinical & Experimental Pharmacology & Physiology. 2004; 31:244-248.
- Shrestha S, Gyawali P, Shrestha R, Poudel, Sigdel M, Regmi P. Serum Urea and Creatinine in Diabetic and nondiabetic subjects. JNAMLS. 2008; 9:11-12.
Cited by 10
From OpenAlex, OpenCitations and reference lists read by Scinovex
- Adenine model of chronic renal failure in rats to determine whether MCC950, an NLRP3 inflammasome inhibitor, is a renopreventive ↗
Mahmoud S. Sabra, Fahmy K. Hemida, Essmat A. H. Allam · BMC Nephrology · 2023
BACKGROUND: Chronic renal failure (CRF) is defined by a significant decline in renal function that results in decreased salt filtration and inhibition of tubular reabsorption, which ultimately causes volume enlargement. This study evaluated the potential renopreventive effects of the NLRP3 inflammasome inhibitor MCC950 in adenine-induced CRF in rats due to conflicting evidence on the effects of MCC950 on the kidney.…
❝ 21PDF - Sida cordifolia L. fraction ameliorate renal injury, inflammation, apoptosis and gene expression on cisplatin induced acute kidney injury: Network pharmacology, in vivo and in vitro studies ↗
Palash Mitra, Sahadeb Jana, Pipika Das, Shrabani Pradhan, Suchismita Roy · Current Pharmaceutical Analysis · 2025
Background Acute kidney injury (AKI) is known to involve oxidative stress, apoptosis and inflammation and becoming global health issue. Sida cordifolia L. is a medicinal plant having numerous pharmacological properties. The purpose of this study is to determine the presence of bioactive compounds in the chloroform fraction of Sida cordifolia L. (CFSC), and its effectiveness against cisplatin-induced AKI. Methods HPLC…
❝ 9PDF - Estimation of serum creatinine, serum urea, glomerular filtration rate and proteinuria among apparently healthy adults to assess the renal impairment and its association with body mass index: An observational hospital-based study ↗
Amit Singh Ray, Pawan Kumar Kare, Haresingh Makwane, Tripti Saxena, Mr. Chitransh Garg · International Journal of Medical Research and Review · 2020
Background: Serum urea, creatinine, and estimated glomerular filtration rate (eGFR) are the most widely accepted parameters for the assessment of renal impairment. Renal dysfunction in Indian obese adults has not been sufficiently investigated. Aims: To evaluate the renal function by using serum urea, serum creatinine, eGFR, and proteinuria in normal, overweight, and obese adults to identify renal impairment. Materials and…
❝ 7PDF - Correlation of Blood Urea and Creatinine Levels With Thiamin Levels in Type 1 and Type 2 Diabetic Patients ↗
Adnan Anwar, Fizza Faisal, Wajeeha Elahi, Ahsan Illahi, Syed Munawar Alam, Syed Tariq Ali Adnan et al. · Cureus · 2024
Introduction Serum urea and creatinine levels are the most commonly recognized parameters for evaluating renal impairment in patients with diabetes mellitus (DM). Therefore, this study evaluated the correlation between urea and creatinine levels and thiamin levels in patients with type 1 DM (T1DM) and type 2 DM (T2DM). Methods This multi-center, cross-sectional study was conducted at diabetic outpatient clinics in…
❝ 6PDF - Evaluation of Urea, Creatinine Levels, and Proteinuria among Obese Individuals within Abakaliki Metropolis ↗
Ugomma Agwu Ude, Michael Erem Kalu, Chinenye L. Ogbonna, Victor Udoh Usanga, Simon Onyema Azi · Nigerian Journal of Basic and Clinical Sciences. · 2022
Context: The deleterious effects of obesity on human health are systemic, and kidney dysfunction is now recognized as a health risk posed by obesity. Aim: The study was aimed at evaluating serum urea, creatinine levels, and proteinuria among obese individuals living in Abakaliki Metropolis. Settings and Design: This was a cross-sectional study of individuals living within Abakaliki Metropolis between August…
❝ 4 - Transcriptome analysis of Mesobuthus martensii revealed the differences of their toxins between females and males ↗
Ying Yang, Yina Zhu, Ying Luo, Qiang Liu, X. Hua, Jia‐Su Li et al. · The European Zoological Journal · 2022
Scorpion venom plays an important role in scorpion predation, competition, communication, and defense. In this study, the species identification of Shandong scorpion and the analysis of venom extracted from male and female scorpion at the transcriptome level and their activity were compared. Whole de novo transcriptomes were performed on male and female scorpions and the sequences of cytochrome c oxidase…
❝ 3PDF - Subchronic exposure to tri-ortho-cresyl phosphate induces nephrotoxicity through induction of oxidative stress with neuropathy target esterase inhibition ↗
Jiaqi Wang, Rui Wang, Ningzhe Wu, Pan Wang · BMC Pharmacology and Toxicology · 2026
Tri-ortho-cresyl phosphate (TOCP), an organophosphate compound widely used in industry as a lubricant, plasticizer, and hydraulic fluid, could cause organophosphate-induced delayed neuropathy (OPIDN) which is a phospholipase and involved in phospholipid metabolism. However, whether TOCP could induce nephrotoxicity is not clear. In this study, we used a mouse model with subchronic exposure to TOCP, and a human renal proximal tubular…
❝ 1PDF - Differences of BUN and Serum Creatinine Values in Severity of Diabetic Ketoacidosis Patients at RSD dr. Seobandi Jember ↗
Irawan Fajar Kusuma, Nur Fa'iza Raihanah Masita, Novan Krisno Adji · Journal of Agromedicine and Medical Sciences · 2023
Diabetic ketoacidosis (DKA) is an acute complication of diabetes mellitus classified as mild, moderate, and severe based on the severity of the metabolic acidosis and level of consciousness. As one of hyperglycemic crisis, DKA causes kidney dysfunction which then trigger acute kidney injury (AKI). High mortality rates, recurrent DKA (repeated episodes), increased health care costs, and the risk of further…
❝ 1PDF - Diagnostic utility of salivary creatinine and urea as non-invasive biomarkers in chronic kidney disease – A cross-sectional study ↗
S. Sankari, T. Alamelu Mangai, N. Aravindha Babu, Krithika Chandrasekaran · Journal of Oral and Maxillofacial Pathology · 2026
Background: Chronic kidney disease (CKD) is a growing global health challenge characterized by metabolic alterations, particularly elevated serum urea and creatinine levels, requiring repeated blood investigations. Saliva, as a non-invasive and easily accessible bio-fluid, may serve as an alternative to serum for biochemical assessment. This study aimed to compare salivary and serum creatinine and urea levels in CKD patients and…
❝ 0PDF - Clinical profile of patients with chronic kidney disease ↗
Vishwanath VN, Karan VN · International Journal of Advanced Research in Medicine · 2021
Renal impairment is associated with significant co-morbidity that increases with progressive renal decline. Once an individual reaches end-stage renal disease. (ESRD), cardiovascular disease (CVD) is responsible for approximately half of deaths. A pre-structured proforma was prepared be used to collect demographic data which included age, gender, occupation history of present illness, Past history, family history and personal history including history