
Research article · 2019 · Full text
International Journal of Veterinary Sciences and Animal HusbandryEvaluation of nutritive value of feeds and feed ration ingredients from different interventions used by dairy farms in Kenya
Volume 4(5) · Pages 26–31
Research areasAnimal Diversity and Health Studies
Abstract
Author-writtenDairy cows’ production potential in Kenya is affected by inadequate supply of quality feeds. Chemical analysis and in-vitro degradability of feed ingredients from twelve farms using each of the three interventions: maize train and bale silage, silagefrom Service Provider Enterprises (SPEs), and feed ingredients from farms using ration formulation (Rumen8) software were compared with 12 control farms for each intervention. Data from the experiments was subjected to analysis of variance using the General linear model. Mean separation was done using least significant difference at 5% level of significance. Dry matter content of maize train silage (34.4%) and baled silage (34.9%) differed from SPEs silages (32.3%)(p
Summary
Source-checkedPlain-language reading of the full paper, prepared with AI and checked against the text. Each point links to the authors' own words.
Why it matters
- The production potential of dairy cows in Kenya is limited by a lack of high-quality feed supplies. View evidence ↗
- The nutritional value of animal feed is primarily based on its digestibility, which in turn influences how much the animal eats. View evidence ↗
- Animals in resource-poor environments often perform poorly because the quality and availability of feed fluctuate seasonally. View evidence ↗
The question
- The study aimed to determine the actual nutritional quality of fodder crops and ration ingredients used in various interventions on Kenyan dairy farms. View evidence ↗
What they did
- The researchers compared chemical analysis and in-vitro degradability of feeds from 12 farms per intervention (maize train/bale silage, SPEs silage, and Rumen8 software) against 12 control farms for each. View evidence ↗
- Dry matter (DM) was measured by drying feed ingredients at 105°C for 15 hours, while TMR and fecal samples were dried at 60°C for 48 hours. View evidence ↗
- In-vitro degradability was measured by incubating feed samples in syringes at 39°C for a period of 0 to 96 hours. View evidence ↗
What they found
- Maize train silage (34.4%) and baled silage (34.9%) had significantly different dry matter content compared to SPEs silages (32.3%). View evidence ↗
- Crude protein content varied significantly, being highest in soybean meal (42.7%) and lowest in SPEs silage (7.2%). View evidence ↗
- Neutral detergent fibre (NDF) ranged from 13.9% in soybean meal to 46.6% in SPEs silage. View evidence ↗
- Metabolizable energy (ME) was highest in maize germ meal (14.7 MJ/kg DM) and lowest in sunflower meal (8.7 MJ/kg DM). View evidence ↗
- Organic matter digestibility (OMD) was highest in maize baled silage (56.4%) and lowest in sunflower meal (25.8%). View evidence ↗
- Short chain fatty acid (SCFA) production was highest in maize baled silage (1.3%) and lowest in sunflower meal (0.1%). View evidence ↗
- The rate of gas production was highest for wheat bran (32.2%/h) and lowest for maize train silage (0.2%/h). View evidence ↗
What it means
- The authors conclude that maize train and baler interventions are the most effective fodder conservation measures for ensuring high-quality silage for dairy cows. View evidence ↗
Visual summary
3 visualsIllustrations explain the paper; charts are replotted from the paper's own table values.
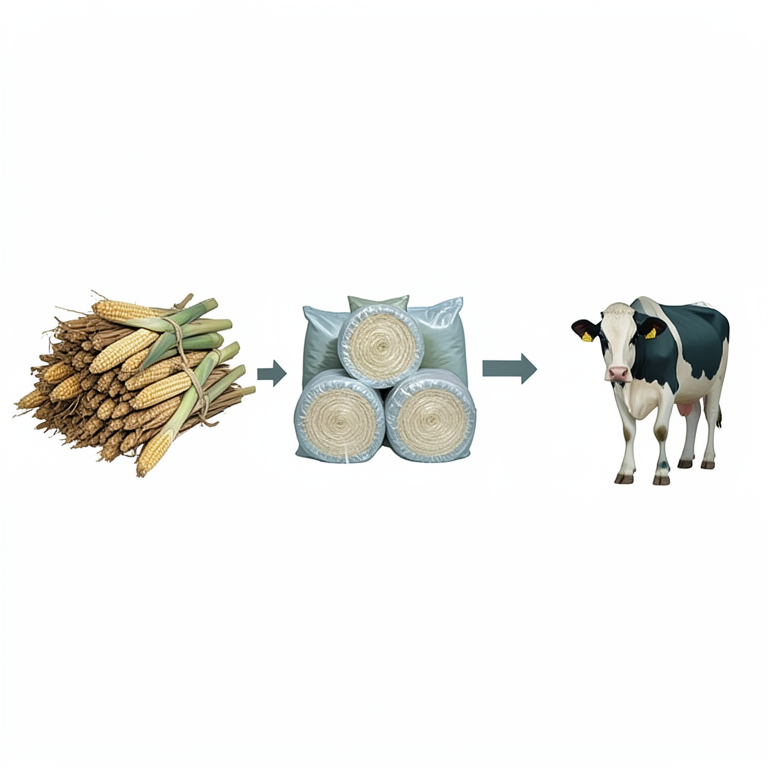
Comparison of Silage Interventions
AI-generated conceptual illustration (Maize silage and dairy cows). It explains the idea and does not show study data.
View source evidence ↗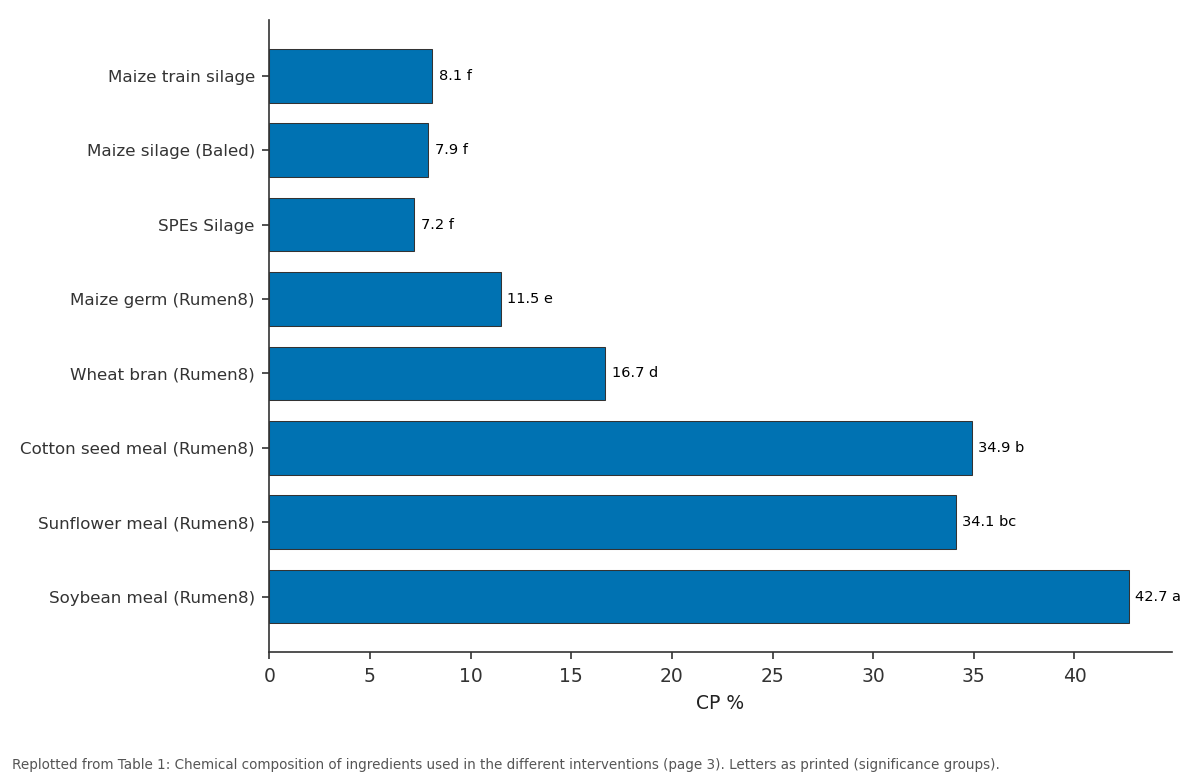
CP %: Maize train silage vs Maize silage (Baled) vs SPEs Silage vs Maize germ (Rumen8) vs Wheat bran (Rumen8)
Replotted from Table 1 (page 3) of the original paper. Every bar is the paper's own table value.
View source evidence ↗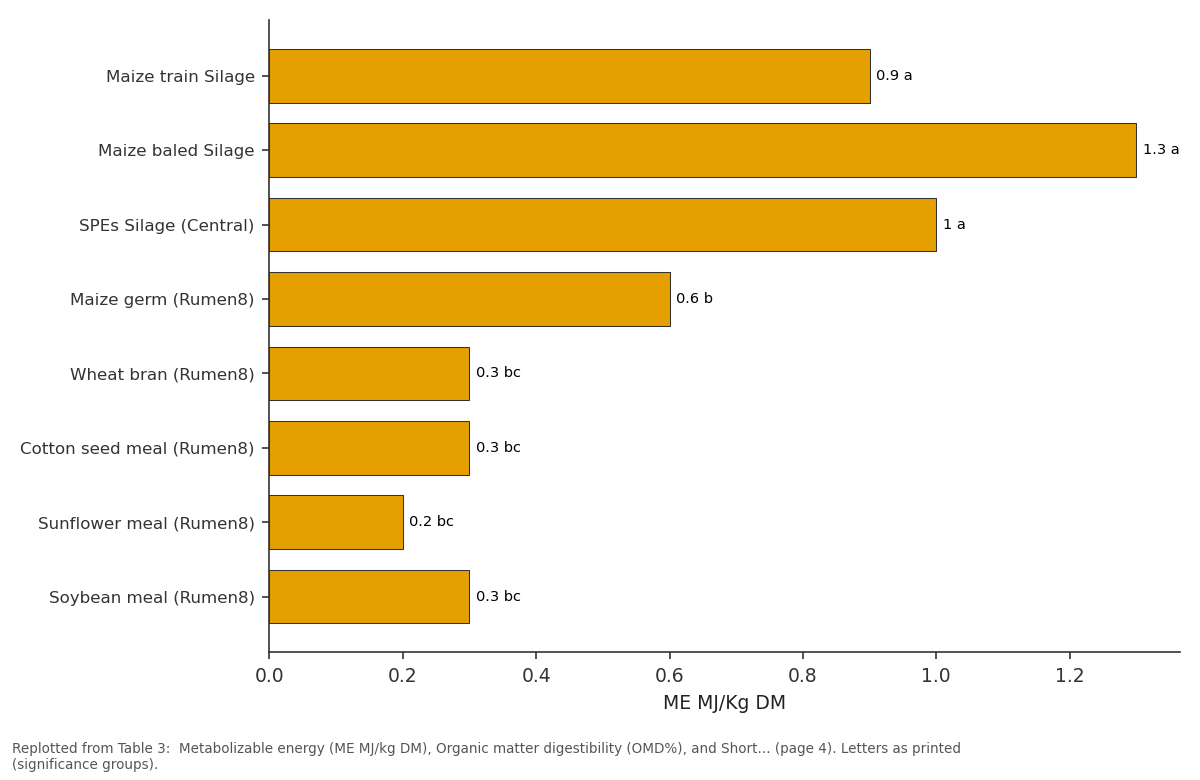
SCFA: Maize train Silage vs Maize baled Silage vs SPEs Silage (Central) vs Maize germ (Rumen8) vs Wheat bran (Rumen8)
Replotted from Table 3 (page 4) of the original paper. Every bar is the paper's own table value.
View source evidence ↗Figures & tables
From the original paper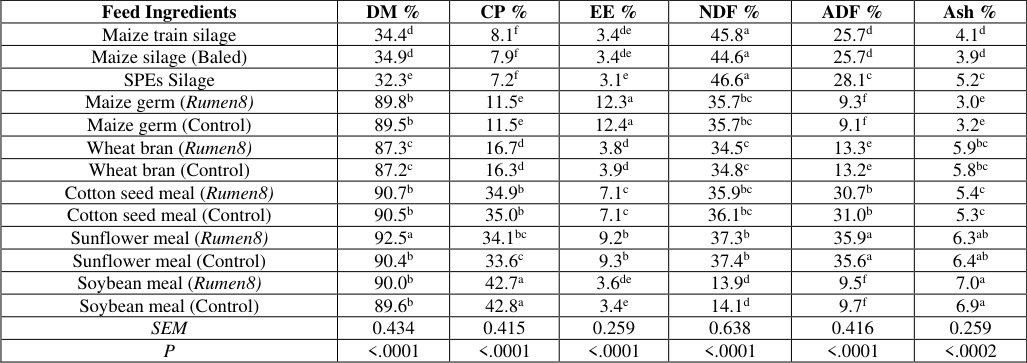 Table 1
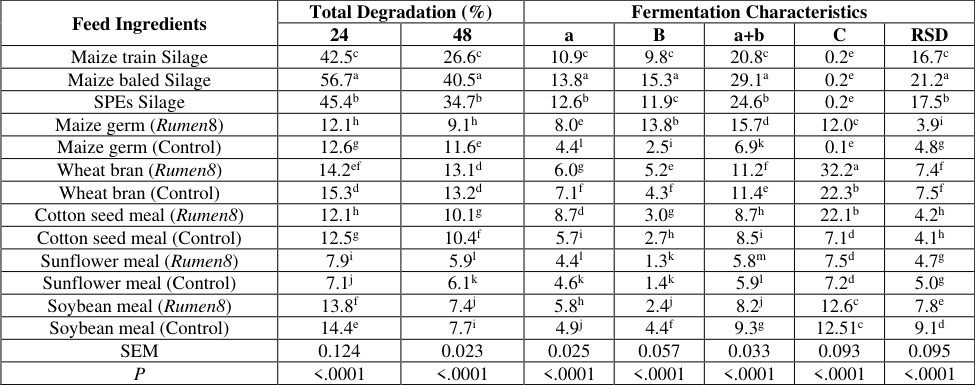 Table 2
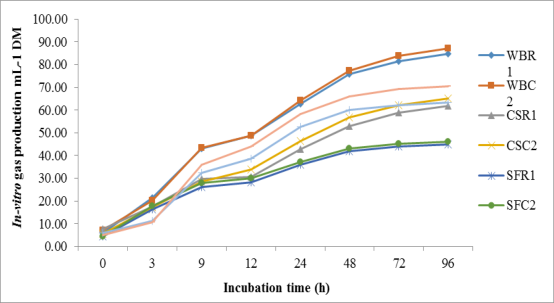 Figure 1
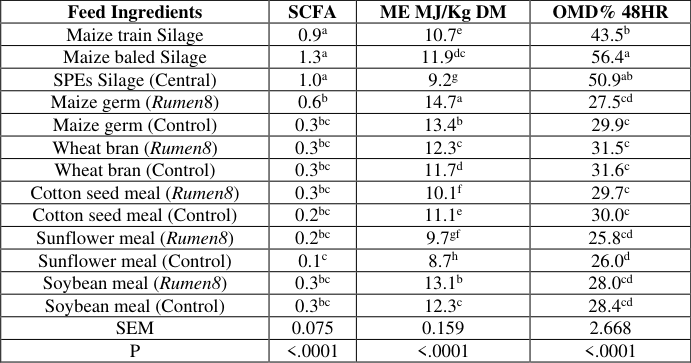 Table 3
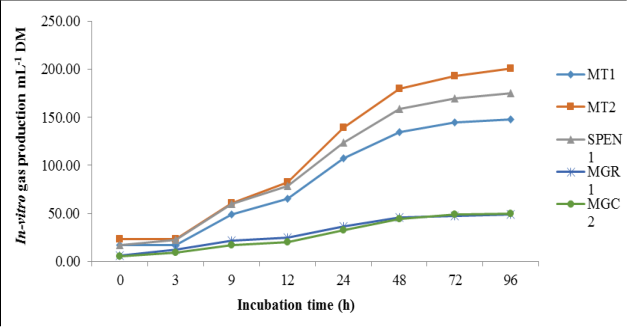 Figure 2
Introduction
Livestock production in the tropical regions of Kenya is affected by the inadequate supply of quality feeds [1] . The optimal dairy cattle feeding regime should consist of 75% energy sources, 24% protein sources and 1% mineral sources [2,3] . The nutritive value of an animal feed is determined predominately by its digestibility, which affects intake. Digestibility and intake, in turn, determine the feeds' influence (such as support of milk synthesis) on productive performance [4] . The performance of animals maintained in resource-poor surroundings is usually poor due to seasonal fluctuations in the quality and supply of animal feeds. When accessible even in limited quantities, the fibrous feeds such as cereal crop residues and poorquality mature grasses can not maintain animals during much of the year [5] . In-vitro gas methods primarily measure digestion of soluble and insoluble carbohydrates [6] , and the amount of gas produced from a feed on incubation reflects production of volatile fatty acids (VFA), which are a major source of energy for ruminants. Rumen fermentation by anaerobic microbes results in production of short chain fatty acids (SCFA), gases (carbon dioxide (CO 2 ) and methane (CH4)) and microbial mass [7] . The 3R Project Kenya documentation of KMDP fodder interventions (Maize train/baled silage, service provider enterprises (SPEs) silage, and dairy ration formulation using Rumen8 software) reported that with good quality (maize, sorghum, grass) silage to replace hay in the total mixed rations, the farmer can reduce the share of dairy meal in the ration and cost price of milk. Use of SPE silage-making services was most frequent among farmers in Central and Eastern regions, where the majority (75%) of farmers used the services at least four times per year [8] . Scarcity and low quality of feed resources constitute one of the major constraints to improved dairy productivity. Therefore, improving the efficiency of feed conversion to milk can have a significant impact on the productivity and profitability of dairy farms. This experiment determined the actual nutritional quality of dairy ration ingredients and fodder crops used in interventions adopted by dairy farms in Kenya.
Materials and Methods
This experiment involved laboratory analysis to determine the nutritive value of feed samples from different interventions;
Maize train and baled silage
This silage was prepared in the sampled farms by the aid of Kenya market-led dairy program (KMDP) in North Rift region. The process involved land preparation, seed selection (Selection of forage maize variety or hybrid suitable for forage production i.e. with low NDF, cob to stem ratio of 50:50 (DM basis) and high in starch, planting (the correct seed rate to get the desired plant population avoid plant competition and ensure maximum yield per acre or hectare), Weed and pest control, harvesting (done at the right stage aimed at a DM level of the whole crop of 30-35% and a starch level of at least 30%, chopping and kernel which reduced losses, enables easier compaction, increased voluntary feed intake per cow and avoids selective feeding. Transportation, ensiling and Compaction (using the heaviest machine available within 12 hours), covering, and proper feeding-out of silage where quick removal of silage prevented heating up, moulding and rotting of silage at the face of the silo. Forage Innovation Team Ltd (FIT Ltd), offered professional forage baling services to dairy farmers whereby fresh maize from the field was chopped and baled directly or ensiled maize that is being scooped from a bunker for baling. Silage bales were wrapped with 6 to 8 layers of stretch foil that made them less vulnerable to damage during handling, transport and storage.
Silage made by Service provider enterprises (SPEs)
This silage was made by groups of youth in Central, Eastern and some parts of North Rift (Baringo) regions who had received practical training, facilitated by SNV, on silage making. They offered "next door" services in fodder establishment, silage making and some advisory services. Most farmers were harvesting their maize at milky stage which made it easier for the use of chaff cutters which lack kernel crusher. The chopped maize forages were later transported for ensiling in pit silos. Compared to maize train and baled silages, SPEs silage was made using molasses to enhance fermentation process which compensate poor crop production or silage management.
Feed ingredients used in Rumen8 software
A dairy ration formulation software was introduced and equipped with a Kenyan Feed Library with support from KMDP. The software balanced rations using the available feed resources (maize silage, hay, maize germ, wheat bran, wheat pollard, cotton seed meal, sunflower meal, soybean meal) on the farms to formulate a total mixed ration that allowed the dairy cows to increase DM intake and thus increase milk production and productivity.
Control diets
The diets included maize silage made on-farm without any advisory services, concentrates (maize germ, wheat bran, cotton seed meal, sunflower meal, soybean meal) from local feed millers) that were used to formulate rations without the use of feed balancing (Rumen8) software. The farms which were using the control diets were selected based on the regions where the interventions were being applied.
Proximate analysis
Proximate composition (dry matter (DM), crude protein (CP), Ether Extract (EE) and ash) of the feed samples were analysed in duplicate as per the standard procedures [9] . The cell wall constituents, neutral detergent fibre (NDF) and acid detergent fibre (ADF) were determined [10] . Dry matter was determined by drying samples of feed ingredients at 105 o C for 15 hours. Feed ingredients, total mixed ration (TMR) and fecal samples were weighed and dried at 60°C for 48 hours for DM determination. Dried samples were ground to pass a 1-mm screen and analyzed for total N and NDF [10] , and ash by combustion in a muffle furnace at 600°C for 8 h. Acid insoluble ash in feed and feces was determined to estimate apparent digestibility of DM.
In-vitro degradability
Rumen liquor was collected in morning (6am) from a fistulated steer animal before feeding and watering into a prewarmed thermos-flask and taken to the laboratory. One litre of rumen fluid from the cows was kept in a warm flask after filtering through two layers of cheese-cloth to obtain fluid which was then flushed with carbon dioxide (CO 2 ) and combined with buffers to simulate the action of saliva. A weight of 200mg of feed samples (1mm screen) in duplicate were prepared and placed into 100ml glass syringes in duplicate. The rumen fluid and buffer medium were mixed in the ratio of 1:2 (v/v). Buffer -rumen fluid mixture, 30ml was added into the syringes containing samples, shaken gently and any air bubbles released. The syringes were incubated at 39 o C in a thermostatically controlled water bath for 0-96 hours. The samples and blanks (rumen fluid +buffer) were run in duplicates. The fermentative activity of the mixed microbial population was determined using the gas production technique [6] . The volume of gas produced was determined at 3, 6, 9, 12, 18, 36, 48, 72, and 96 hours by reading the calibration of the piston. The two blank syringes containing only 30 ml of buffered rumen fluid were incubated to estimate gas production due to endogenous substrates corrections. The gas produced was the total increase in volume minus the mean blank value. The calculated values of gas production were fitted into the model developed by [11] to determine the degradability of the feed ingredients. Y= a + b (1-e -ct ) where: Y=the volume of gas produced with time (t) a=initial gas production b=gas produced during incubation c= gas production rate constant (fraction /hour) Then (a+b) represents the potential extent of the gas production. The in-vitro OM digestibility was estimated using methods by [10] . Metabolizable energy (ME) content was calculated using the equation [6] as follows; ME (MJ/kg DM) = 1.06 + 0.1570 × Gas produced (ml/200 mg DM) + 0.0084 × CP (g/kg DM) + 0.022 × EE (g/kg DM) -0.0081 × Ash (g/kg DM).
Data analysis
Data (DM, CP, ME, EE, NDF, ADF and Nitrogen use efficiency) from this experiment were subjected to analysis of variance (ANOVA) using the General linear model (GLM) of statistical Analysis system [12] . The Significant means was separated using LSD at 5% level of significance. The DM content was 92.5% in sunflower meal and 32.3% in SPEs silage which was different (p<0.05). Dry matter content in maize train silage was higher (34.4%) compared to SPEs silage (32.3%) (p<0.05). The CP content was high in Soybean meal 48.80% and lowest in silage from SPEs 7.2%. The NDF of the ingredients sampled from farms using rumen8 feed formulation software was 46.6% in maize train silage and 13.87% in Soybean meal. Maize train silage had 45.8% NDF which was lower than 46.6% in SPEs silage (P>0.05). Acid detergent fibre (ADF) was 35.9% in sunflower meal and 9.3% in maize germ meal. The ash contents were high in soybean meal (7.0%) and lowest in maize germ meal (3.0%) (p<0.05). Ether extracts ranged from 12.3% in maize germ to 3.4% in soybean meal. There were significant variations in the feed ingredients in gas production and estimated parameters. The gas production of maize train silage (179.39ml/200g DM) was higher than SPEs silage (158.71ml/200g DM) (p<0.05) at 48h. Sunflower meal produced the lowest gas at 48h (43.11ml/200g DM). The rate of gas production was highest in wheat bran (32.2%/h) and the lowest in maize train silage (0.2%/h). Potential gas production (b) differed (P<0.0001) among the feed ingredients. While there was a wide range in rates of gas production (c) among feeds, there were no differences (P>0.05). The ME was highest (14.7MJKg -1 DM) in maize germ meal and lowest (8.7MJKg -1 DM) in sunflower meal (Table 3). However, ME did not differ between the maize train and SPEs silages (P>0.05). The SCFA was highest (1.3%) in maize baled silage and lowest (0.1%) in sunflower meal. The SCFA did not differ among the silage samples (maize train and SPEs silages) (P>0.05). There was no significant difference (P>0.05) in SCFA among the concentrate feed ingredients. Organic matter digestibility (OMD %) was highest in maize baled silage (56.4%) and lowest in sunflower meal (25.8%). The OMD did not vary among the concentrates (P>0.05).
| Feed Ingredients | SCFA | ME MJ/Kg DM | OMD% 48HR |
|---|---|---|---|
| Maize train Silage | 0.9a | 10.7e | 43.5b |
| Maize baled Silage | 1.3a | 11.9dc | 56.4a |
| SPEs Silage (Central) | 1.0a | 9.2g | 50.9ab |
| Maize germ (Rumen8) | 0.6b | 14.7a | 27.5cd |
| Maize germ (Control) | 0.3bc | 13.4b | 29.9c |
| Wheat bran (Rumen8) | 0.3bc | 12.3c | 31.5c |
| Wheat bran (Control) | 0.3bc | 11.7d | 31.6c |
| Cotton seed meal (Rumen8) | 0.3bc | 10.1f | 29.7c |
| Cotton seed meal (Control) | 0.2bc | 11.1e | 30.0c |
| Sunflower meal (Rumen8) | 0.2bc | 9.7gf | 25.8cd |
| Sunflower meal (Control) | 0.1c | 8.7h | 26.0d |
| Soybean meal (Rumen8) | 0.3bc | 13.1b | 28.0cd |
| Soybean meal (Control) | 0.3bc | 12.3c | 28.4cd |
| SEM | 0.075 | 0.159 | 2.668 |
| P | <.0001 | <.0001 | <.0001 |
Table text extracted from the original PDF; superscript letters are shown inline. The original table image is below.
View original table image
Results
Results
Chemical composition
Chemical composition
In-vitro Degradability
In-vitro Degradability
Discussion
The NDF and ADF results in maize silages from both interventions were comparable to results by [13] who reported NDF and ADF contents of 48.6% and 25.3%, respectively.The difference in NDF and ADF content in SPEs silage compared to maize train/baled silages was attributed to the quality of maize harvested for ensiling, stage of harvesting, crushing of maize kernels, and proper compaction which guarantees good quality silage. It was noted that farmers using maize train and baler interventions in the North Rift region considered the cutting height of the maize forage compared to farmers using SPEs intervention in Central and Eastern regions. [13] noted that increasing the cutting height from 10cm-30cm increases the dry matter (DM%) content by 1.5%, since most of the wet stem materials were left in the field, but decreases yield by 0.4ton DM/acre. The low detergent insoluble cell walls (NDF and ADF) content was attributed to good characteristic of the feed, same observations were made by [14] . High NDF and ADF result to longer eating time, low feed intake, low digestibility as well as animal's poor performance [15] . Due to limited land and feed availability in both Central and Eastern regions, dairy farmers were relying on poor quality maize (with high moisture and not ripe) for silage making which increased the NDF and ADF contents. The results of organic matter digestibility (OMD%) in maize train and baled silage (50.9 and 56.4%) were lower than (58.1%) reported by [13] . While silage from SPEs had the lowest OMD which was attributed to high NDF. The in-vitro gas production and fermentation parameters indicate the presence of potential degradable nutrient in the feed ingredients. The high gas production of maize train silage compared to silage from SPEs (Figure 2) was attributed to organic matter (OM) availability which was fermented to form volatile fatty acids and, therefore, high gas volumes was produced. [4] attributed high gas production to nutrient availability and accessibility of feed to microbial enzymes hence high extent of fermentation, same observations were reported by [16] . The ME value of the feeds were within the ranges reported by [6] , where values of various European feeds (from forages to cereals) ranged from 4.5 to 15MJkg -1 DM respectively. A study by [13] reported an average ME of 11.5MJ/kg DM in maize train and baled silage, which were close to 11.3MJ/kg DM found in this study. This demonstrates that the effect of NDF on fermentation becomes less important as the level of NDF declines. Higher NDF-ADF contents gives lower ME/kg DM, same observations were found by [13] . The dairy cow requires approximately 5.2 MJ ME/kg DM to produce a litre of milk. Increasing ME in maize silage can lead to an increase of milk production with about 13% (11.4/10.1 MJ/kg DM) [13] . In addition to carbohydrate fermentation, protein degradation also leads to a proportionally smaller amount of SCFA [17] as observed among the protein concentrates. Although gas production reflects the amount of substrate used for VFA production, it has also been shown that gas production is positively related to feed intake [7] and microbial protein synthesis [18] .
Conclusion
Maize train and baler intervention are the best fodder conservation measure that can guarantee quality silage for the dairy cows. Fodder preservation requires the right mechanization measures to ensure longer shelf-life for enhanced quality (fermentation, nutritive value) and reduction of losses. Chemical analysis of feed ingredients did not vary across the interventions.
Recommendation
1. Farmers should focus on quality in the execution of all steps in the silage making process which is the shortest route to reduce the losses. 2. Farmers across the regions can use the feed balancing (Rumen8) software to ensure compounding quality feed.
Acknowledgement
AcknowledgementThe authors thank the 3R (Resilient, Robust and Reliable) project under SNV-Kenya and CESAAM (Centre of Excellence in Sustainable Agriculture and Agri-business Management) for financial support to carry out this study.
Figures and tables from the paper
| Feed Ingredients | DM % | CP % | EE % | NDF % | ADF % | Ash % |
|---|---|---|---|---|---|---|
| Maize train silage | 34.4d | 8.1f | 3.4de | 45.8a | 25.7d | 4.1d |
| Maize silage (Baled) | 34.9d | 7.9f | 3.4de | 44.6a | 25.7d | 3.9d |
| SPEs Silage | 32.3e | 7.2f | 3.1e | 46.6a | 28.1c | 5.2c |
| Maize germ (Rumen8) | 89.8b | 11.5e | 12.3a | 35.7bc | 9.3f | 3.0e |
| Maize germ (Control) | 89.5b | 11.5e | 12.4a | 35.7bc | 9.1f | 3.2e |
| Wheat bran (Rumen8) | 87.3c | 16.7d | 3.8d | 34.5c | 13.3e | 5.9bc |
| Wheat bran (Control) | 87.2c | 16.3d | 3.9d | 34.8c | 13.2e | 5.8bc |
| Cotton seed meal (Rumen8) | 90.7b | 34.9b | 7.1c | 35.9bc | 30.7b | 5.4c |
| Cotton seed meal (Control) | 90.5b | 35.0b | 7.1c | 36.1bc | 31.0b | 5.3c |
| Sunflower meal (Rumen8) | 92.5a | 34.1bc | 9.2b | 37.3b | 35.9a | 6.3ab |
| Sunflower meal (Control) | 90.4b | 33.6c | 9.3b | 37.4b | 35.6a | 6.4ab |
| Soybean meal (Rumen8) | 90.0b | 42.7a | 3.6de | 13.9d | 9.5f | 7.0a |
| Soybean meal (Control) | 89.6b | 42.8a | 3.4e | 14.1d | 9.7f | 6.9a |
| SEM | 0.434 | 0.415 | 0.259 | 0.638 | 0.416 | 0.259 |
| P | <.0001 | <.0001 | <.0001 | <.0001 | <.0001 | <.0002 |
Table text extracted from the original PDF; superscript letters are shown inline. The original table image is below.
View original table image
| Feed Ingredients | Total Degradation (%) | — | Fermentation Characteristics | — | — | — | — |
|---|---|---|---|---|---|---|---|
| 24 | 48 | a | B | a+b | C | RSD | |
| Maize train Silage | 42.5c | 26.6c | 10.9c | 9.8c | 20.8c | 0.2e | 16.7c |
| Maize baled Silage | 56.7a | 40.5a | 13.8a | 15.3a | 29.1a | 0.2e | 21.2a |
| SPEs Silage | 45.4b | 34.7b | 12.6b | 11.9c | 24.6b | 0.2e | 17.5b |
| Maize germ (Rumen8) | 12.1h | 9.1h | 8.0e | 13.8b | 15.7d | 12.0c | 3.9i |
| Maize germ (Control) | 12.6g | 11.6e | 4.4l | 2.5i | 6.9k | 0.1e | 4.8g |
| Wheat bran (Rumen8) | 14.2ef | 13.1d | 6.0g | 5.2e | 11.2f | 32.2a | 7.4f |
| Wheat bran (Control) | 15.3d | 13.2d | 7.1f | 4.3f | 11.4e | 22.3b | 7.5f |
| Cotton seed meal (Rumen8) | 12.1h | 10.1g | 8.7d | 3.0g | 8.7h | 22.1b | 4.2h |
| Cotton seed meal (Control) | 12.5g | 10.4f | 5.7i | 2.7h | 8.5i | 7.1d | 4.1h |
| Sunflower meal (Rumen8) | 7.9i | 5.9l | 4.4l | 1.3k | 5.8m | 7.5d | 4.7g |
| Sunflower meal (Control) | 7.1j | 6.1k | 4.6k | 1.4k | 5.9l | 7.2d | 5.0g |
| Soybean meal (Rumen8) | 13.8f | 7.4j | 5.8h | 2.4j | 8.2j | 12.6c | 7.8e |
| Soybean meal (Control) | 14.4e | 7.7i | 4.9j | 4.4f | 9.3g | 12.51c | 9.1d |
| SEM | 0.124 | 0.023 | 0.025 | 0.057 | 0.033 | 0.093 | 0.095 |
| P | <.0001 | <.0001 | <.0001 | <.0001 | <.0001 | <.0001 | <.0001 |
Table text extracted from the original PDF; superscript letters are shown inline. The original table image is below.
View original table image
References
15 in the original paper- Osuga IM, Abdulrazak SA, Ichinohe T, Fujihara T. Chemical composition degradation characteristics and effect of Tannin on digestibility of some Browse species from Kenya harvested during the wet season. AsianAustralasian journal of Animal science. 2005; 18(1):5460.
- Goopy JP, Gakige JK. Improving productivity in Kenyan Smallholder Dairy systems through selective, intensive education and supported adoption, 2016. https://hdl.handle.net/10568/77015.
- Lukuyu B, Franzel S, Ongadi PM, Duncan AJ. Livestock feed resources: Current production and management practices in central and northern rift valley provinces of Kenya. Livestock Research for Rural Development. 2012; 23(5):112.
- Getachew G, Robinson PH, DePeters EJ, Taylor SJ. Relationships between chemical composition, dry matter degradation and in vitro gas production of several ruminant feeds. Animal Feed Science and Technology. 2004; 111(1-4):57-71.
- Osuga IM, Wambui CC, Abdulrazak SA, Ichinohe T, Fujihara T. Evaluation of nutritive value and palatability by goats and sheep of selected browse forages from the semi-arid area of Kenya. Animal Science Journal. 2008; 79:582-589.
- Menke KH, Steingass H. Estimation of the Energetic Feed Value obtained from chemical analysis and in-vitro gas production using rumen fluid. Animal resource development. 1988; 28:7-55.
- Blümmel M, Fernandez-Rivera S. In vitro gas techniques and efficiency of microbial substrate degradation. Animal Nutrition and Feed Technology 2002; 2:93-115.
- Kilelu CW, Koge J, Kabuga C, van der Lee J. Performance of emerging dairy services agri-enterprises: a case study of youth-led service provider enterprises (SPE) (No. 1094). Wageningen Livestock Research, 2018
- AOAC (Association of Official Analytical Chemists). Official Methods of Analysis of the Official Analytical Chemists, 19 th Edition, AOAC, Washington, DC, USA, 2012.
- Van Soest PJ, Robertson JB, Lewis BA. Methods for dietary fibre, Neutral detergent fibre and non-starch polysaccharides in relation to Animal nutrition. Journal of dairy Science. 1991; 74:3588-3597.
- Ørskov ER, McDonald I. The estimation of protein degradation in the rumen from incubation measurements weighted according to the rate of passage. Journal Agricultural science 1979; 92:499-503.
- SAS. Statistical Analysis System Institute. SAS User's Guide. Statistics, Software Version 9.00 (TS MO) SAS Institute, Inc., Cary, NC, USA, 2002
- Leeuwarden. Assessment of KMDP Forage Interventions in North Rift, Kenya. The Case of Agricultural Contracting and Baling of Maize Silage. 2019; https://www.cowsoko.com/programs/kmdp/publications
- Lamba JS, Wadhwa M, Bakshi MPS. In vitro Methane Production Potential and in-succo Degradability of Energy Feeds. Indian Journal of Animal Nutrition. 2014; 3l(2):l3l-137
- Mc Donald P, Edward RA, Greenhalgh JFD, Morgan GA. Animal Nutrition 6 th Pearson Educational limited. Edinburgh, Great Britain. 2002, 544.
Cited by 1
From OpenAlex, OpenCitations and reference lists read by Scinovex
- Determinants of utilization of recommended forages and concentrates among smallholder dairy farmers in Nakuru County, Kenya
Flora Gash Kambabazi, George Owuor, Anthony Macharia King’ori · International Journal of Veterinary Sciences and Animal Husbandry · 2025
This paper examined the factors influencing the choice of utilizing the recommended forages and concentrates among smallholder dairy farmers in Nakuru County, Kenya. The study was based on data collected from a sample of 225 smallholder dairy farmers from Nakuru County, Kenya. The statistical programme STATA was used to analyse the data. Probit model result showed that factors including gender, breed types, land ownership, cow live weight, credit use, group membership, production system, herd size, extension contacts, education, and experience significantly affected the choice of utilizing rec