
Research article · 2018 · Full text
International Journal of Advanced Biochemistry ResearchEvaluating the nutritional value and shelf life of fish patty enriched with protein concentrate from Abramis brama at ambient temperature
Volume 2(2) · Pages 16–23 · DOI: 10.33545/26174693.2018.v2.i2a.17 ↗
Research areasAquaculture Nutrition and GrowthAquaculture disease management and microbiota
Abstract
Author-writtenIn recent decades, because of the increased population and the importance of animal protein, the production of high value added products from marine resources has attracted much attention. On the other hand, protein deficiency-induced nutrition is one of the most important problems in most developing countries. Therefore, the addition of controlled amounts of FPC to daily food intake can solve this problem. The perpose of present study is evaluating the nutritional value and shelf life of fish patty enriched with protein concentrate from Abramis brama (FPC) at ambient temperature. In this study, FPC (type A) was prepared from bream fish by chemical method. Then the fish patty produced in 4 groups of control, 5%, 10% and 20% FPC were packed and kept at ambient temperature. Chemical parameters such as pH, peroxide value and total volatile base nitrogen and sensory evaluation (taste, smell, color and texture) of fish patty were studied by trained members for a period of 30 days. Chemical results of the samples showed that the pH value was low in all treatments during storage, but TVB-N and PV values increased significantly in all treatments during storage (P0.05). Decrease in color factor was not significant. The color factor was not significantly decreased (P>0.05), and 10% FPC and control were better than other treatments at the end of storage period. Regarding the tissue parameter, fish patty containing 10% FPC in 10 and 30 days of storage compared to the control treatment showed a significant difference (P
Summary
Source-checkedPlain-language reading of the full paper, prepared with AI and checked against the text. Each point links to the authors' own words.
Why it matters
- Increasing global populations and the critical need for animal protein have driven interest in creating high-value products from marine resources. View evidence ↗
- Protein deficiency is a major nutritional issue in developing countries, which could be addressed by adding Fish Protein Concentrate (FPC) to daily diets. View evidence ↗
- FPC is a high-quality, odorless, and flavorless white powder containing 80% to 90% protein. View evidence ↗
The question
- The study aimed to evaluate the shelf life and nutritional value of fish patties enriched with protein concentrate from bream fish (Abramis brama) stored at ambient temperature. View evidence ↗
What they did
- FPC was produced from bream fish meat using isopropanol as a solvent, and then incorporated into fish patties at various concentrations. View evidence ↗
- Fish patties were prepared with 0% (control), 5%, 10%, and 20% FPC, packed in polyethylene bags, and stored at ambient temperature for 30 days with measurements taken at 1, 10, 20, and 30 days. View evidence ↗
- A semi-trained panel of 10 people used a hedonic scale to evaluate the texture, color, odor, and flavor of the patties. View evidence ↗
What they found
- By day 30, the 20% FPC-enriched patty had the highest protein content (17.44%), while the control had the lowest (4.78%). View evidence ↗
- The pH of all patties decreased during storage, with the control maintaining the highest pH and the 20% FPC treatment the lowest by day 30. View evidence ↗
- Total volatile base nitrogen (TVB-N) increased in all groups over 30 days, rising from 7 to 21 mg N/100g in the control and up to 25.90% in the 20% FPC group. View evidence ↗
- Regarding texture, the 10% FPC-enriched patty received the highest score (2.5) at the end of the storage period. View evidence ↗
What it means
- The authors concluded that 5% and 10% FPC enrichments were superior and comparable to the control, but recommended the 5% FPC treatment for production due to lower costs. View evidence ↗
- The study found that enriching the fish patty with 20% FPC resulted in a shorter shelf life. View evidence ↗
Visual summary
3 visualsIllustrations explain the paper; charts are replotted from the paper's own table values.
Experimental Setup
AI-generated conceptual illustration (fish patties made from Abramis brama protein concentrate in polyethylene bags). It explains the idea and does not show study data.
View source evidence ↗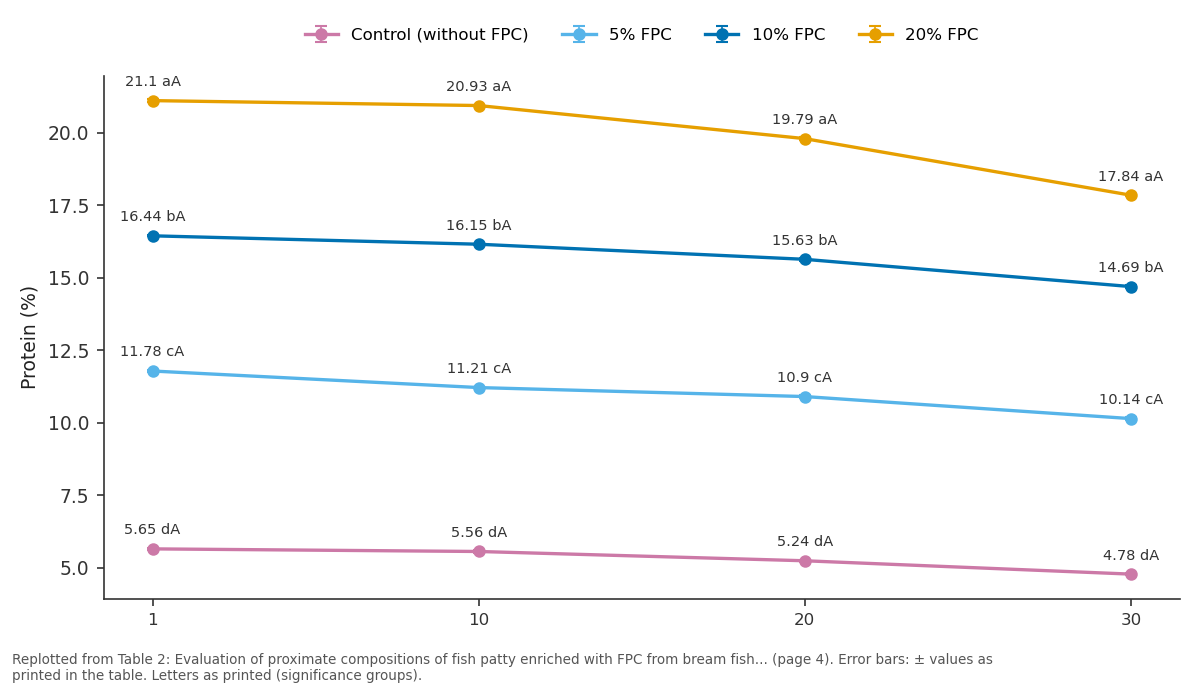
Control (without FPC) and 5% FPC and more: 1 vs 10 vs 20 vs 30
Replotted from Table 2 (page 4) of the original paper. Every bar is the paper's own table value.
View source evidence ↗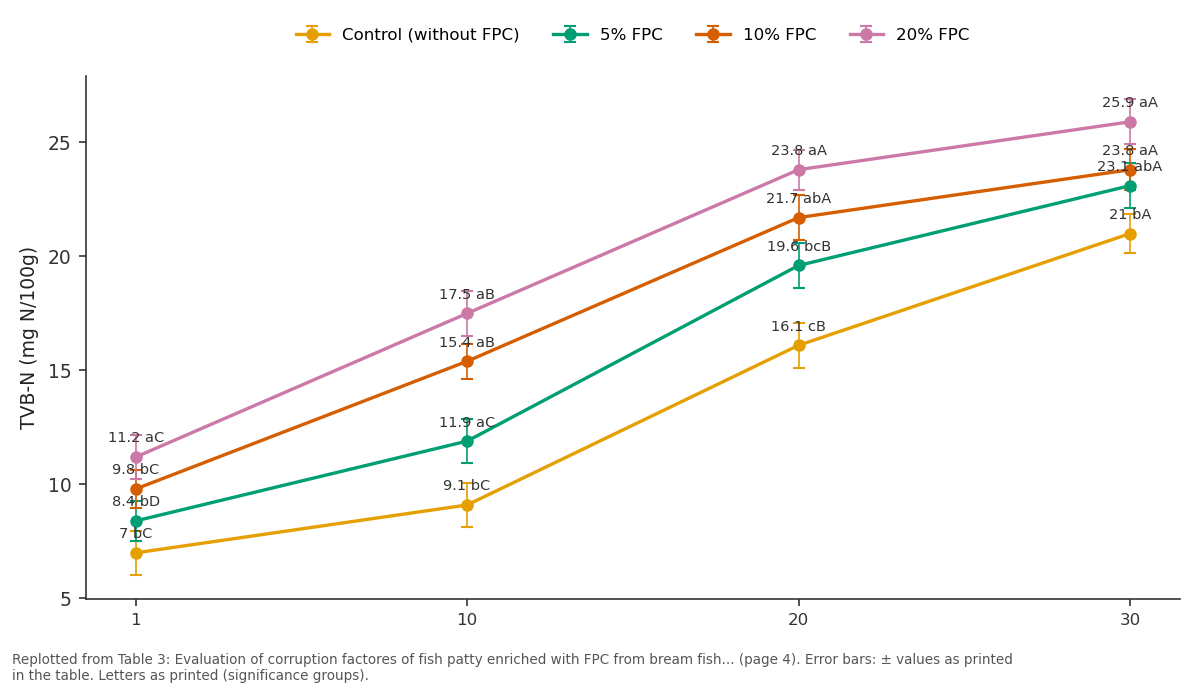
Control (without FPC) and 5% FPC and more: 1 vs 10 vs 20 vs 30
Replotted from Table 3 (page 4) of the original paper. Every bar is the paper's own table value.
View source evidence ↗Figures & tables
From the original paper Table 1
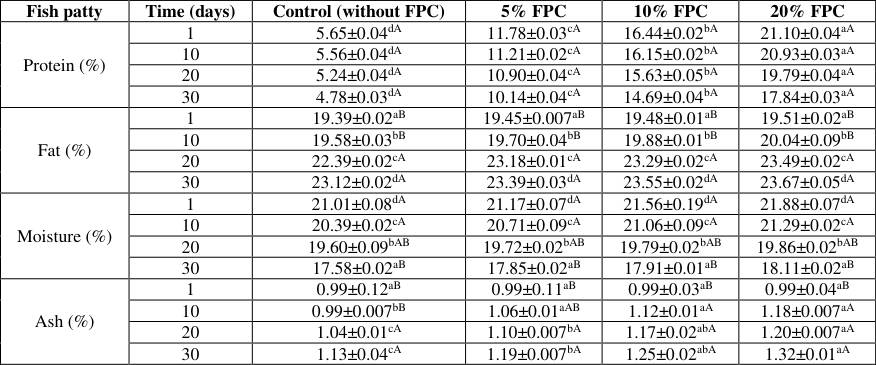 Table 2
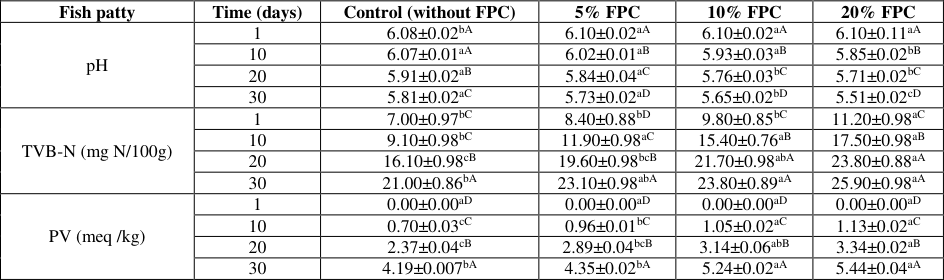 Table 3
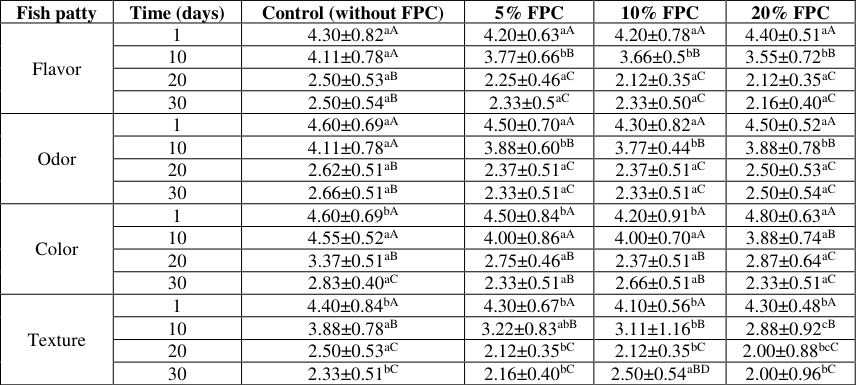 Table 4
Introduction
The importance of fish as a very useful food source and a valuable animal protein is no worn on one; so that about 20% of the animal protein required by humans is provided in this way and has a close competition with other sources of animal protein [1] . In this regard, advanced countries, with a better exploitation of water resources, breeding and cultivating a variety of aquatic species and investment in the processing sector, can step up the per capita consumption of fish and the elimination of protein poverty in their societies. Today, more than 150 kinds of food and seafood such as sausages, sausages, surimi, salami, etc. are produced in these countries using various types of fish. The global standard of aquaculture per capita consumption is 19.2 kg [2] . Unfortunately, in Iran, this is estimated at 8.5 kg [3] , which is much low than the global standard. It is no comparable to the per capita consumption of countries such as Japan with an annual consumption of about 70 kg [1] . Based on the average age and weight of the population, the average person's need for protein content is about 15.50 kg per year. So, in total, millions of tons of pure protein will be needed annually. The World Food and Agricultural Organization (FAO) also estimate the amount of protein required for each person recommends an average of 29 grams per day. On the other hand, nutritionists believe that each person's daily diet should contain at least 15 grams of animal protein. The rest of the body protein needs can be provided with the help of vegetable proteins, and if the consumption of animal protein be less than 15 g per day can cause protein poverty [4] . Based on the above, a large proportion of people are suffering from protein poverty, International Journal of Advanced Biochemistry Research because studies have shown that 19.5% of people in different societies use more than 30 g and 19.8% of them use 30-50 g per day of animal protein. While about 60-70% of humans suffer from protein deficiency when they eat less than 15 grams of protein per day [1] . Bream fish (Abramis brama) is one of the species that has an economic value and has been commonly used for its good taste [5] . Fish Protein Concentrate (FPC) is also a white powder, odorless and flavorless from fish that contains 80 to 90% of the protein with a good quality [6,7] . For the first time in the late 60s, it was recognized as the most fruitful way to overcome global malnutrition [8] . This type of protein is a human consumable product that can usually be used in combination of various cooked materials. Fat and undesirable substances remove from the final product by using the solvents such as alcohol, ethanol or isopropanol [9] . In fact, FPC is used as cheap food supplements [10,11] and because FPC type A does not smell and taste, its consumption alone is not pleasant [12] . Therefore, finding ways to increase consumption is a major concern, as well as the amount of FPC added to food, it should be some extent that it does not affect the characteristics and characteristics of the food. So far, good results from the combination of FPC with all kinds of macaroni, milk-based beverages, sauce, baby food, dietary foods and baby's breakfast is obtained [4] . On the other hand, the experimental production of surimi-based fish products such as fish cakes, fish patty and etc began in China in 1984 to 1985, but did not continue and was restarted in 1993 [13] . Fish patty is a ready food that is well cooked and has a good demand [14] . The production of fish patty has not been done so far in Iran and is also limited in other countries. Therefore, the purpose of this research was to produce fish protein concentrate by using a solvent (isopropanol) of bream fish (A. brama) meat, and then producing patty with different percentages from it. The nutritional value and shelf-life of them compared to common patty (unenriched) were studied for 30 days at an ambient temperature.
Material and methods
Material and methods
Preparation of fish
Bream fish after catch of the Aras dam (west Azarbaijan province, Iran) along with ice and water in the CSW (cilled sea water) tank, was transferred to the National Fish Processing Research Center, Bandar Anzali (Guilan province, Iran) and was placed in a chill room at 5 to 8 °C. After weighing the fish (35 kg), they were placed in baskets for washing with tap water. Then the head, tail, and viscera were discarded. After this stage, the fish were transferred to the debone machine and the bone, skin, and fin were removed from the meat.
Production of FPC type A from bream fish
For production of FPC, fish meat and solvent (99% isopropanol) with the ratio of 1 to 1 for 50 minutes at ambient temperature (24 °C) were placed. After this time, the first press was performed and again isopropanol was added to the pressed sample with a ratio of 1 to 1. Samples were placed in a water bath for 90 minutes at 75 °C. After this time, the sample was re-pressed and placed in a water bath at a temperature of 75 °C for 70 minutes (1 meat: 1 isopropanol solution). The sample was again pressed and transferred to a dryer for 8 hours at 125 °C. At this point, the final moisture content should be less than 8%. The sample was milled and passed through a sieve (the mesh was 100 micron) [4] .
Production of fish patty with FPC
In order to produce the fish patty, 1 kg of sugar was added to the lukewarm water. Then the leaven (it was suitable for puffing the patties and forming the tissue) was added and stirred. 15 eggs and 2 kg of flour added to the mixture and well mixed. Then the cryoprotectant was added to the mixture and the resulting paste was kneaded to allow adhesion. At the end, a little oil was added to the paste. The paste was divided into four equal parts for preparing the treatments. FPC was added in concentrations of 0%, 5%, 10% and 20%. The pastes in a container containing some flour on the floor were placed in an oven for half an hour to prepare for cooking. Then, the temperature of the oven was increase to 180 °C so that it can be cooked for half an hour. After cooling, samples were packed in polyethylene bags under normal air and stored at ambient temperature for one month. Measurement intervals were 1, 10, 20 and 30 days after the production of patties.
Measuring the amount of crude protein
The crude protein content of samples was calculated on the basis of nitrogen content; which was determined by the Macro-Kjeldahl system (Techno Service Co, Behr, K 24, Germany) and finally by multiplying the nitrogen number by a factor of 6.25 [15] . The formula is as follows: Protein (%) = [consumed H2So4 content (ml) ×0/014 ×0.1×6.25 ×100]/ sample (g).
Measuring the amount of ash
The ash content of samples was estimated by heating the samples overnight in a furnace (Muffle Furnace, SEF-202, Korea) at 525 • C for 12h [15] . The formula is as follows: Ash (%) = [ash (g)/ sample (g)] ×100
Measuring the amount of moisture The moisture content of samples was determined by drying to a constant weight at 105 • C in an oven [15] . The formula is as follows: Moisture (%) = [(initial weight -final weight)/ initial weight] ×100
Measuring the amount of fat
Fat was extracted from minced fish and fish patty in a Soxhlet extractor (Behr, Labor-Technik, Germany) using petroleum ether. The crude lipid content was determined gravimetrically following oven-drying of the extract at 105 • C overnight [15] . Fat (%) = [fat (g)/sample (g)] ×100
pH measurement 20 g of fish patty was added to 100 ml of distilled water and mixed. The resulting mixture was then straightened after a few minutes. Then, pH of the samples was measured using a pH meter (Digital-Microprocessor pH Meter, LT-50, India), calibrated at pH 4 and 7 [16] .
Determination of total volatile base nitrogen (TVB-N)
Total volatile nitrogen of samples was determined according to the protocol of Parvaneh [17] . Briefly, 10 g fish patty and distillation flask. After a little shaking the balloons by hand, 2 g magnesium oxide and anti-bumping granules were added to them. 25 ml of 2 % boric acid and a few drops of indicator (dissolve 0.1 g phenolphthalein in 100 ml ethanol 95%) was added to 250 ml Erlenmeyer flask. The distilling flask was heated so that the liquid was boiled in exactly 10 min. Using the same rate of heating was distilled for exactly 25 min. After the distillation, the solution collected in a receiver flask was titrated to purple endpoint 0.1 N H2SO4. Total volatile base nitrogen expressed as mg nitrogen per 100 g sample: TVB-N (mg nitrogen/100 g sample) = consumed H2So4 content (ml) ×14
Determination of peroxide value (PV)
The peroxide value (PV) of samples was determined by AOAC (15) and expressed as milli-equivalents of oxygen per 1000 g oil. Accurately 50 g fish patty was weighed into 250 ml ground glass. 100 ml chloroform was added. The specimens were kept in a dark place for 2 hours and then filtered. 25 ml of the filtered solution was transferred into a glass jar and placed under the hood to evaporate the solvent. To the rest of the filtered solution, 37 ml acetic acid, 30 ml distilled water, 1 ml potassium iodide and approximately 1 ml starch solution were added. The solution was gently swirled. When it was completely evaporated, the amount of residual fat in the container was weighed. The residual solution was titrated with 0.01 N Na2S2O3. The PV of samples was calculated by using the following formula: PV (milli-equivalents of oxygen per 1000g fat) = 0.01×1000× ml of sodium thiosulfate for titration/ residual fat in the container (g).
Sensory analysis
For sensory analysis, samples were fried in a fryer with sunflower oil at 180 ° C for 4 minutes [18] . Sensory testing was performed using a semi-trained panel of 10 people. These people evaluated the flavor, odor, color and texture of samples on the hedonic scale [19] . After evaluating each sample, the panel members were rinsed thoroughly with some water and the next test was performed.
Statistical analysis
Statistical analysis was performed using SPSS-17 and Minitab-16 softwares. After the normal distribution of data using the Kolmogorov-Smirnov test, Duncan's Multiple Range and Tukey tests (p = 0.05) were used to determine any significance of differences between means. The nonparametric method of Mann-Whitney was used to analyze the sensory test. All tests were performed in triplicate, and the data are expressed in terms of mean±standard deviation (SD).
Results
The proximate composition of FPC and minced bream fish is shown in Table 1. The results of this study showed that there was a significant difference between the FPC and minced bream fish in terms of protein content (p<0.05), so that the amount of protein in FPC and minced bream fish was 20.11 ± 0.02 and 91.63 ± 0.09, respectively. The high protein in the FPC is due to the protein purity compare with minced bream fish. The results of fat content were converse of protein content and the fat of FPC was significantly lower than minced meat of bream fish. This difference was statistically significant (p<0.05). The moisture and ash values were also lower in the FPC compared to the minced meat of bream fish, and there was statistically a significant difference between them (p<0.05). The amount of protein during the storage period at ambient temperature is shown in Table 2. Based on the results, protein reduction in different treatments was not significant during the whole maintenance period (p>0.05). However, at the end of the maintenance period (day 30), the highest and lowest protein contents was related to fish patty enriched with 20% FPC (17.44%) and control treatment (4.78%), respectively. Meanwhile, there was a significant difference between treatments (p<0.05). In the measurement of fat percentage (Table 2), due to the addition of oil in the formulation of fish patties, it is not possible to accurately analyze the effects of different proportions of FPC on the increase of final absorption in comparison with control treatment. Based on this study, there was no significant difference between different treatments during storage period (p>0.05). In each treatment, fat content increased with increasing time, which was statistically significant. At the end of the maintenance period, the highest fat content was associated with 20% FPC-enriched fish patty with 23.67% of fat and the lowest was for control treatment with 23.12% of fat. There was no significant difference in moisture content between treatments (p>0.05). And the amount of moisture in all treatments gradually decreased with increasing time. The highest moisture content was observed on 30 days in fish patty enriched with 20% FPC, but moisture changes were not significant (p>0.05) (Table 2). Also in this study, ash increased during the storage period in all treatments, except on the first day, as compared to control treatment (p<0.05) (Table 2). Between enriched treatments, fish patty enriched with 20% FPC had the highest amount of ash. However, no significant difference was observed between two treatments with 5 and 10% FPC (p>0.05). Also, this difference was not significant between two treatments with 10% and 20% FPC (p> 0.05). On the other hand, there was significant difference between treatments enriched with 5% and 20% FPC (p<0.05). Changes in the pH of various treatments during the 30 days of storage at ambient temperature are shown in Table 3. The pH of all treatments decreased during storage (p<0.05). Significant differences were observed between control and fish patty enriched with 10% and 20% FPC (p<0.05). The highest pH was observed on the 30th day in control treatment and the lowest pH was observed in 20% FPCenriched fish patties. The value of volatile bases nitrogen in different treatments increased significantly during the maintenance period (p<0.05). In the control sample, it was 7 mg N per 100 g sample on the first day and then reached to 21 mg N per 100 g sample on the 30th day of storage. TVB-N in 5%, 10% and 20% FPC-enriched fish patties respectively increased from 8.40%, 9.80% and 11.22% on the first day to 23.10%, 23.80% and 25.90% on 30th day of storage. In fact, on this day, the lowest increase was observed in control treatment and the highest increase was observed in 20% FPC-enriched fish patty, but there was no significant difference between them and other enriched samples (Table 3). The results also showed that the amount of peroxide (PV) in all treatments except the first day was significantly higher than that of control (p<0.05) sample (Table 3). With increasing time, the amount of PV increased. At the end of the maintenance period, the lowest levels of peroxide were belonged to the control treatment (4.19 mg peroxide per kg fat) and the highest amount was belonged to the fish patty enriched with 20% FPC (5.44 mg peroxide per kg fat). In general, control treatments and 5% FPC-enriched fish patty were at an acceptable level (5 mg peroxide per kg fat) until the end of the maintenance period. The results of flavor evaluation of fish patty during 30 days of storage at ambient temperature are given in Table 4. The results showed that the flavor decreased during storage, but at the end of the maintenance period (30th day), control treatment and other treatments containing FPH were at a qualitative level (p>0.05). This difference was not significant. The results showed that the odor factor decreased during storage, but there was no significant difference between the control treatment and other treatments (p>0.05). Also, the results of color attributes showed that this index had the highest rating at the beginning of the maintenance period, but its rating decreased during storage time (p>0.05). There was no significant difference between treatments. The texture of the samples had a high score at the beginning of the maintenance period, but during the maintenance period their score decreased and this decrease was statistically significant (p<0.05). At the end of the maintenance period, the highest score was for the fish patty enriched with 10% FPC (2.5), but there was no significant difference between other treatments (Table 4).
| Fish patty | Time (days) | Control (without FPC) | 5% FPC | 10% FPC | 20% FPC |
|---|---|---|---|---|---|
| Flavor | 1 | 4.30±0.82aA | 4.20±0.63aA | 4.20±0.78aA | 4.40±0.51aA |
| 10 | 4.11±0.78aA | 3.77±0.66bB | 3.66±0.5bB | 3.55±0.72bB | |
| 20 | 2.50±0.53aB | 2.25±0.46aC | 2.12±0.35aC | 2.12±0.35aC | |
| 30 | 2.50±0.54aB | 2.33±0.5aC | 2.33±0.50aC | 2.16±0.40aC | |
| Odor | 1 | 4.60±0.69aA | 4.50±0.70aA | 4.30±0.82aA | 4.50±0.52aA |
| 10 | 4.11±0.78aA | 3.88±0.60bB | 3.77±0.44bB | 3.88±0.78bB | |
| 20 | 2.62±0.51aB | 2.37±0.51aC | 2.37±0.51aC | 2.50±0.53aC | |
| 30 | 2.66±0.51aB | 2.33±0.51aC | 2.33±0.51aC | 2.50±0.54aC | |
| Color | 1 | 4.60±0.69bA | 4.50±0.84bA | 4.20±0.91bA | 4.80±0.63aA |
| 10 | 4.55±0.52aA | 4.00±0.86aA | 4.00±0.70aA | 3.88±0.74aB | |
| 20 | 3.37±0.51aB | 2.75±0.46aB | 2.37±0.51aB | 2.87±0.64aC | |
| 30 | 2.83±0.40aC | 2.33±0.51aB | 2.66±0.51aB | 2.33±0.51aC | |
| Texture | 1 | 4.40±0.84bA | 4.30±0.67bA | 4.10±0.56bA | 4.30±0.48bA |
| 10 | 3.88±0.78aB | 3.22±0.83abB | 3.11±1.16bB | 2.88±0.92cB | |
| 20 | 2.50±0.53aC | 2.12±0.35bC | 2.12±0.35bC | 2.00±0.88bcC | |
| 30 | 2.33±0.51bC | 2.16±0.40bC | 2.50±0.54aBD | 2.00±0.96bC |
Table text extracted from the original PDF; superscript letters are shown inline. The original table image is below.
View original table image
| Fish patty | Time (days) | Control (without FPC) | 5% FPC | 10% FPC | 20% FPC |
|---|---|---|---|---|---|
| pH | 1 | 6.08±0.02bA | 6.10±0.02aA | 6.10±0.02aA | 6.10±0.11aA |
| 10 | 6.07±0.01aA | 6.02±0.01aB | 5.93±0.03aB | 5.85±0.02bB | |
| 20 | 5.91±0.02aB | 5.84±0.04aC | 5.76±0.03bC | 5.71±0.02bC | |
| 30 | 5.81±0.02aC | 5.73±0.02aD | 5.65±0.02bD | 5.51±0.02cD | |
| TVB-N (mg N/100g) | 1 | 7.00±0.97bC | 8.40±0.88bD | 9.80±0.85bC | 11.20±0.98aC |
| 10 | 9.10±0.98bC | 11.90±0.98aC | 15.40±0.76aB | 17.50±0.98aB | |
| 20 | 16.10±0.98cB | 19.60±0.98bcB | 21.70±0.98abA | 23.80±0.88aA | |
| 30 | 21.00±0.86bA | 23.10±0.98abA | 23.80±0.89aA | 25.90±0.98aA | |
| PV (meq /kg) | 1 | 0.00±0.00aD | 0.00±0.00aD | 0.00±0.00aD | 0.00±0.00aD |
| 10 | 0.70±0.03cC | 0.96±0.01bC | 1.05±0.02aC | 1.13±0.02aC | |
| 20 | 2.37±0.04cB | 2.89±0.04bcB | 3.14±0.06abB | 3.34±0.02aB | |
| 30 | 4.19±0.007bA | 4.35±0.02bA | 5.24±0.02aA | 5.44±0.04aA |
Table text extracted from the original PDF; superscript letters are shown inline. The original table image is below.
View original table image
| Fish patty | Time (days) | Control (without FPC) | 5% FPC | 10% FPC | 20% FPC |
|---|---|---|---|---|---|
| Protein (%) | 1 | 5.65±0.04dA | 11.78±0.03cA | 16.44±0.02bA | 21.10±0.04aA |
| 10 | 5.56±0.04dA | 11.21±0.02cA | 16.15±0.02bA | 20.93±0.03aA | |
| 20 | 5.24±0.04dA | 10.90±0.04cA | 15.63±0.05bA | 19.79±0.04aA | |
| 30 | 4.78±0.03dA | 10.14±0.04cA | 14.69±0.04bA | 17.84±0.03aA | |
| Fat (%) | 1 | 19.39±0.02aB | 19.45±0.007aB | 19.48±0.01aB | 19.51±0.02aB |
| 10 | 19.58±0.03bB | 19.70±0.04bB | 19.88±0.01bB | 20.04±0.09bB | |
| 20 | 22.39±0.02cA | 23.18±0.01cA | 23.29±0.02cA | 23.49±0.02cA | |
| 30 | 23.12±0.02dA | 23.39±0.03dA | 23.55±0.02dA | 23.67±0.05dA | |
| Moisture (%) | 1 | 21.01±0.08dA | 21.17±0.07dA | 21.56±0.19dA | 21.88±0.07dA |
| 10 | 20.39±0.02cA | 20.71±0.09cA | 21.06±0.09cA | 21.29±0.02cA | |
| 20 | 19.60±0.09bAB | 19.72±0.02bAB | 19.79±0.02bAB | 19.86±0.02bAB | |
| 30 | 17.58±0.02aB | 17.85±0.02aB | 17.91±0.01aB | 18.11±0.02aB | |
| Ash (%) | 1 | 0.99±0.12aB | 0.99±0.11aB | 0.99±0.03aB | 0.99±0.04aB |
| 10 | 0.99±0.007bB | 1.06±0.01aAB | 1.12±0.01aA | 1.18±0.007aA | |
| 20 | 1.04±0.01cA | 1.10±0.007bA | 1.17±0.02abA | 1.20±0.007aA | |
| 30 | 1.13±0.04cA | 1.19±0.007bA | 1.25±0.02abA | 1.32±0.01aA |
Table text extracted from the original PDF; superscript letters are shown inline. The original table image is below.
View original table image
| Test (%) | Protein | Fat | Ash | Moisture |
|---|---|---|---|---|
| Minced bream fish | 20.11±0.02b | 7.00±0.14a | 0.99±0.01a | 72.30 ±0.47a |
| FPC | 91.63±0.09a | 0.57±0.02b | 0.26 ±0.01b | 6.12±0.03b |
Table text extracted from the original PDF; superscript letters are shown inline. The original table image is below.
View original table image
Discussion
The amount of protein in the muscle of fish is reported to be about 21 to 16% [20] . But research on various aspects of the production of FPC from the different fish expecially bream fish, and its use in human diet as a valuable protein supplement plays an important role in providing nutritional needs and eliminating protein deficiencies in the community. Dust et al. [21] considered FPC as a very valuable protein source, and noted that its absorption rate was more than 8.2%. The Food and Drug Administration of the United States (FDA) also controlled use of FPC as a protein supplement in the human diet has been approved, while that the FPC is used in terms of factors such as protein content (more than 75%), fat (Maximum of 0.75%), moisture, microbial, etc. are in good condition [4,22] . In the present study, protein concentrate produced from bream fish with a protein content of 91.63%, is FPC type A, which complies with FDA and FAO rules. In another study by Khoshkhoo et al. [23] on the production of FPC from kilka fish (Clupeonella cultriventris), the protein content was reported about 0.92%. Differences in the concentrations of proteins and other chemical and physical factors may depend on the season, the species used, the production method, and other parameters [24,25] . Mohamed et al. [26] reported that FPC produced from carp and shark fish contained 88.70% and 89.12% of protein, respectively. Azhdari [24] also reported the FPC from silver carp was 81% and Dan Syahurul, [27] and Dewita et al. [28] reported the amount of FPC from catfish was 75.31%. Also, the amount of protein in FPC derived from bream fish in this study was more than the protein content derived from FPC of other fish such as common carp (72%), menhaden (78%) and hake (85%) [29,30,31] . This can be due to the non-use of preextraction cooking method, because heat reduces the amount of protein in the product, changing the structure and reducing access to essencial amino acids. For example, the reduction of access to amino acids of cysteine, lysine, arginine, threonine and serine in various protein sources has been reported as a result of thermal treatments [32] . It should be noted that amino acids, such as lysine, at high temperatures produce form complexes with carbohydrates such as glucose, which cause the reaction of Millard [33] . Therefore, high temperatures can reduce the quality of food and the amount of proteins [34] . On the other hand, the results of fish patty maintance with 5%, 10%, and 20% of FPC during one month showed that at the beginning of the maintenance period, the protein content was respectively 11.78%, 16.44% and 21.10%. It was more than the amount of protein in the control fish patty (5.65%). Their amount at the end of the maintenance period was 10/14, 14/69 and 17/84 percent, respectively. This decrease is due to the denaturation of the protein during storage. Nagaral et al. [35] reported that the protein content of fish patty from Catla catla was significantly reduced during the 16 days of storage at the refrigerator temperature, which is consistent with the results of the present study. A study by Bavitha et al. [36] also found that the protein content of fish cake from Cyprinus carpio was significantly reduced during the 15 days of storage (P <0.05), so that in The end of the maintenance period reached the protein content of 4.92%. Total fat is a qualitative indicator of fish corruption [37] . The results of fat content of protein concentrate obtained from bream fish was 58%. The reason for this compared with minced meat of bream fish, the effect of solvent during the process of preparation of FPC. In a study by Mohamed et al. [26] , the fat content of FPC produced from carp and shark fish contained 0.04 and 0.01%, respectively. With a study on extraction of FPC from phytophagus fish, Azhdari [24] reported fat content of 0.37%, which was less than the amount of fat obtained from the results of this study. But the results of FPC fat content from catfish [10,28] and common carp [30] were more than the results of this study. The difference in fat content can be due to the type of solvent used or its purity. On the other hand, the fat content of fish varies as well. To prove this, studies by Cordova [31] on the effects of various solvents such as isopropanol, hexane, ether, benzene, toluene, cyclohexane, carbon tetrachloride and ethanol on the extraction of fat and water from fish for the production of FPC showed that isopropenol is more suitable solvent. And while extracting fats, the flavor, smell and coloring material also well separates from the fish tissue and is safer than other solvents such as hexane and toluene. Regarding the measurement of fat during storage, the lowest amount of fat on the first day was observed in the control treatment with 19.39% and the highest on day 30 in fish patty enriched with 20% FPC. The reason for the high fat in
International Journal of Advanced Biochemistry Research the fish patty was the use of vegetable oil in the formulation of the patty. Romero et al. [38] also reported that, among different treatments of fish patty from Pseudoplatystoma corruscans, the highest fat content was found in fish patty treated with 20.28 of corn flour and the lowest was 10.55% in control treatment. Moisture is an important factor in determining the quality and shelf-life of foodstuffs [39] . The difference in moisture content can also be due to the effect of solvent and the use of a dryer during the process as well as the difference in the duration of use of the dryer. FAO (The Food and Agriculture Organization of the United Nations) has set 8% the maximum acceptable moisture content of FPC type A [4] . Khoshkhoo et al. [23] with producing FPC from kilka fish reported the moisture content of 3.2%, and Mohamed et al. [26] with producing FPC of carp and shark reported the moisture contents of 9.10 and 8.55%, respectively. Also, in the present study, by measuring the moisture content of fish patty containing FPC during 30 days of storage at ambient temperature, observed that moisture changes were not significant between control sample and treatments containing FPC in different days, but the moisture content of the samples was significant from 0 to 30 days of storage. Bello and Pigott [40] reported that the moisture content of patty produced from various fish such as rockfish, pacific cod, codling and pacific herring was 3.4% on zero day and 8.3% in the fourth month, which this increase in moisture was due to increased moisture absorption from the environment. Sehgal et al. [41] reported the moisture content of fish patty produced by the Indian carp (Labeo rohita) about 52%. Romero et al. [38] reported the moisture content of fish patty from Pseudoplatystoma corruscans containing rice flour was about 67.95% that there was a significant difference between different treatments except control treatment and fish patty containing Amaranth flour. The amount of ash of FPC in accordance with FAO standards is 18% [4] , which is much higher than the amount of protein derived from bream FPC. During the storage period, the ash content of all treatments increased as compared to control treatment, so that at the end of the maintenance period, the highest amount of ash was associated with the fish patty enriched with 20% FPC. These results were not consistent with the study of Romero et al. [38] on the amount of ash from fish patty containing corn flour compared to control treatment. Regarding the factors of corruption, the decrease in pH of treatments and the absence of increase during the maintenance period at ambient temperature could be due to the proper packaging, the lower release of volatile compounds and the absence of microbial growth due to the dry matter of the foodstuff. But Turhan et al. [42] reported that after 10 days of storage, the pH of fish patty from anchovy increased from 6.33 to 6.56. Because the growth of microorganisms and enzymes produced by them, by liberating oxygen and hydrogen, increased the concentration of hydroxyl ions and cause the increase in pH. Also, the results of this study did not match the results of Desturan and Haard [43] , Yerlikaya et al. [44] and Kilinc et al. [45] ; but was consistent with the results of Raut et al. [46] Ilhak et al. [47] also found that there was no significant increase in the pH of different treatments from fish patty during the whole period of storage. The TVB-N factor is one of the indicators widely used to assess the quality of fish and fish products, which includes measurement of trimethylamine, dimethylamine, ammonia and other volatile nitrogen compounds associated with food corruption [20] . In the present study, the number of total volatile base nitrogen from fish patty in all treatments increased at the end of the maintenance period. The increase in the amount of TVB-N can be attributed to the decomposition of nitrogen compounds, such as proteins and free amino acids [48] . The results of this study were complied with Yerlikaya et al. [44] studies patty produced from Anchovy (Engraulis encrasicholus), Kilinc et al. [45] studies on the patty produced from Sardina pilchardus, Kaba et al. [49] studies on the patty produced from Engraulis engrasicholus and Guran et al. [50] studies on the patty produced from Bonito fish (Sarda sarda). The legal limit for this index is 35 mg N per 100 g sample during the maintenance period [45] . Peroxide is used as the primary product of fat oxidation in fish [51] . Corrupt products are rapidly degraded and aldehydes are formed. These compounds have a severe and unpleasant odor and smell, which can lead to consumer hazards [52] . The results of this study showed that the amount of peroxide in all treatments increased significantly during the maintenance period except on the first day compared to the control treatment. This increase was due to the decomposition of fatty acids and the breakdown of triglycerides and free radicals. However, Yerlikaya et al. [44] studies on the proxide value of fish patty from Engraulis encrasicholus during the six days of storage reported that the amount of peroxide increased until the fifth day of storage, and then decreased, and the reduction of peroxide value at the end of the maintenance period can be attributed to the degradation of hydroperoxide to secondary oxidation products. The results of this study were consistent with the results of Guran et al. [50] and Bou et al. [53] . In terms of sensory evaluation, the odor quality, taste, color and texture of the product will change during the maintenance period and will lead to consumer dissatisfaction [54] . The present study showed that flavor loss was observed in each treatment during storage, but no significant difference was observed between treatments. Rockower et al. [55] investigated the taste of the patty produced from trout and pollack protein concentrate, and found that the best taste was found in the patties containing the protein concentrates of the both fishes. Sehgal et al. [14] also examined the flavor of fish patty produced from common carp (Cyprinus carpio) and reported that there was no significant difference in their flavor compared to the control sample. Also, the results of tissue measurements showed that with increasing time, the quality of the tissue was reduced and the highest tissue score at the end of the maintenance period belonged to 10% FPC-enriched patty and then the control treatment. Zhu et al. [56] observed that with increasing storage period, the texture hardness and chewing ability of fish patty increased and its springiness ability decreased. Therefore, the results of the evaluation of sensory indices during the maintenance period showed that although at the beginning of the experiment, the taste was desirable, the texture was flexible and the color was acceptable, but lipid oxidative degradation, microbial activity, the presence of free fatty acids [57] , the formation of high molecular weight compounds such as phospholipids and triglycerides [58] , the increase of peroxide value, PUFA reduction and protein degradation [59] resulted in loss of flavor, odor, texture and color of the product [60] .
Conclusion
The results of dietary value tests (protein, fat, moisture and
International Journal of Advanced Biochemistry Research ash), and evaluation of corruption factors (pH, peroxide value and total volatile base nitrogen) during 30 days of storage at ambient temperature showed that protein was the most important indicator in fish patty enriched with FPC, but there was no significant difference in the factors of corruption between control sample and other treatments (5% and 10% FPC-enriched patties), especially with 5% FPC treatment. However, in the duration of storage, fish patty enriched with 20% FPC had a lower shelf life. So, 5% and 10% treatments were considered as treatments with superior formulation and equal treatment with control. But due to the economic cost, 5% FPC treatment was proposed for final production.
References
60 in the original paper- Azhdari A. A Study of fish ice-cream formulation by use of silver carp proteins instead of milk proteins. Ph. D. thesis, 2007, 76.
- Sedghpour S. Global gensus of fisheries and aquaculture. Office of Planning and Budget of Iran Fisheries Organization, 2014.
- The Fisheries Statistics of Iran. Iranian Fisheries Statistics 1996-2010. Office of Planning and Budget, 2014.
- Food and Agriculture Organization (FAO). Fish Protein Concentrate, fish flour, fish hydrolyzate. Animal Feed resource information system, 2006.
- Vosoghi GH, Mostajir B. Freshwater fish. Publications Tehran University, 2000, 332.
- Leeson S, Summers JD. Commercial Poultry Nutrition. 3rd Ed. Publ. University Books, Guelph, Ontario Canada, 2005.
- Stilling BR. Fish Protein Concentrate: A new source of dietary protein. Journal of American Oil and Chemistry. 1971; 48:55-59.
- Parr LA, Dove T, Hopkins WD. Why faces may be special: evidence for the inversion effect in chimpanzees (Pan Troglodytes). Journal of Cognitive Neuroscience. 1998; 10:615-622.
- Kochakian Sabour A, Yasami M. Technology of Fishery Products. Higher Education Institute of Applied Science and Technology of Jahad Agricultural, 2010.
- Syahrul DD. Quality Assessment of Fish Protein Concentrate from catfish (Pangasius hypopthalmus) During Storage at Room Temperature. IOSR Journal of Environmental Science, Toxicology and Food Technology. 2015; 9(9):20-23.
- Kvitka EF, Chen TS. Fish protein concentrate as a protein supplement in four baked products. Family and Consumer Sciences Research Journal. 1982; 11:159165.
- Windsor ML. Fish protein concentrate. (FAO in partnership with Support unit for International Fisheries and Aquatic Research, SIFAR, 2001). Torry Research Station, Torry Advisory Note No. 39, 2001.
- Park Surimi JW, Surimi Seafood. (3 th edition), CRC Press, Taylor and Francis Group. London. New York. 2013; 12:666.
- Sehgal H, Shahi M, Sehgal GK, Thind SS. Nutritional, microbial and organoleptic qualities of fish patties prepared from carp (Cyprinus carpio Linn.) of three weight groups. Food Science Technology Journal. 2010; 48:242-245.
- AOAC. Official methods of analysis (14 th edition), Association of Official Analytical Chemitis, Washington. D. C. USA, 2005.
- Iranian National Standard No. 1028. Determine the pH in meat and their products, 2007.
- Parvaneh V. Quality control and chemical analysis of food. Publisher: University of Tehran, 2007.
- Tokur B, Ozkutuk S, Atici E, Ozyurt G, Ozyurt CE. Chemical and sensory quality of fresh pomegranate fruits exposed to gamma radiation as quarantine treatment. Journal of Food Chemistry. 2006; 15:312318.
- ASTM. Manual on Sensory Testing Methods. American Society for Testing and Materials, 1916 Race Street, Philadelphia, 1969, 34-42.
- Huss HH. Quality and quality changes in fresh fish. In FAO fisheries Technical paper, No: 334; FAO: Roma, 1995.
- Dust JM, Grieshop CM, Parsons CM, Karr-Lilienthal LK, Schasteen CS, Quigley JD et al. Chemical composition, protein, quality, platability and digestibility of alternative protein source for dog. Journal of Animal Science. 2005; 83(10):2414-22.
- Food and Drug Administration (FDA). Food additives permitted for direct addition to food for human consumption. FDA, Department of Health and Human Services, 2001.
- Khoshkhoo Z, Motalebi AA, Khanipour AA, Karimi Firozjaee HA, Nazemi M, Mahdabi M. Study on Changes of Protein and Lipid of Fish Protein Concentrate (FPC) Produced form Kilkas in VP and MAP Packages at Light and Darkness condition During Six Months. International Journal of Environmental Science and Development. 2010; 1(1):101-106.
- Azhdari A. Production of fish protein concentrate (FPC) from silver carp (Hypophthalmichthys molitrix) by the extraction with Isopropyl alcohol solvent. Eighteenth National Congress of Food Science and Technology. Mashhad, 2008, 7.
- Beklevik G, Polat A, Ozogul F. Nutritional value of sea bass fillet during frozen storage. Veterinary and Animal Science, 2005, 891-895.
- Mohamed GF, Sulieman AM, Soliman NG, Bassiuny SS. Fortification of Biscuits with Fish Protein Concentrate. World Journal of Dairy and Food Sciences. 2014; 9(2):242-249.
- Syahrul DD. Quality Assessment of Fish Protein Concentrate from catfish (Pangasius hypopthalmus) During Storage at Room Temperature. IOSR Journal of Environmental Science, Toxicology and Food Technology. 2015; 9(9):20-23.
- Dewitaa Syahrula, Suparmia, Suardi Lukmana. Utilization of Fish Protein Concentrate from Patin Fish (Pangasius hypopthalmus) on street foods for Under Five Years Children at Kampar District, Riau Province. International Journal of Oceans and Oceanography. 2017; 11(1):75-88.
- Doraiswamy. Fish protein food in feeding trials wih school children. Indian Journal Pediant. 1963; 30:266.
- Gasiewicz TA, Dinan FJ. Concentration of mercury in manufacture of fish protein concentration by isopropyl alcohol of shepherd and carp. Journal of Environmental and Technology. 1972; 6(8):726-727.
- Cordova Murueta JH, Navarrete Del Toro ML, Garcia Carreno F. Concentrates of fish protein from bycatch species produced by various drying peocesses. Food Chemistry. 2007; 100:705-711.
- Drozdowski B, Ackman RG. Isopropyl alcohol extraction of oil and lipids in the production of fish protein concentrate from herring. Journal of American Oil Chemists Society. 1969; 46:371-376.
- Sohn M, Ho CT. Ammonia generation during thermal degradation of amino acids. Journal of Agricultural and Food Chemistry. 1995; 43(12):3001-3003.
- Tamanna N, Mahmood N. Food processing and maillard reaction products: effect on human health and nutrition. International Journal of Food Science. 2015, 1-6.
- Nagarale DG, Zanjad PN, Chappalwar AM, Londhe SV. Assessment of shelf life of fish patties during refrigerated storage. Journal of Veterinary Health Care. 2012; 10(1):35-39.
- Bavitha M, Dhanapal K, Madhavan N, Vidyasagar Reddy G, Sravani K. Quality changes in fish burger from common carp (Cyprinus carpio) during refrigerated storage. International. Journal of Science, Environment and Technology. 2016; 5(3):1646-1657.
- Coba OE. Evaluation of essential oils as a glazing material for frozen rainbow trout (Oncorhynchus mykiss) fillet. Journal of Food Processing and Preservation. 2013; 37:759-765.
- Romero MC, Ricardo A, Fogar RA, Rolhaiser F, Clavero VV, Ana M et al. Development of gluten-free fish (Pseudoplatystoma corruscans) patties by response surface methodology. Journal of Food Science and Technology. 2018; 55(5):1889-1902.
- Syad AN, Shunmugiah KP, Kasi PD. Seaweeds as nutritional supplements: Analysis of nutritional profile, physicochemical properties and proximate composition of G. acerosa and S. wightii. Biomedicine and Preventive Nutrition. 2013; 3:139-144.
- Bello A, Pigott GM. Dried fish patties: storage stability and economic considerations. Journal of Food Processing and Preservation. 1980; 4:247-260.
- Sehgal H, Shahi M, Sehgal GK, Thind SS. Some quality aspects of fish patties prepared from an Indian major carp, Labeo rohita (Ham.). International Journal of Food Sciences and Nutrition. 2008, 192-201.
- Turhan S, Evren M, Yazici F. Shelflife of refrigerated raw anchovy (Engraulis encrasicholus) patties. Journal of Fisheries and Aquatic Sciences. 2001; 18(3-4):391398.
- Destura FI, Haard NF. Development of Intermediate Moisture Fish Patties from Minced Rockfish Meat (Sebastes sp.). Journal of Aquatic Food Product Technology. 1999; 8(2):77-94.
- Yerlikaya P, Gokoglu N, Uran H. Quality changes of fish patties produced from anchovy during refrigerated storage. European Food Research Technology. 2005; 220:287-291.
- Kilinc B. Microbiological, sensory and color changes of anchovy (Engraulis encrasicholus) patties during refrigerated storage. Journal of Muscle Foods, 2007, 129-137.
- Raut KA, Raziuddin M, Zanjad PN. Effect of batter consistency as enrobing on quality of chicken patties. Tamil Nadu Veterinary and Animal Sciences University. 2011; 7(3):176-179.
- Ilhak OI, Guran HS. Combined antimicrobial effect of thymol and sodium lactate against listeria monocytogenes and salmonella typhimurium in fish patty. Journal of Food Safety. 2014; 34:211-217.
- Ocano-Higuera VM, Maeda-Martinez AN, MarquezRios E, Canizales-Rodriguez DF, Castillo-Yanez FJ, Ruiz-Bustes E et al. Freshness assessment of ray fish stored in ice by biochemical, chemical and physical methods Food Chemistry. 2011; 125:49-54.
- Kaba N, Yücel S, Corapci B, Ozer O, Eryasar K. Shelf Life of Anchovy (Engraulis engrasicholus, L. 1758) Patties Stored at 4°C. Akademik Gıda. 2012; 10(4):1923.
- Guran HS, Oksuztepe G, Coban OE, Incili GK. Influence of Different Essential Oils on Refrigerated Fish Patties Produced from Bonito Fish (Sarda sarda Bloch, 1793). Czech Journal of Food Sciences. 2015; 33(1):37-44.
- Perez-Villarreal B, Howgate P. Deteriration of European hake (Merluccius merluccios) during frozen storage. Journal of the Science of Food and Agricuture. 1991; 55:455-470.
- Egan H, Kirk RS, Sawyer R. Pearsons Chemical Analysis of Food. Longman Scientific and Technical, 1997, 609-634.
- Bou R, Claret A, Stamatakis A, Martínez B, Guerrero L. Quality changes and shelf-life extension of ready-toeat fish patties by adding encapsulated citric acid. Journal of the Science of Food and Agriculture. 2017; 97(15):5352-5360.
- Sakanaka S, Tachibana Y, Okada Y. Preparation and antioxidant properties of extracts of Japanese persimmon leaf tea (Kakinoha-cha). Food Chemistry. 2005; 89(4):569-575.
- Rockower RK, Deng JC, Otwell WS, Cornell JA. Effect of Soy Flour, Soy Protein Concentrate and Sodium Alginate on the Textural Attributes of Minced Fish Patties. Journal of Food Science. 1983; 48:1048-1052.
- Zhu Y, Mab L, Tianb Y, Yang H, Guob Y, Zhang K. Effects of high pressure processing on the quality of Vacuum Packed fish patties. Applied Mechanics and Materials, 2014, 4671-4676.
- Abedi E, Naseri M, Ghanbarian GA, Vazirzadeh A. Coverage of polyethylene film with essential oils of thyme (Thymus daenensis Celak) and savory (Satureja bachtiarica Bunge) for Lipid Oxidation Control in Rainbow Trout (Oncorhynchus mykiss) Fillets during Short-Term Storage in The Refrigerator. Journal of Food Processing and Preservation ISSN. 2016, 17454549.
- Rodriguez O, Barros-Velazquez J, Carmen P, Gallard JM, Aubourg SP. Effects of storage in slurry ice on the microbial, chemical and sensory quality and on the shelf life of farmed turbot (Psetta maxima). Food Chemistry. 2006; 95:270-278.
- Reddy GVS, Srikar LN. Effect of preprocess ice storage on the lipid changes of Japanese threadfin bream (Nemipterus japonicus) mince during frozen storage. Asian Fisheries Science. 1996; 9:109-114.
- Yu L, Haley S, Perret J, Harris M. Antioxidant properties of hard winter wheat extracts. Food Chemistry. 2002; 78:457-461.
Cited by 3
From OpenAlex, OpenCitations and reference lists read by Scinovex
- Fish Byproducts as a Protein Source: A Critical Review of Fish Protein Concentrate ↗
Geodriane Zatta Cassol, Jonatã Henrique Rezende-de-Souza, Luciana Kimie Savay‐da‐Silva · Food Reviews International · 2024
The byproducts generated during fish processing can represent up to 70% of the raw material entering the industry, and some of these byproducts are rich in high-quality proteins and other nutrients that could be used for human consumption. The products derived from these byproducts can be considered high-value-added products or coproducts, with the potential to create new ingredients and innovative…
❝ 12PDF - Value Addition in Meat and Fish Products for Human Health and Nutrition ↗
A. R. Sen, B. M. Naveena, Rituparna Banerjee, M. Muthukumar · Springer eBooks · 2022
❝ 5 - Physicochemical and Sensory Properties of Cake Enriched with Fish Protein Powder (FPP) and Transglutaminase Enzyme ↗
Sina Babakhani, Sima Moghaddaszadeh-Ahrabi, Mehdi Gharakhani · Food Science and Technology · 2019
Physicochemical and Sensory Properties of Cake Enriched with Fish Protein Powder (FPP) and Transglutaminase Enzyme
❝ 2PDF