
Research article · 2019 · Full text
International Journal of Statistics and Applied MathematicsSymmetric truth detection model: A randomized response approach
Volume 4(4) · Pages 50–55
Research areasSpam and Phishing DetectionSurvey Sampling and Estimation TechniquesHate Speech and Cyberbullying Detection
Abstract
Author-writtenWhen collecting sensitive information on abortion, drug addiction, examination dishonesty and tax evasion among others, many researchers use direct questioning which may not yield valid data. This is because respondents fear embarrassment and victimization. In this study we have formulated a Symmetric Truth Detection Model which uses two randomization devises to protect the privacy of respondents leading to a more honest response. This model is more efficient than the earlier models namely the Asymmetric Truth detection Models.
Summary
Source-checkedPlain-language reading of the full paper, prepared with AI and checked against the text. Each point links to the authors' own words.
Why it matters
- Direct questioning for sensitive topics like drug addiction or tax evasion often produces invalid data because respondents fear victimization or embarrassment. View evidence ↗
- Research findings on sensitive attributes are frequently distorted by non-sampling errors, specifically respondent refusal or the provision of incorrect information. View evidence ↗
- Existing randomized response models typically use only one randomization device, which often results in high non-response rates and large variances. View evidence ↗
The question
- The study aims to formulate a Symmetric Truth Detection Model (TDM) that uses two randomization devices to estimate the proportion of a sensitive attribute. View evidence ↗
What they did
- The proposed Symmetric TDM employs two randomization devices (D1 and D2) to enhance respondent privacy and reduce variance. View evidence ↗
- The model uses simple random sampling with replacement to estimate the population proportion (α) of individuals with the sensitive attribute. View evidence ↗
- Data simulation was used to compare the variance and relative efficiency of the Symmetric TDM against the Asymmetric TDM. View evidence ↗
- The simulation comparison was conducted using parameters: sample size n=10, p=0.3, p1=0.1, α=0.7, and b=2. View evidence ↗
What they found
- The Symmetric TDM demonstrated lower variance than the Asymmetric TDM, making it more efficient as indicated by a relative efficiency (RE) greater than 1. View evidence ↗
- With a=3 and b=2, the Symmetric TDM variance was 0.05381 compared to 0.1523 for the Asymmetric TDM, resulting in a relative efficiency of 2.83. View evidence ↗
- When the difference between a and b increased (a=8, b=2), the Symmetric TDM variance decreased to 0.0218, increasing the relative efficiency to 6.99. View evidence ↗
- The efficiency of the Symmetric TDM increases as the difference between parameters a and b increases, which reduces the model's variance. View evidence ↗
What it means
- The authors conclude that the Symmetric TDM is more efficient for collecting sensitive information due to its lower variance compared to the Asymmetric TDM. View evidence ↗
Visual summary
1 visualsIllustrations explain the paper; they do not show study data.
Symmetric TDM Conceptual Flow
AI-generated conceptual illustration (Two mechanical randomization devices (dice) and a set of printed statement cards). It explains the idea and does not show study data.
View source evidence ↗Figures & tables
From the original paper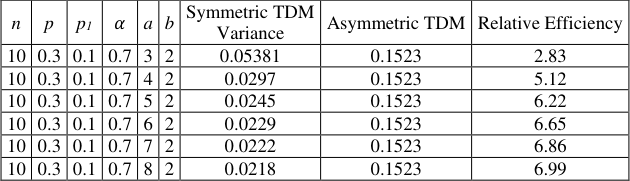 Table 1
Introduction
Self-report is one of the most frequently used data collection techniques in research. However, people do not always tell the truth when being asked to answer sensitive questions (Martin, et.al. 2009) [1] . In collecting sensitive information, two non sampling errors which frequently distort the research findings involve some respondents refusing to answer some questions or deliberately providing incorrect information. Such distortions may result when the respondent is afraid of losing prestige or of becoming embarrassed by offering truthful responses to sensitive questions. The bias produced is sometimes large enough to make the sample estimates seriously misleading. Although topics on personal opinions, controversial issues and intimate behavior are frequently relevant in research, it is very difficult to explore them accurately using traditional survey research methods. Warner (1965) [2] developed an interviewing procedure designed to reduce errors caused by non-response and untruthful answers when collecting data on sensitive attributes. This technique is called the randomized response technique. This is because the respondent answers one of several questions selected at random and the interviewer is given an answer but is unaware of the question which is being answered by the respondent. A lot of improvement has been done on Warner model. Mangat (1994) [3] proposed a technique in which some basic demographic questions together with questions unrelated to the current study and the sensitive question are included in the questionnaire aimed at increasing the privacy of the respondents. Eichhorn and Hayre (2003) [4] extended the model developed by Mangat (1994) [3] by developing survey models which allowed responses with a coded value composed of their true value for the variable of interest, multiplied by some random number. In this model, the interviewer does not know which random number was used by each of the interviewees for coding their responses, but fully knows the underlying distribution which generated the random coding number. Zawar et.al. (2010) [5] developed a Bayesian estimation method for population proportions of a sensitive characteristics which adopts a simple Beta distribution as a quantification of prior information using simple random sampling with replacement. Bo Yu, et al. (2015) [6] developed a model which considers the estimation of binomial proportions of sensitive attributes in the population of interest in successive sampling on two occasions. In addition, the model was formulated by using rotational cluster sampling when the target population is geographically diverse. All the models discussed above used one randomization devise and were characterized by large variances and a high level of non response. However no effort has been made to estimate the proportion of sensitive attribute using two randomization devises. This led to the formulation of symmetric TDM which uses two randomization devises to estimate the stigmatizing attribute.
Literature Review
Literature Review
Data and Methodology
To estimate the variance of the sensitive attribute, data simulation was used on both the Asymmetric and Symmetric TDM and relative efficiency was computed to ascertain the model which has the lowest variance.
Asymmetric Truth Detection Models
The Asymmetric TDMs are formulated by use of one randomization devise to collect sensitive attribute (Bo Yu, 2015) [6] . In these models, a single randomization devise such as a coin, a card, a spinner or any other devise is used and a "no" response identifies an interviewee as not holding the sensitive characteristic. In these models, depending on the outcome of the randomization process, respondents are either asked to provide the specified answers "yes" with probability p or "no" with probability 1-p. In Asymmetric models, with population categories A and A c a box with two types of cards labeled A and A c (in proportion p:1-p ) is used as the randomization device. A respondent draws a card at random and uses it to select one of the two statements given below; (i) I belong to group A (ii) I do not belong to group A Where group A represents those who have the sensitive attribute. The respondents then have the option of responding 'yes' or 'no' according to whether or not they belong to the group of sensitive attribute. The Asymmetric model is formulated using the following notations; Let λ be the observed proportion of ''yes" answers in the sample, p be the probability that arespondent is directed to answer the sensitive question and 1-p be the probability that he or she is instructed to answer the non sensitive question. Let α be the probability of the existence of the sensitive attribute and 1-α be the probability of non existence of the sensitive attribute.
Proposition 2.1
The estimator for the sensitive attribute α for the asymmetric TDM is estimated as;
Proof Proposition 2.1 can be proofed using the probability tree diagram below; True In the tree diagram above, p is the probability that a respondent is directed to answer the sensitive question and 1-p is the probability that he or she is instructed to answer the non sensitive question. From elementary probability theory, the total proportion of "yes" answers irrespective of the question of affirmative response can be expressed in the following way; P (True response) = P(the first question)P(presence of the sensitive attribute) + P(the second question)P(absence of the sensitive attribute). This can be expressed as below;
Which can be expanded as; λ = α (2p -1) + 1-p.
The proportion of sensitive attribute α is thus estimated as
Swhere λ ̂ is an unbiased estimator for the total proportion of "yes" responses λ This completes the proof.
Proposition 2.2
The variance of 𝛼 ̂ for asymmetric TDM is ;
Proof
Using equation ( 4) above;
But, the variance of a constant = 0 therefore,
Equation (6) therefore simplifies to;
), which is equivalent to;
Equation ( 7) can be expanded to;
Symmetric Truth Detection Model
In this paper we have developed a new model which we have called Symmetric TDM. The Symmetric TDM was developed to overcome the problems associated with the Asymmetric truth detection model developed by Warner (1965) [2] and improved by BoYu, et.al (1015) [6] . These problems are; 1. Low privacy level 2. Large variance leading to invalid data.
Non response.
This model uses two randomization devises namely; D1 and D2 thus improving the privacy level as well as reducing variance and non response. Simple random sampling with replacement was used to select a sample of size n to estimate the proportion (α) of individuals who possess the sensitive attribute. Let a and b be any two positive real number, q be the probability of using the first randomization devise D1 and 1-qbe the probability of using the second randomization devise such that; In the first randomization device D1 the selection of statement (i) or (ii) is done with probabilities p1 and 1-p1 respectively. In the second randomization device D2 the selection is done with probabilities p2 and 1-p2 for statements (i) and (ii) respectively. The probability of "yes" response (λ) is given by;
The unbiased estimator of α is given by;
Proof
Using equation (8), the proportion of "yes" responses is given by: λ =
After simplification, equation (10) reduces to;
The unbiased estimator of α is thus given by;
where λ ̂ is the unbiased estimator for λ. This completes the proof.
Theorem 3.2
The variance of λ ̂ is given by; ).
But the variance of a constant is 0, therefore;
Equation ( 14) therefore reduces to;
Substituting equation ( 17) in equation ( 16), we get;
Results and Discussion
The relative efficiency (RE) of the Symmetric TDM with respect to Asymmetric TDM is obtained by dividing the variance for Asymmetric TDM by the variance of Symmetric TDM after obtaining data using simulation method. The proposed model (Symmetric TDM) will be more efficient than Asymmetric TDM if; RE= variance for Asymmetric TDM variance for symmetric TDM > 1
This was shown in Table 1 below.
| n | p | p1 | 𝛼 | a | b | Symmetric TDM Variance | Asymmetric TDM | Relative Efficiency |
|---|---|---|---|---|---|---|---|---|
| 10 | 0.3 | 0.1 | 0.7 | 3 | 2 | 0.05381 | 0.1523 | 2.83 |
| 10 | 0.3 | 0.1 | 0.7 | 4 | 2 | 0.0297 | 0.1523 | 5.12 |
| 10 | 0.3 | 0.1 | 0.7 | 5 | 2 | 0.0245 | 0.1523 | 6.22 |
| 10 | 0.3 | 0.1 | 0.7 | 6 | 2 | 0.0229 | 0.1523 | 6.65 |
| 10 | 0.3 | 0.1 | 0.7 | 7 | 2 | 0.0222 | 0.1523 | 6.86 |
| 10 | 0.3 | 0.1 | 0.7 | 8 | 2 | 0.0218 | 0.1523 | 6.99 |
Table text extracted from the original PDF; superscript letters are shown inline. The original table image is below.
View original table image
We have done the comparison of the variance of the Asymmetric TDM and Symmetric TDM by setting n=10, p=0.3, p1 = 0.1,α = 0.7, b = 2, ab > 0 and 𝑎 ≠b. Using these parameters, we have calculated the relative efficiency of Symmetric TDM with respect to Asymmetric TDM and presented the results in Table 1 below. The results in Table 1 shows that, the Symmetric Truth Detection Model has a less variance compared to Asymmetric TDM and therefore more efficient than the Asymmetric Truth Detection Model since the RE > 1. It can be observed that efficiency increases with increase in the difference between a and b. This is because a bigger difference would increase the denominator thus decreasing the variance of Symmetric TDM and consequently increasing the efficiency.
Conclusion
Based on the results in table 1, the Symmetric Truth Detection Model has less variance than the Asymmetric Truth Detection Model and therefore more efficient for collecting data on sensitive information.
References
6 in the original paper- Martin O et al. Assessing Sensitive Attributes Using the Randomized Response Technique: Evidence for the Importance of Response Symmetry Journal of Educational and Behavioral Statistics. Journal of Educational and Behavioral Statistics. 2009; 34(2):267-287.
- Warner SL. Randomized response: A Survey Technique for Eliminating Evasive Answer Bias, Journal of the American Statistical Association. 1965; 60:63-69.
- Mangat NS, Singh R. An alternative randomized response procedure. Biometrika. 1994; 77:439-442.
- Eichhorn BH, Hayre LS. Scrambled Randomized Response Methods for Obtaining Sensitive Quantitative Data. J of Statistical planning and Inference. 2003; 7:307-316.
- Zawar Hussain, Javid Shabbir, Muhammad Riaz. Bayesian Estimation Using Warner's Randomized Response Model through Simple and Mixture Prior Distributions, Communications in Statistics-Simulation and Computation®. 2010; 40(1):147-164.
- Bo Yu, Zongda J, Jiayong T, Ge G. Estimation of sensitive information by randomized response data in successive sampling. 2015; 4(13):29-42.
Cited by 1
From OpenAlex, OpenCitations and reference lists read by Scinovex
- Influence of Molding Numbers on Developing Mathematical Competence Among Pre-School Learners in Mutha Zone, Kitui County, Kenya ↗
William Kimanzi, Jonathan Muema Mwania, R.N. Mwanza · 2022
The purpose of this study was to investigate the influence of molding numbers on developing mathematical competence among pre-school learners. The study was guided by the following objectives: to establish the influence of type of numbers modeled on developing mathematical competence among pre-school learners and to determine the influence of materials used on modeling numbers on developing mathematical competence among…
❝ 0PDF