
Research article · 2019 · Full text
International Journal of Statistics and Applied MathematicsA study on India’s selected demography factors: 2021 projection
Volume 4(4) · Pages 18–23
Research areasInsurance, Mortality, Demography, Risk ManagementGlobal Health Care Issues
Abstract
Author-writtenThis paper is about the projection of India’s population for the year 2021 and predicts the states with high population, female fertility ratio, life expectancy of male and female and mortality which will help the society, planning commission, political system, Economic planning etc. to yield a realistic picture of the probable future development of a population.
Summary
Source-checkedPlain-language reading of the full paper, prepared with AI and checked against the text. Each point links to the authors' own words.
Why it matters
- Demography is the scientific study of human populations, focusing on their size, structure, and development. View evidence ↗
- Predicting demographic factors like population size, fertility, life expectancy, and mortality helps society, political systems, and planning commissions create realistic future development plans. View evidence ↗
The question
- The study aims to determine the census population projection for India in the year 2021. View evidence ↗
- The study aims to estimate the projected female fertility rate for 2021. View evidence ↗
- The study aims to find the projected life expectancy for 2021. View evidence ↗
- The study aims to determine the projected mortality rate for 2021. View evidence ↗
What they did
- Data was collected from the Office of the Registrar General of India, Ministry of Home Affairs, covering census years from 1951 to 2011. View evidence ↗
- The researchers calculated projections for state populations, female fertility ratios, male and female life expectancy, and mortality ratios for 2021. View evidence ↗
What they found
- In the 2021 population projections, Uttar Pradesh had the highest projected population (210,784 units), while Lakshadweep had the lowest (74 units). View evidence ↗
- For the year 2021, Meghalaya was projected to have the highest female fertility ratio (39), while Tripura was projected to have the lowest (11.12). View evidence ↗
- Among selected states, Jammu and Kashmir was projected to have the highest life expectancy for both males and females in 2021 (projected female expectancy of 81.78). View evidence ↗
- Uttar Pradesh was projected to have the lowest life expectancy among the selected states for 2021 (projected female expectancy of 71.62). View evidence ↗
- Delhi was projected to have the highest mortality ratio in 2021, with a value of 25.64. View evidence ↗
- Nagaland was projected to have the lowest mortality ratio in 2021, with a value of 1.96. View evidence ↗
What it means
- The authors state that the time period available was insufficient to conduct an in-depth study of the projected population. View evidence ↗
- Due to the project's duration and nature, only a few selective models were applied. View evidence ↗
Visual summary
1 visualsIllustrations explain the paper; charts are replotted from the paper's own table values.
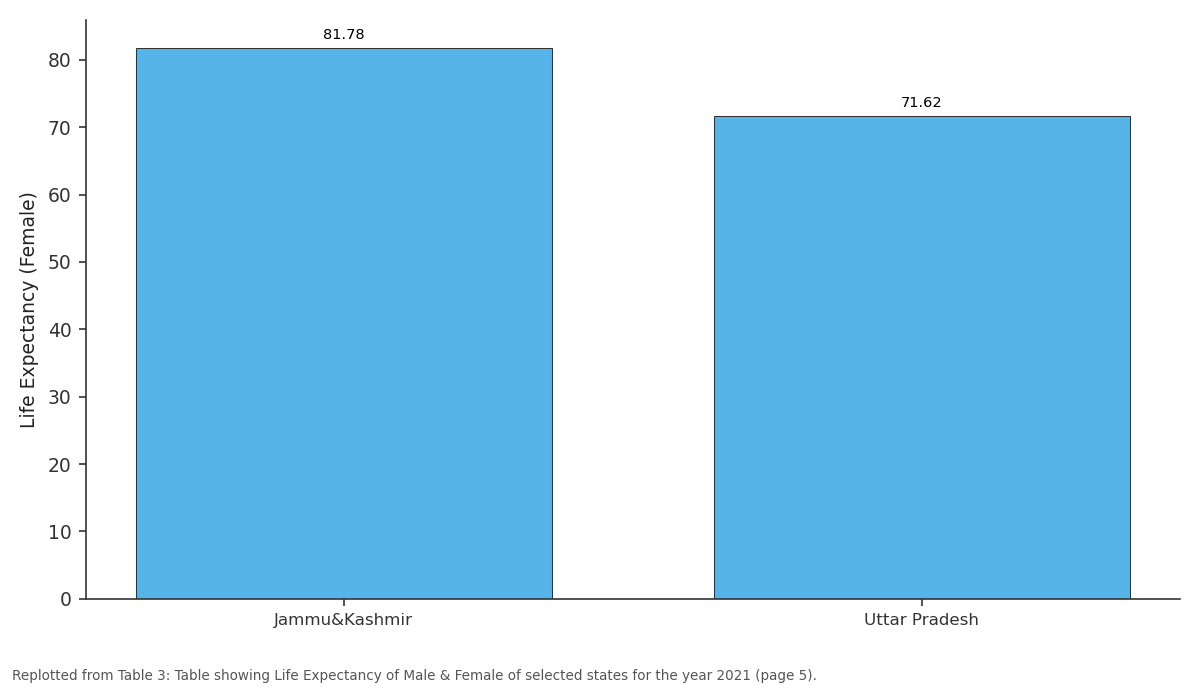
Female: Jammu&Kashmir vs Uttar Pradesh
Replotted from Table 3 (page 5) of the original paper. Every bar is the paper's own table value.
View source evidence ↗Figures & tables
From the original paper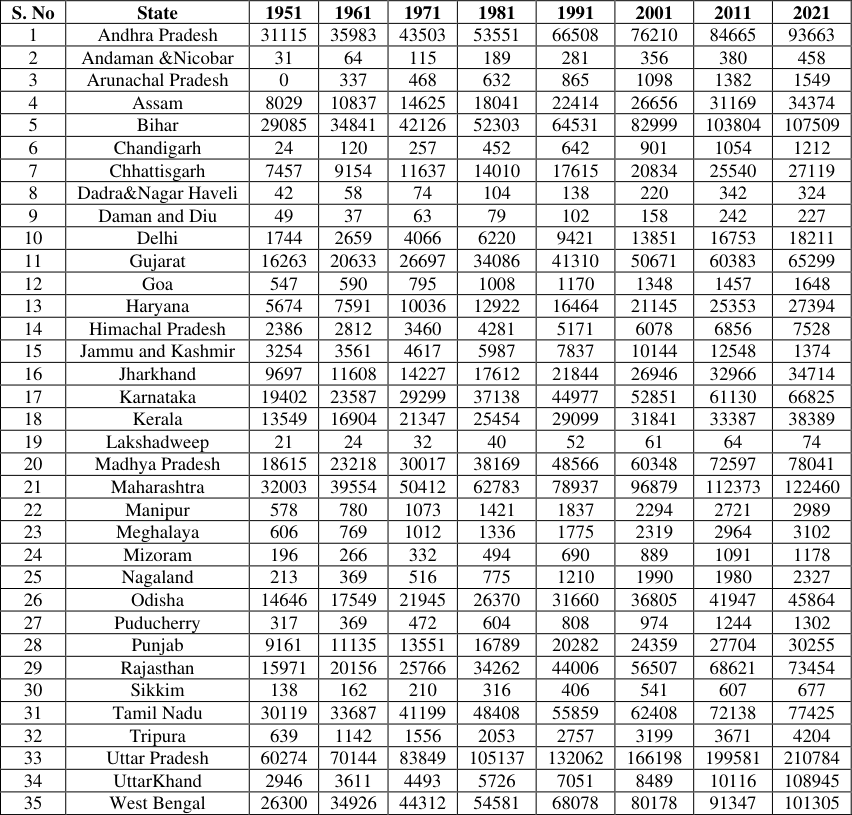 Table 1
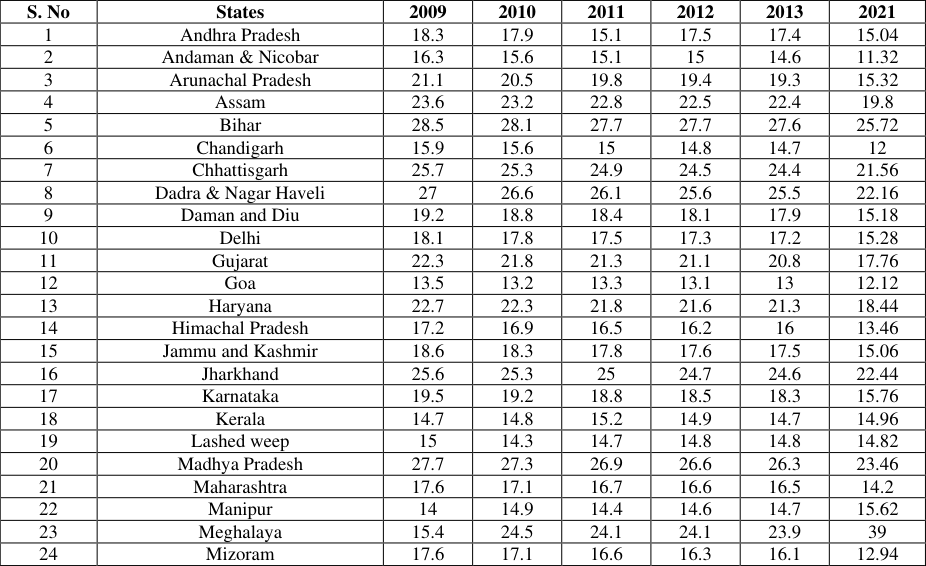 Table 2
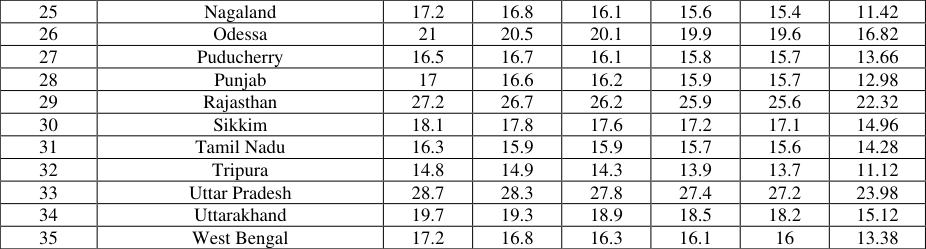 Table 3
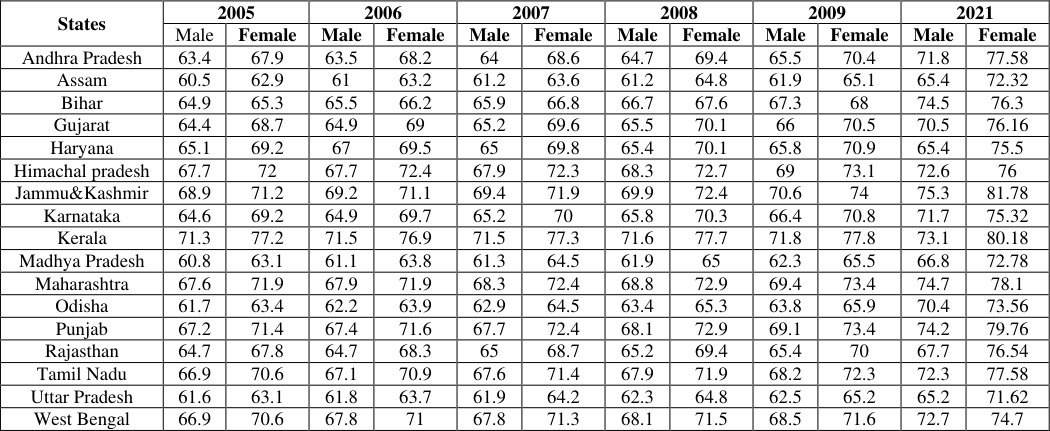 Table 3
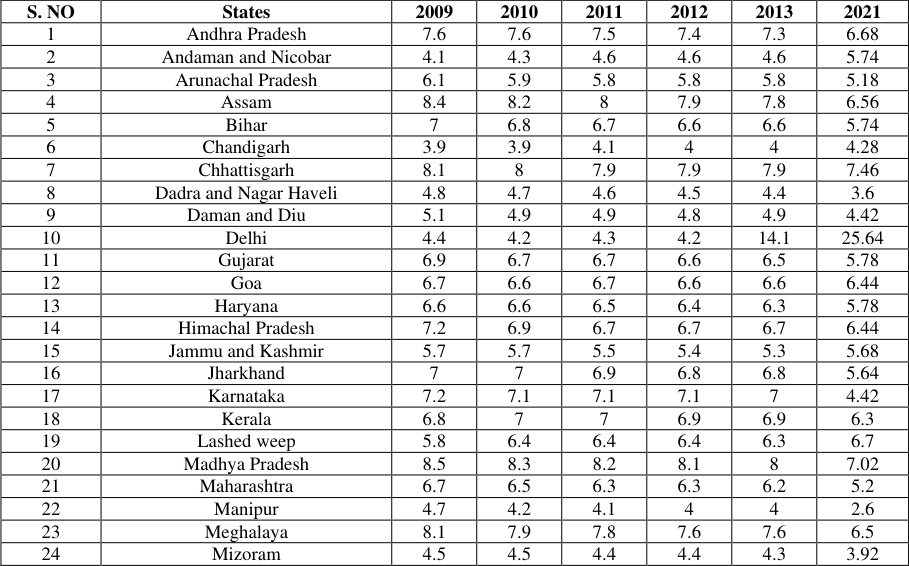 Table 4
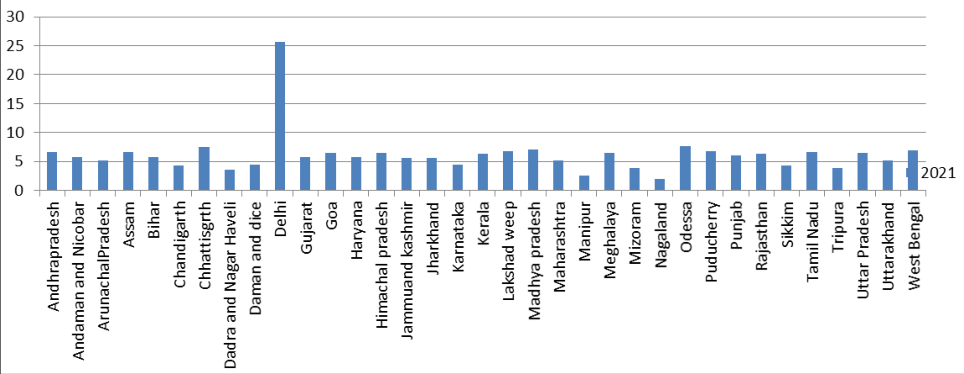 Figure 1
Introduction
Demography is the scientific study of human population, primarily with respect to the size their structure and their development Socioeconomic characteristics of a population expressed statistically, such as age, sex, education level, income level, marital status, occupation, religion, birth rate, death rate, average size of a family, average age at marriage. A census is a collection of the demographic factors associated with every member of a population. Subject matter of Demography is Size and shape of the population, Aspects related to birth rate and death rate, Composition and density of population, Socio-economic problem and Quantitative qualitative aspects. Demography as a science studies about a systematized body of knowledge, It must have its own laws or theories, they can be tested by observation and experimentation, they can make predictions, they can self-corrective and have universal validity. Demography studies about the following aspects scientifically i.e. about the economy, about society, about Economic planning
Population projection
According to a UN study, "population projection is calculations which show the future course of fertility, mortality and migration. They are in general purely formal calculations, developing the implications of the assumptions that are made" in fact, they are only statements about birth rate, death rate and migration of population at some future date, based on certain assumptions. One the other hand a "population forecast is a projection in which the assumptions are considered to yield a realistic picture of the probable future development of a population. Different types of population projections are total projections and regional projections, forward projection and backward projections, high, medium and low projections of population. Projections made for the whole country are called total projections. But when projections are made for a region, state or province, district or ethnic group, they are called regional or sect oral projection s. total projections are easy to make as compared with regional projection. As a matter of fact, all projections are based on based on past data for the future population. They are called forward projection. However, in certain exceptional cases, projections are made about population. These are known as backward projection. Population projections are made on the basis of certain assumptions relating to birth rate, death rate and migration. If it assumed that the birth rate is high, death rate is low, immigration rate is high and emigration rate is low, there is high projection of population. If it is assumed that there is medium increase in birth rate and death rate and medium increase in immigration rate and emigration rate, it is known as medium projection of population. Low projection of population is also suitable for developed countries the assumptions that there are low birth and death rates and both immigration and emigration rate are also low.
2.1Arithmetic method:
In the arithmetic projection method, it is assumed that the annual change in population remains the same throughout the projection period and crude birth and rates are taken.
𝑁
Where, P P = Population projection in the future; P 1 = Present population as per the recent census; P 2 = Size of population in the previous census; n = Number of years between the projection year and the previous census; N = Total number of years between the recent and previous census;
Geometric method:
In the geometric projection method the formula is
Where, P P = Projected population; P 1 = Population as per the recent census; r = Annual rate of increase or decrease of population; n = Number of years.
Objectives of the study
Objectives of the study
Importance of the study
The study of Population Projection is an immense important to an economy, society, planning commission, political system etc. In the present study only selected demographic factors are projected for the Population in 2021.
Limitations of the study
The time period was in sufficient to conduct in depth study for the projected population There was less opportunity to get information from the website for the population data Only few selective models have been applied in this project by considering, the duration and the nature of the project.
Sources of demographic data
Population census Registration of vital statistics relating to births, deaths Sample surveys
Population census
The most important sources of demographic data is the census. The word"census" is derived from the Latin word censers which means" to asses". The new international Webster's dictionary defines it thus: "An official count of the people of country or district including age, sex, employment, etc." A unitednations study defines the population census as the "total process of collecting, compiling and publishing demographic, economic and social data pertaining, at a specified time or times to all persons in a country or delimited territory". Thusa population census is an official enumeration of the inhabitants of country with statistics relating to their location, age, sex, marital status, literacy status, language, educational level, economic activity, number of children, migration, etc. population census is a regular feature of all progressive countries, whatever be their size and political setup. It is conducted at regular intervals, usually every 10 years, for fulfilling well-defined objectives.
Determinants of population growth
The birth rate, death rate and migration are the three important determinants of population growth. In the process of the population growth, even though fertility is a process of physiology, socio-economic conditions of any country can be known from the birth rate information of the country in the same way, death rate too, plays an important role as the determining factor of population growth. As compared to birth and death rates, migration has limited importance as the determinant of population growth. When migrants come with an objective of setling down in a country from some other country, population usually increases, similarly, when people move to other countries for permanent settlement, called migrants, there is likely to be a decrease in population.
Operational Definition a) Fertility
Fertility is generally used to indicate the actual reproductive performance of the woman or groups of women." Fecundity, on the other hand, has different meaning," if a female is able to conceive, then she is said to be fecund. In fact, fecundity is the capacity of a man and woman to produce a live child. In ancient times, both the word, 'still birth' and 'live birth' were used. But at present, the word 'birth' is being used only for'live birth.' The meaning of fertility, in short, is the ability to the female to give birth to a child. Birth rate means the total number of children born per thousand population in a particular area in a specific period.
i) Crude birth rate
The crude birth rate for any specified population is obtained by dividing the number of the births recorded in that population during a specified year by its total number, which gives a fraction of birth per person.
Crude birth rate =
Crude birth rate =
v) Gross reproduction rate
The gross reproduction rate relates the fertility rate to female birth only. It is defined as the number of girls which are expected to be born to 1000 females passing through their child bearing year. The gross reproduction rate is calculated from the total fertility rate Gross Reproduction=
NO.of female births
Total number of births ×total fertility rate b) Mortality Mortality means death. Death is defined as "The permanent disappearance of all evidence of life at any time after birth has taken place." thus death does not include abortions and still births.The study of causes and measures to reduce mortality are very important in demography which can be analyzed in terms of the death rates.
i) Crude death rate
The crude death rate is the number of deaths per 1000 people in a year in relation to the total population.
CDR =
Total deaths in a year Total mid-year population ×1000 It is a simple method to measure the death rate because it taken only the data of total mid-year population and total deaths. But it has certain defects. First, it combines the death of different age groups. So it fails to give a correct measure of mortality because in less develop countries infant mortality rate, maternal death rates and old people death rate are high. Second, it is also not possible to make inter-regional comparisons in a country due to variations in death rate, third, the sources of data for population and deaths are different. Population data are based on the census and that of deaths on registration authorities. This is unscientific.
ii) Age specific death rate
As the death rates in the case of infants and old people are high and that of young people are low, it is advisable to classify people under different categories according to their age groups, the age specific death rate is calculated as under.
Age specific death rate= NO.of deaths in a specific age group of population Total mid-year population in that age group × 1000
Registration method
Another source of the population data is the registration of life or vital statistics. Every person is required by law to register with a specified authority such demographic event as birth, death, marriage, divorce, etc. Registration is secondary source of demographic data which is available from four sources: Vital Registration Population Registration Other Records, International publications.
Vital Registration
Recording of vital events (or statistics) like births, deaths, marriage, divorce, etc.
Birth certificate
Name, Father's Name, Mother's Name, Age of Father, Age of Mother and Legitimacy Death certificate Name of the decease of death, date of death, sex, race/caste, age of the deceased, place of death, cause of death, occupation, marital status, permanent residence, etc.
Population registers
This is another secondary source of collecting population data. A number of European and Asian countries like Belgium, Sweden, Korea, Israel, etc. The population register, help in verifying the correctness of the census figures for that year.
Other Records
Besides the population register, there are other records which are secondary sources of demographic data in developed countries. They maintain population records to meet social security schemes like unemployment insurance and allowance, old age pension, maternity allowance, etc.
International publications
The United Nations Development Program me (UNDP) in its Human Development Report Publish annually demographic data relating to population growth, projection, fertility, mortality, health, etc.
Sample surveys
Sample survey is another source of collecting population data. In sample survey, information is collected from a sample of individuals rather than from the entire population. A sample consists of only a fraction of the total population. Several different population samples can be drawn on the basis of sample surveys such as the number of abortions, contraceptives used, etc.
Collection and Analysis of Data
The data for the study have been collected from the website Office of the Registrar General of India, Ministry of Home Affairs from the census year 1951 to the census year 2011 and calculated projected population of states, Female Fertility ratio, Life Expectancy of Male & Female and Mortality ratio for the census year 2021.
Inference:
From the above table it can be inferred that Uttar Pradesh ranks high in population projection for the year 2021 and Lakshadweep shows very less in population for the year 2021.
Figures and tables from the paper
| S. No | State | 1951 | 1961 | 1971 | 1981 | 1991 | 2001 | 2011 | 2021 |
|---|---|---|---|---|---|---|---|---|---|
| 1 | Andhra Pradesh | 31115 | 35983 | 43503 | 53551 | 66508 | 76210 | 84665 | 93663 |
| 2 | Andaman &Nicobar | 31 | 64 | 115 | 189 | 281 | 356 | 380 | 458 |
| 3 | Arunachal Pradesh | 0 | 337 | 468 | 632 | 865 | 1098 | 1382 | 1549 |
| 4 | Assam | 8029 | 10837 | 14625 | 18041 | 22414 | 26656 | 31169 | 34374 |
| 5 | Bihar | 29085 | 34841 | 42126 | 52303 | 64531 | 82999 | 103804 | 107509 |
| 6 | Chandigarh | 24 | 120 | 257 | 452 | 642 | 901 | 1054 | 1212 |
| 7 | Chhattisgarh | 7457 | 9154 | 11637 | 14010 | 17615 | 20834 | 25540 | 27119 |
| 8 | Dadra&Nagar Haveli | 42 | 58 | 74 | 104 | 138 | 220 | 342 | 324 |
| 9 | Daman and Diu | 49 | 37 | 63 | 79 | 102 | 158 | 242 | 227 |
| 10 | Delhi | 1744 | 2659 | 4066 | 6220 | 9421 | 13851 | 16753 | 18211 |
| 11 | Gujarat | 16263 | 20633 | 26697 | 34086 | 41310 | 50671 | 60383 | 65299 |
| 12 | Goa | 547 | 590 | 795 | 1008 | 1170 | 1348 | 1457 | 1648 |
| 13 | Haryana | 5674 | 7591 | 10036 | 12922 | 16464 | 21145 | 25353 | 27394 |
| 14 | Himachal Pradesh | 2386 | 2812 | 3460 | 4281 | 5171 | 6078 | 6856 | 7528 |
| 15 | Jammu and Kashmir | 3254 | 3561 | 4617 | 5987 | 7837 | 10144 | 12548 | 1374 |
| 16 | Jharkhand | 9697 | 11608 | 14227 | 17612 | 21844 | 26946 | 32966 | 34714 |
| 17 | Karnataka | 19402 | 23587 | 29299 | 37138 | 44977 | 52851 | 61130 | 66825 |
| 18 | Kerala | 13549 | 16904 | 21347 | 25454 | 29099 | 31841 | 33387 | 38389 |
| 19 | Lakshadweep | 21 | 24 | 32 | 40 | 52 | 61 | 64 | 74 |
| 20 | Madhya Pradesh | 18615 | 23218 | 30017 | 38169 | 48566 | 60348 | 72597 | 78041 |
| 21 | Maharashtra | 32003 | 39554 | 50412 | 62783 | 78937 | 96879 | 112373 | 122460 |
| 22 | Manipur | 578 | 780 | 1073 | 1421 | 1837 | 2294 | 2721 | 2989 |
| 23 | Meghalaya | 606 | 769 | 1012 | 1336 | 1775 | 2319 | 2964 | 3102 |
| 24 | Mizoram | 196 | 266 | 332 | 494 | 690 | 889 | 1091 | 1178 |
| 25 | Nagaland | 213 | 369 | 516 | 775 | 1210 | 1990 | 1980 | 2327 |
| 26 | Odisha | 14646 | 17549 | 21945 | 26370 | 31660 | 36805 | 41947 | 45864 |
| 27 | Puducherry | 317 | 369 | 472 | 604 | 808 | 974 | 1244 | 1302 |
| 28 | Punjab | 9161 | 11135 | 13551 | 16789 | 20282 | 24359 | 27704 | 30255 |
| 29 | Rajasthan | 15971 | 20156 | 25766 | 34262 | 44006 | 56507 | 68621 | 73454 |
| 30 | Sikkim | 138 | 162 | 210 | 316 | 406 | 541 | 607 | 677 |
| 31 | Tamil Nadu | 30119 | 33687 | 41199 | 48408 | 55859 | 62408 | 72138 | 77425 |
| 32 | Tripura | 639 | 1142 | 1556 | 2053 | 2757 | 3199 | 3671 | 4204 |
| 33 | Uttar Pradesh | 60274 | 70144 | 83849 | 105137 | 132062 | 166198 | 199581 | 210784 |
| 34 | UttarKhand | 2946 | 3611 | 4493 | 5726 | 7051 | 8489 | 10116 | 108945 |
| 35 | West Bengal | 26300 | 34926 | 44312 | 54581 | 68078 | 80178 | 91347 | 101305 |
Table text extracted from the original PDF; superscript letters are shown inline. The original table image is below.
View original table image
| S. No | States | 2009 | 2010 | 2011 | 2012 | 2013 | 2021 |
|---|---|---|---|---|---|---|---|
| 1 | Andhra Pradesh | 18.3 | 17.9 | 15.1 | 17.5 | 17.4 | 15.04 |
| 2 | Andaman & Nicobar | 16.3 | 15.6 | 15.1 | 15 | 14.6 | 11.32 |
| 3 | Arunachal Pradesh | 21.1 | 20.5 | 19.8 | 19.4 | 19.3 | 15.32 |
| 4 | Assam | 23.6 | 23.2 | 22.8 | 22.5 | 22.4 | 19.8 |
| 5 | Bihar | 28.5 | 28.1 | 27.7 | 27.7 | 27.6 | 25.72 |
| 6 | Chandigarh | 15.9 | 15.6 | 15 | 14.8 | 14.7 | 12 |
| 7 | Chhattisgarh | 25.7 | 25.3 | 24.9 | 24.5 | 24.4 | 21.56 |
| 8 | Dadra & Nagar Haveli | 27 | 26.6 | 26.1 | 25.6 | 25.5 | 22.16 |
| 9 | Daman and Diu | 19.2 | 18.8 | 18.4 | 18.1 | 17.9 | 15.18 |
| 10 | Delhi | 18.1 | 17.8 | 17.5 | 17.3 | 17.2 | 15.28 |
| 11 | Gujarat | 22.3 | 21.8 | 21.3 | 21.1 | 20.8 | 17.76 |
| 12 | Goa | 13.5 | 13.2 | 13.3 | 13.1 | 13 | 12.12 |
| 13 | Haryana | 22.7 | 22.3 | 21.8 | 21.6 | 21.3 | 18.44 |
| 14 | Himachal Pradesh | 17.2 | 16.9 | 16.5 | 16.2 | 16 | 13.46 |
| 15 | Jammu and Kashmir | 18.6 | 18.3 | 17.8 | 17.6 | 17.5 | 15.06 |
| 16 | Jharkhand | 25.6 | 25.3 | 25 | 24.7 | 24.6 | 22.44 |
| 17 | Karnataka | 19.5 | 19.2 | 18.8 | 18.5 | 18.3 | 15.76 |
| 18 | Kerala | 14.7 | 14.8 | 15.2 | 14.9 | 14.7 | 14.96 |
| 19 | Lashed weep | 15 | 14.3 | 14.7 | 14.8 | 14.8 | 14.82 |
| 20 | Madhya Pradesh | 27.7 | 27.3 | 26.9 | 26.6 | 26.3 | 23.46 |
| 21 | Maharashtra | 17.6 | 17.1 | 16.7 | 16.6 | 16.5 | 14.2 |
| 22 | Manipur | 14 | 14.9 | 14.4 | 14.6 | 14.7 | 15.62 |
| 23 | Meghalaya | 15.4 | 24.5 | 24.1 | 24.1 | 23.9 | 39 |
| 24 | Mizoram | 17.6 | 17.1 | 16.6 | 16.3 | 16.1 | 12.94 |
Table text extracted from the original PDF; superscript letters are shown inline. The original table image is below.
View original table image
| 25 | Nagaland | 17.2 | 16.8 | 16.1 | 15.6 | 15.4 | 11.42 |
|---|---|---|---|---|---|---|---|
| 26 | Odessa | 21 | 20.5 | 20.1 | 19.9 | 19.6 | 16.82 |
| 27 | Puducherry | 16.5 | 16.7 | 16.1 | 15.8 | 15.7 | 13.66 |
| 28 | Punjab | 17 | 16.6 | 16.2 | 15.9 | 15.7 | 12.98 |
| 29 | Rajasthan | 27.2 | 26.7 | 26.2 | 25.9 | 25.6 | 22.32 |
| 30 | Sikkim | 18.1 | 17.8 | 17.6 | 17.2 | 17.1 | 14.96 |
| 31 | Tamil Nadu | 16.3 | 15.9 | 15.9 | 15.7 | 15.6 | 14.28 |
| 32 | Tripura | 14.8 | 14.9 | 14.3 | 13.9 | 13.7 | 11.12 |
| 33 | Uttar Pradesh | 28.7 | 28.3 | 27.8 | 27.4 | 27.2 | 23.98 |
| 34 | Uttarakhand | 19.7 | 19.3 | 18.9 | 18.5 | 18.2 | 15.12 |
| 35 | West Bengal | 17.2 | 16.8 | 16.3 | 16.1 | 16 | 13.38 |
Table text extracted from the original PDF; superscript letters are shown inline. The original table image is below.
View original table image
| States | 2005 | — | 2006 | — | 2007 | — | 2008 | — | 2009 | — | 2021 | — |
|---|---|---|---|---|---|---|---|---|---|---|---|---|
| Male | Female | Male | Female | Male | Female | Male | Female | Male | Female | Male | Female | |
| Andhra Pradesh | 63.4 | 67.9 | 63.5 | 68.2 | 64 | 68.6 | 64.7 | 69.4 | 65.5 | 70.4 | 71.8 | 77.58 |
| Assam | 60.5 | 62.9 | 61 | 63.2 | 61.2 | 63.6 | 61.2 | 64.8 | 61.9 | 65.1 | 65.4 | 72.32 |
| Bihar | 64.9 | 65.3 | 65.5 | 66.2 | 65.9 | 66.8 | 66.7 | 67.6 | 67.3 | 68 | 74.5 | 76.3 |
| Gujarat | 64.4 | 68.7 | 64.9 | 69 | 65.2 | 69.6 | 65.5 | 70.1 | 66 | 70.5 | 70.5 | 76.16 |
| Haryana | 65.1 | 69.2 | 67 | 69.5 | 65 | 69.8 | 65.4 | 70.1 | 65.8 | 70.9 | 65.4 | 75.5 |
| Himachal pradesh | 67.7 | 72 | 67.7 | 72.4 | 67.9 | 72.3 | 68.3 | 72.7 | 69 | 73.1 | 72.6 | 76 |
| Jammu&Kashmir | 68.9 | 71.2 | 69.2 | 71.1 | 69.4 | 71.9 | 69.9 | 72.4 | 70.6 | 74 | 75.3 | 81.78 |
| Karnataka | 64.6 | 69.2 | 64.9 | 69.7 | 65.2 | 70 | 65.8 | 70.3 | 66.4 | 70.8 | 71.7 | 75.32 |
| Kerala | 71.3 | 77.2 | 71.5 | 76.9 | 71.5 | 77.3 | 71.6 | 77.7 | 71.8 | 77.8 | 73.1 | 80.18 |
| Madhya Pradesh | 60.8 | 63.1 | 61.1 | 63.8 | 61.3 | 64.5 | 61.9 | 65 | 62.3 | 65.5 | 66.8 | 72.78 |
| Maharashtra | 67.6 | 71.9 | 67.9 | 71.9 | 68.3 | 72.4 | 68.8 | 72.9 | 69.4 | 73.4 | 74.7 | 78.1 |
| Odisha | 61.7 | 63.4 | 62.2 | 63.9 | 62.9 | 64.5 | 63.4 | 65.3 | 63.8 | 65.9 | 70.4 | 73.56 |
| Punjab | 67.2 | 71.4 | 67.4 | 71.6 | 67.7 | 72.4 | 68.1 | 72.9 | 69.1 | 73.4 | 74.2 | 79.76 |
| Rajasthan | 64.7 | 67.8 | 64.7 | 68.3 | 65 | 68.7 | 65.2 | 69.4 | 65.4 | 70 | 67.7 | 76.54 |
| Tamil Nadu | 66.9 | 70.6 | 67.1 | 70.9 | 67.6 | 71.4 | 67.9 | 71.9 | 68.2 | 72.3 | 72.3 | 77.58 |
| Uttar Pradesh | 61.6 | 63.1 | 61.8 | 63.7 | 61.9 | 64.2 | 62.3 | 64.8 | 62.5 | 65.2 | 65.2 | 71.62 |
| West Bengal | 66.9 | 70.6 | 67.8 | 71 | 67.8 | 71.3 | 68.1 | 71.5 | 68.5 | 71.6 | 72.7 | 74.7 |
Table text extracted from the original PDF; superscript letters are shown inline. The original table image is below.
View original table image
| S. NO | States | 2009 | 2010 | 2011 | 2012 | 2013 | 2021 |
|---|---|---|---|---|---|---|---|
| 1 | Andhra Pradesh | 7.6 | 7.6 | 7.5 | 7.4 | 7.3 | 6.68 |
| 2 | Andaman and Nicobar | 4.1 | 4.3 | 4.6 | 4.6 | 4.6 | 5.74 |
| 3 | Arunachal Pradesh | 6.1 | 5.9 | 5.8 | 5.8 | 5.8 | 5.18 |
| 4 | Assam | 8.4 | 8.2 | 8 | 7.9 | 7.8 | 6.56 |
| 5 | Bihar | 7 | 6.8 | 6.7 | 6.6 | 6.6 | 5.74 |
| 6 | Chandigarh | 3.9 | 3.9 | 4.1 | 4 | 4 | 4.28 |
| 7 | Chhattisgarh | 8.1 | 8 | 7.9 | 7.9 | 7.9 | 7.46 |
| 8 | Dadra and Nagar Haveli | 4.8 | 4.7 | 4.6 | 4.5 | 4.4 | 3.6 |
| 9 | Daman and Diu | 5.1 | 4.9 | 4.9 | 4.8 | 4.9 | 4.42 |
| 10 | Delhi | 4.4 | 4.2 | 4.3 | 4.2 | 14.1 | 25.64 |
| 11 | Gujarat | 6.9 | 6.7 | 6.7 | 6.6 | 6.5 | 5.78 |
| 12 | Goa | 6.7 | 6.6 | 6.7 | 6.6 | 6.6 | 6.44 |
| 13 | Haryana | 6.6 | 6.6 | 6.5 | 6.4 | 6.3 | 5.78 |
| 14 | Himachal Pradesh | 7.2 | 6.9 | 6.7 | 6.7 | 6.7 | 6.44 |
| 15 | Jammu and Kashmir | 5.7 | 5.7 | 5.5 | 5.4 | 5.3 | 5.68 |
| 16 | Jharkhand | 7 | 7 | 6.9 | 6.8 | 6.8 | 5.64 |
| 17 | Karnataka | 7.2 | 7.1 | 7.1 | 7.1 | 7 | 4.42 |
| 18 | Kerala | 6.8 | 7 | 7 | 6.9 | 6.9 | 6.3 |
| 19 | Lashed weep | 5.8 | 6.4 | 6.4 | 6.4 | 6.3 | 6.7 |
| 20 | Madhya Pradesh | 8.5 | 8.3 | 8.2 | 8.1 | 8 | 7.02 |
| 21 | Maharashtra | 6.7 | 6.5 | 6.3 | 6.3 | 6.2 | 5.2 |
| 22 | Manipur | 4.7 | 4.2 | 4.1 | 4 | 4 | 2.6 |
| 23 | Meghalaya | 8.1 | 7.9 | 7.8 | 7.6 | 7.6 | 6.5 |
| 24 | Mizoram | 4.5 | 4.5 | 4.4 | 4.4 | 4.3 | 3.92 |
Table text extracted from the original PDF; superscript letters are shown inline. The original table image is below.
View original table image
References
3 in the original paper- Source: Sample Registration System (SRS) Bulletin various issues, Office of the Registrar 7.2 Inference From the above table it can be inferred that Meghalaya rank high and Tripura rank less in Female Fertility ratio for the year 2021.
- Table 3: Table showing Life Expectancy of Male & Female of selected states for the year 2021 States 2005 2006 2007 2008 2009 2021 Male Female Male Female Male Female Male Female Male Female Male Female Andhra Pradesh
- Delhi. 2 nd Revised Edition, 2003.