
Research article · 2018 · Full text
International Journal of Advanced Biochemistry ResearchBiomarkers to assess chronic alcohol consumption: carbohydrate deficient transferrin (CDT) a reliable biomarker
Volume 2(2) · Pages 13–15 · DOI: 10.33545/26174693.2018.v2.i2a.16 ↗
Research areasAlcohol Consumption and Health EffectsLiver Disease Diagnosis and TreatmentMetabolomics and Mass Spectrometry Studies
Abstract
Author-writtenAlcohol abuse is very common all over the world. The biological, clinical and social effects of alcohol abuse have long made evident the need for objective and specific markers for alcohol-related diseases and for early detection of alcohol consumers at risk. Alcohol abusers may exhibit several biochemical alterations, some of which have been used as markers of alcoholism i.e. Alanine Aminotransferase (ALT), Gamma Glutamyl Transferase (GGT) and Carbohydrate Deficient Transferrin (CDT). The present study was taken up to estimate serum biochemical parameters i.e. ALT, GGT and CDT in chronic alcoholics. The study subjects were divided into 2 group’s i.e. Group-I was cases and Group-II was controls. Group-I includes (n=30) male chronic alcoholics with a history of alcohol abuse (since 1year to 11+ years) and aged 25-65 years. Group-II includes (n=30) age-matched, non alcoholics were taken as controls in the study. Biomarkers i.e. ALT, GGT and CDT were assayed in the serum of all study subjects. The present study shown increased serum levels of ALT, GGT and CDT in Group-I as compared to Group-II. There is a significant increase of enzyme activities seen in CDT, when compared to serum GGT, ALT levels of case group. CDT sensitive bio markers which can be used to diagnose alcohol abuse and is superior to GGT, ALT in terms of sensitivity as well as specificity.
Summary
Source-checkedPlain-language reading of the full paper, prepared with AI and checked against the text. Each point links to the authors' own words.
Why it matters
- Alcohol abuse is a global issue, creating a need for objective markers to detect at-risk consumers and alcohol-related diseases early. View evidence ↗
- Serum Gamma-Glutamyl Transferase (GGT) is currently the most common marker used to identify alcohol abuse. View evidence ↗
- Carbohydrate Deficient Transferrin (CDT) is a newer marker that is sensitive and specific to regular high alcohol intake. View evidence ↗
The question
- The study aimed to estimate and compare serum levels of ALT, GGT, and CDT in individuals with chronic alcoholism. View evidence ↗
What they did
- The study compared 30 male chronic alcoholics (aged 25-65, with 1 to 11+ years of abuse) against 30 age- and sex-matched healthy controls. View evidence ↗
- Occasional drinkers, smokers, tobacco chewers, and patients with systemic illnesses were excluded from the study. View evidence ↗
- ALT and GGT levels were measured using a Mindray BS-380 Auto analyzer, while CDT levels were measured via an ELISA kit. View evidence ↗
- Data were analyzed using SPSS version 11.0, with results expressed as Mean ± SD and significance determined by ANOVA. View evidence ↗
What they found
- Serum ALT levels were significantly higher in chronic alcoholics (117.03 ± 42.19 IU/L) compared to controls (25.43 ± 6.36 IU/L), with p < 0.001. View evidence ↗
- Serum CDT levels were significantly higher in chronic alcoholics (492.05 ± 56.20 mg/L) compared to controls (41.15 ± 18.88 mg/L), with p < 0.001. View evidence ↗
- While all three markers increased in alcoholics, CDT showed the highest increase among the cases. View evidence ↗
- The authors suggest that GGT and CDT are complementary markers and are more effective as a diagnostic tool when used in combination. View evidence ↗
What it means
- The authors conclude that CDT is a high-value marker for defining heavy alcohol consumption due to its superior sensitivity and specificity. View evidence ↗
- The study population consisted entirely of males, which the authors attribute to local cultural backgrounds. View evidence ↗
Visual summary
3 visualsIllustrations explain the paper; charts are replotted from the paper's own table values.
Complementary Biomarkers Concept
AI-generated conceptual illustration (human blood serum). It explains the idea and does not show study data.
View source evidence ↗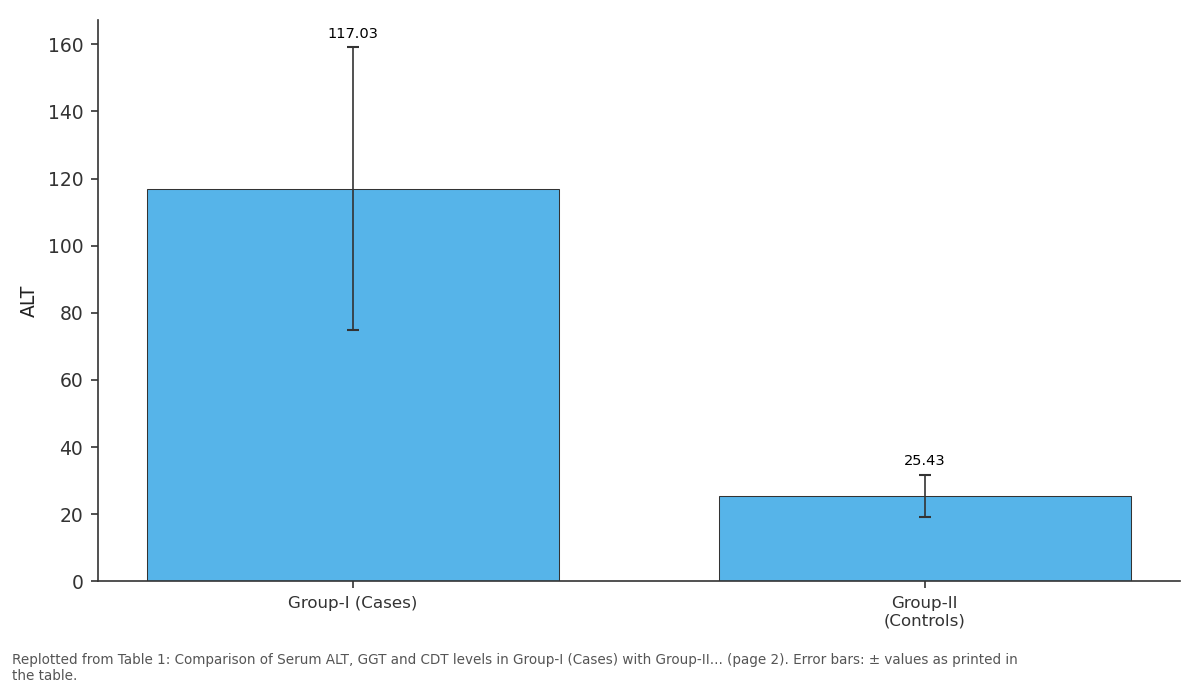
ALT: Group-I (Cases) vs Group-II (Controls)
Replotted from Table 1 (page 2) of the original paper. Every bar is the paper's own table value.
View source evidence ↗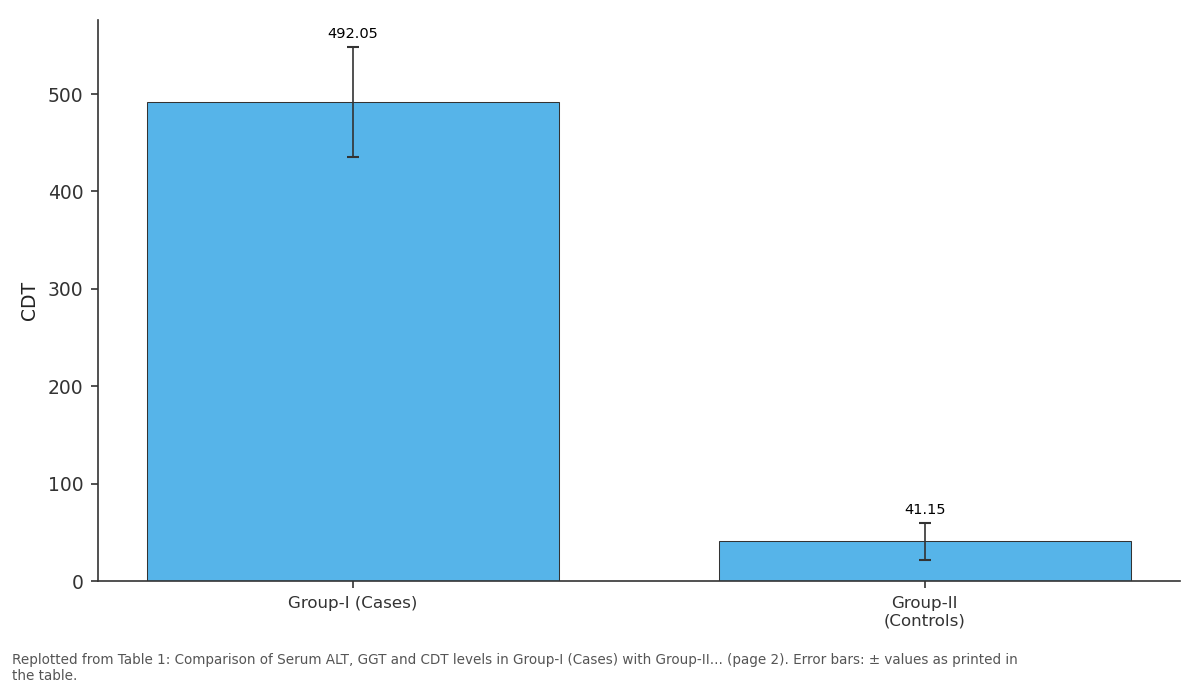
CDT: Group-I (Cases) vs Group-II (Controls)
Replotted from Table 1 (page 2) of the original paper. Every bar is the paper's own table value.
View source evidence ↗Figures & tables
From the original paper Table 1
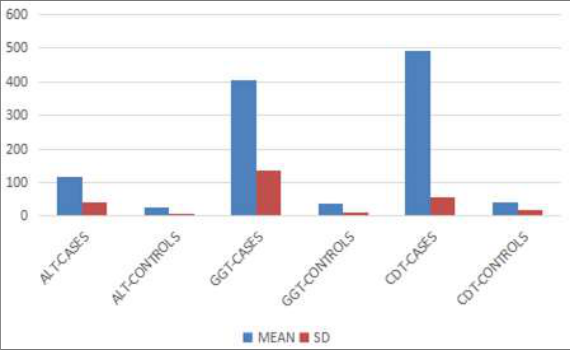 Figure 1
Introduction
The magnitude of the problem of alcohol abuse has to be seen in light of three basic features of ethanol: It is easy to produce, it is a solvent and it has sedative and euphorizing effects on the central nervous system, similar to those of anesthetics. These characteristics have made ethanol the most widely used centrally acting drug known. Some other basic facts about ethanol are also important: It has immediate and direct biochemical and biophysical effects on cell membranes [1,2] . It has basic metabolic consequences through its oxidation [3,4] . Susceptibility to Alcoholic Liver Disease: Early epidemiological studies of alcoholic liver disease showed a dose response relationship between cumulative alcohol consumption and the risk of cirrhosis [5] . In contrast, recent prospective studies have suggested that only about 20% of heavy drinkers will ultimately develop alcoholic cirrhosis, provided their average daily intake regularly exceeds a threshold dose of about 50-60 g. This is consistent with the common clinical experience that some individuals develop alcoholic cirrhosis while still in their early 20s while others escape damage after a lifetime of heavy drinking [6] . Biochemical markers have been used for detecting and monitoring alcohol abuse such as serum Alanine Transaminase (ALT), γ-Glutamyl Transferase (GGT). Elevated serum Gamma-Glutamyl Transferase (GGT) level remains the most widely used marker of alcohol abuse. Levels typically rise after heavy alcohol intake that has continued for several weeks in response to the acute hepatocellular damage [7] . A new diagnostic marker has been introduced that appears to fulfill important clinical criteria. It is apparently dependent on ethanol or its metabolism, it appears in serum after regular high alcohol intake and it shows a high sensitivity and specificity. This marker is Carbohydrate Deficient Transferrin (CDT). Asialotransferrin, monosialotransferrin and disialotransferrin are collectively referred to as Carbohydrate Deficient Transferrin (CDT) [8] .
Materials and methods
This study was carried out in the Department of Biochemistry (2013-14) at Kamineni Institute of Medical Sciences and Hospital, Narketpally, Nalgonda District, Telangana State, India. The study protocol was approved by the institutional ethics committee. A written informed consent was obtained from all study subjects.
Inclusion Criteria
1. The study subjects were divided into 2 groups i.e.
Group-I (Cases) and Group-II (Controls) 2. Group-I (Cases) with history of chronic alcohol consumption (1 year to 11 years+) and n=30. Age between 25-65 years. For ALT, GGT estimations 5ml of random venous blood sample was collected from the all the subjects in a sterile disposable syringe which was transferred into centrifuge tubes and could clot for 30 minutes after that sample centrifuged at 3000 rpm for 10 minutes and the supernatant serum was collected and assayed immediately. For CDT estimation 5 ml of random venous blood sample was collected and allowed samples to clot for 30 minutes. And then samples were centrifuged at 3000 rpm for 10 minutes and serum was collected and assayed immediately. The levels of ALT, GGT in serum were estimated by using the end-point method by Mindray BS-380 Auto analyzer. The levels of CDT in serum estimated by ELISA kit method.
Results
The results of this study shown that the activities of the enzymes ALT, GGT and CDT in serum samples of subjects with chronic alcoholism were higher when compared to the control.
(Table no-I & Figure-I).
The statistical analysis was performed using SPSS software version 11.0. The descriptive results were expressed as Mean and Standard Deviation. The significance of the differences in the values of the parameters among chronic alcoholics (Group-I) and controls (Group-II) was evaluated by ANOVA (Analysis of Variance). -I: Shows that there is a statistically significant difference in between both the groups in ALT (IU/L) levels (p<0.001) with 117.03 ± 42.19 in Group-I and 25.43 ± 6.36 for Group-II. In GGT levels (IU/L) (p<0.001) with 405.10 ± 135.39 for Group-I and 36.47 ± 8.97 for Group-II. In CDT (mg/L) (p<0.001) with 492.05 ± 56.20 for Study Group and 41.15 ± 18.88 for Control Group.
Discussion
The present study selected 30 study subjects (Study Group) who were diagnosed to have harmful alcohol consumption and 30 healthy subjects (Control Group) in the comparable age group. The study population comprised fully of males which may be attributed to the cultural background of the local population. It is evident that there is a statistically significant difference between the cases and controls for the parameters namely ALT, GGT and CDT. Furthermore, it is observed that CDT and GGT showed a highly significant difference among the groups when compared to ALT. It shown that all parameters are increased in cases compared to controls and among cases CDT is more. GGT is a well established marker of liver disease and has been extensively studied in alcoholism. In the present study GGT was found to be significantly increased in the cases when compared to controls. The mean values (IU/L) were 405.10 for cases and 36.47 for control group. Similar highly significant results have been reported earlier [9,10] . Finally, in the present study serum CDT was elevated in of the cases and GGT was above the reference range in of the International Journal of Advanced Biochemistry Research cases. ALT levels in serum of cases increased but the increase was low when compared to the Mean and SD of CDT and GGT. However, when the two markers are used in combination of those in the case group were found to have fallen in that group. This suggests that when used together GGT and CDT make a better diagnostic tool than used alone. CDT and GGT should, therefore, be considered as complementary rather than alternative markers [11] .
Conclusion
Bio markers revealing chronic alcohol consumption including AST, ALT, GGT and MCV are still used as the standard markers to in defining alcoholism treatment course. CDT, on the other-hand considered to be a relatively new marker that added an extra value to better interpretation of heavy alcohol consumption with higher sensitivity and specificity. CDT result would be of higher value in defining heavy alcohol consumption.
Acknowledgement
Acknowledgment This research was supported by Kamineni Institute of Medical Sciences and Hospital, Narketpally, Nalgonda District, Telangana State, India. And Grant maker Dr. Shruti. Mohanty, Principal and Professor of Biochemistry. I sincerely thank Dr. Shruti. Mohanty, Professor of Biochemistry and Principal, for providing infrastructure, motivation and support to furnish the present study. I thankful to Dr. D. Archana. A. Dharwadkar, Professor and HOD, Department of Biochemistry, for her support and encouragement to carry out this study.
Figures and tables from the paper
| Parameters | Group-I (Cases) | Group-II (Controls) | p-Value |
|---|---|---|---|
| ALT | 117.03±42.19 | 25.43±6.36 | <0.001** |
| GGT | 405.10±135.39 | 36.47±8.97 | <0.001** |
| CDT | 492.05±56.20 | 41.15±18.88 | <0.001** |
Table text extracted from the original PDF; superscript letters are shown inline. The original table image is below.
View original table image
References
10 in the original paper- Seeman P. The membrane actions of anesthetics and tranquilizers. Pharmacol Rev. 1972; 24:583-655.
- Goldstein DB, Chin JH. Interaction of ethanol with biological membranes. Fed Proc. 1981; 40:2073-6.
- Rubin E. Alcohol and the cell. Ann NY Acad Sci. 1987; 491:1-412.
- Crabb DW, Bosron WF, Li TK. Ethanol metabolism. Pharmacol Ther. 1987; 34:59-73.
- Lelbach WK. Cirrhosis in the alcoholic and its relation to the volume of alcohol abuse. Ann NY Acad Sci. 1975; 252:85-105.
- Bird GLA, Williams R. Factors determining cirrhosis in alcoholic liver disease. Mol Aspects Med. 1988; 10:97105.
- Stibler H. Carbohydrate-deficient transferrin in serum: a new marker of potentially harmful alcohol consumption reviewed. Clin Chem. 1991; 37:2029-37.
- Allen JP, Sillanaukee P, Anton R. Contribution of carbohydrate deficient transferrin to gamma glutamyl transpeptidase in evaluating progress of patients in treatment for alcoholism. Alcohol Clin Exp Res. 1999; 23:115-20.
- Aithal PG, Thornes H, Dwarakanath AD, Tanner AR. Measurement of CDT in a general medical clinic: Is this test useful in assessing alcohol consumption? Alcohol & Alcoholism. 1998; 33(3):304-09.
- Helander A, Voltaire Carlsson A, Borg S. Longitudinal comparison of carbohydrate-deficient transferrin and gamma-glutamyl transferase: complementarymarkers of excessive alcohol consumption. Alcohol Alcohol. 1996; 31:101-7.
Cited by 1
From OpenAlex, OpenCitations and reference lists read by Scinovex
- What is the relationship between chronic alcohol consumption and liver function markers in adult ?: A Systematic Review ↗
Nevan Bayu Sunggoro · The Indonesian Journal of General Medicine · 2025
Introduction: Chronic alcohol consumption is a leading cause of preventable liver disease globally. This systematic review synthesizes and evaluates current evidence on the significant relationship between chronic alcohol consumption and liver function markers in adults. Methods: Following PRISMA guidelines , a systematic search was conducted across PubMed, Semantic Scholar, Springer, and Google Scholar. Inclusion criteria targeted observational studies, systematic reviews,…
❝ 0PDF