
Research article · 2018 · Full text
International Journal of Statistics and Applied MathematicsDetecting factors influencing the academic performance of the university students of Bangladesh
Volume 3(6) · Pages 22–27
Research areasDiverse Scientific Research Studies
Abstract
Author-writtenThe academic performance of Students is affected by many factors based on their social and geographical condition. The factors also varies from one to another on basis of the pattern of the culture and physical condition. Many empirical researches are carried out to explore those factors by many researcher based on the enrolment of school, college and University students. Our research conducted based on the students who are studding the undergraduate and graduate program in Mawlana Bhashani Science and Technology University (MBSTU), who live in the residential halls and nearby hostels of the university. In our study we have tried to identify major factors affecting the academic performance of the students’ of MBSTU. To understand the change in the performance based on the change in the factors we preferred to build a model based on the information. The result of this study indicated that social and some university related factors such as university academic and administrative rules and regulations etc. are playing vital role on the academic performance of the students. Some personal and socio economic factors are also associate with the performances of the students too.
Summary
Source-checkedPlain-language reading of the full paper, prepared with AI and checked against the text. Each point links to the authors' own words.
Why it matters
- Education is considered the foundation of a nation and the most critical factor for human development. View evidence ↗
- Experts suggest that low socio-economic status can negatively impact academic performance because students' basic needs may go unfulfilled. View evidence ↗
- Measuring academic performance is complex because it results from a combination of environmental, psychological, and socio-economic factors. View evidence ↗
The question
- The study aims to identify and analyze the specific factors that influence the quality of students' academic performance. View evidence ↗
- The research specifically focuses on identifying factors that influence the academic results of students at Mawlana Bhashani Science and Technology University (MBSTU). View evidence ↗
What they did
- The researchers used a stepwise cluster sampling technique, treating all MBSTU students as the population and residential halls as the clusters. View evidence ↗
- Data collection involved both qualitative and quantitative information gathered through structured questionnaires. View evidence ↗
- The questionnaires focused on academic activities as well as social, economic, and demographic variables. View evidence ↗
- Before performing regression analysis, the authors tested for normality, multicollinearity (using VIF), and heteroscedasticity. View evidence ↗
What they found
- There is a positive association between study time and CGPA, with a correlation coefficient of 0.378. View evidence ↗
- Completing the syllabus had the strongest relationship with CGPA among the variables, with a correlation coefficient of 0.434. View evidence ↗
- The capability of memorizing showed a negative relationship with academic results, causing a 4% negative variation. View evidence ↗
- Teacher's lectures were found to cause a significant 8.1% positive variation in academic results. View evidence ↗
- Completing the syllabus resulted in a significant 15.8% positive variation in academic performance. View evidence ↗
- Group study was associated with a significant 3.1% positive variation in students' CGPA. View evidence ↗
- Demographic factors (age, gender, residence, marital status) and socio-economic/cultural factors (family background and income) had no significant effect on academic performance. View evidence ↗
What it means
- The authors suggest that increasing the requirements for student intake could potentially lead to better academic performance. View evidence ↗
- The study concludes that university-related factors, including administrative and academic rules, as well as social factors, play a vital role in student performance. View evidence ↗
Visual summary
1 visualsIllustrations explain the paper; they do not show study data.
Factors Influencing CGPA
AI-generated conceptual illustration (University students in Bangladesh). It explains the idea and does not show study data.
View source evidence ↗Figures & tables
From the original paper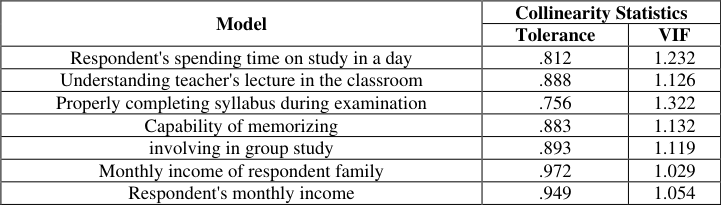 Table 2
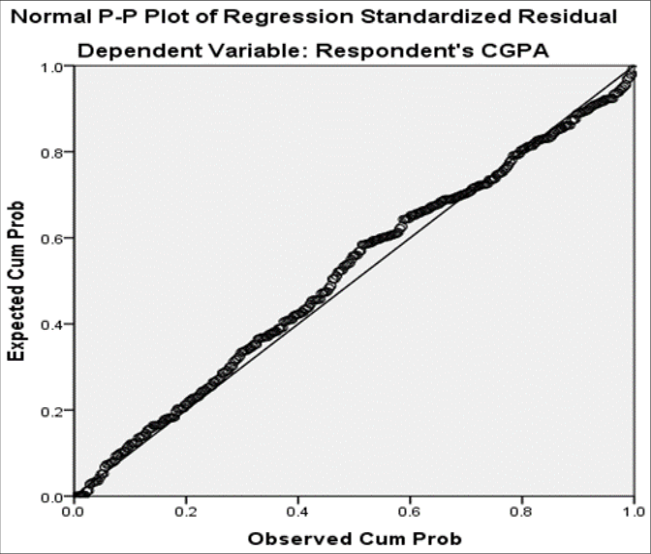 Figure 1
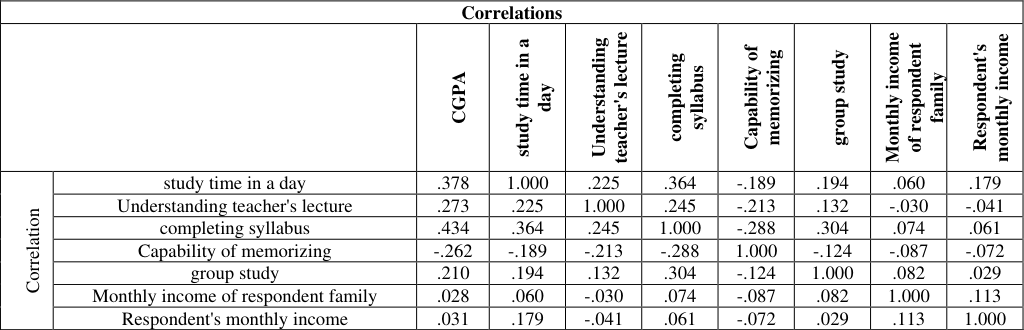 Table 3
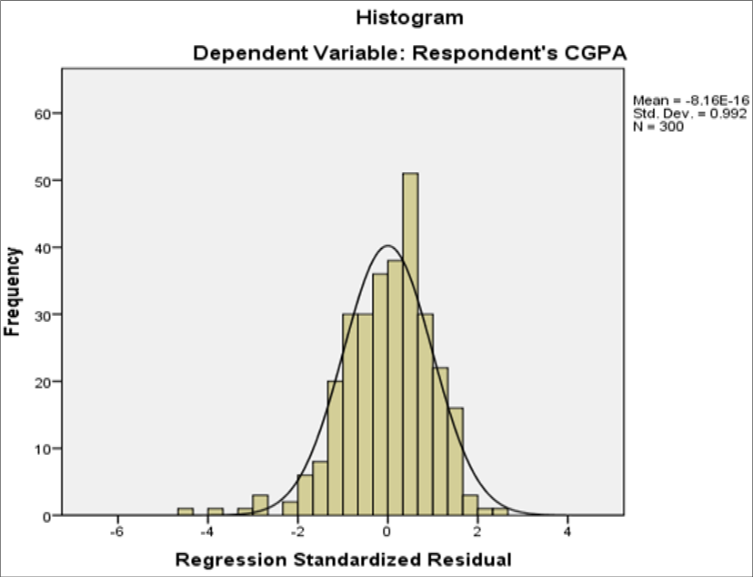 Figure 2
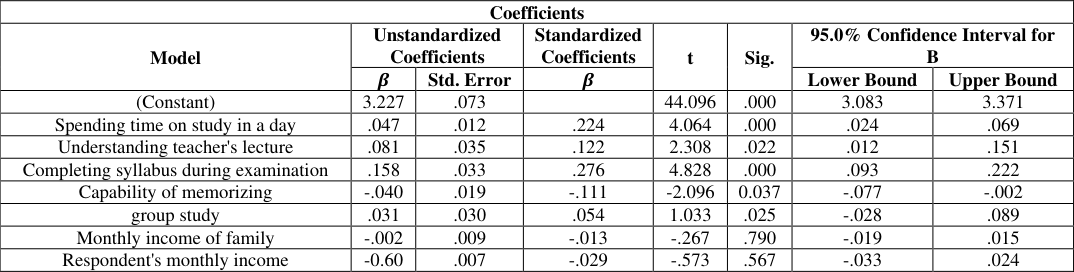 Table 4
Introduction
Education is the backbone of a nation. It is also the most important factor for the development of human. Thus, education can promote national unity. In order to uplift the degree of awareness of the society, education plays a prime role. It makes all people conscious. They will not follow the old dead and evil tradition. Education profoundly enhances human prosperity. Educators, trainers and researchers have long been interested in exploring variables contributing effectively for quality performance of learners. These variables are inside and outside school that affect student's quality of academic result. These factors may be termed as student factors, family factors, university factors and teachers (Crosnoe, Johnson & Elder; 2004) [9] . The formal investigation about the role of these demographic factors rooted back in 17 th century (Mann; 1985) [21] . Generally these factors include age, gender, geographical belongingness, marital status, socioeconomic status, parent's education level, parental profession, income, study hour, sleeping time, using internet. These are usually discussed under the umbrella of demography (Ballatine; 1993) [1] . In a broader context demography is referred to as a way to explore the nature and effects of demographic variables in the biological and social content. Unfortunately, defining and measuring the quality of education is not a simple issue and the complexity of this process increase due to the changing value of quality attributes associated with the different stakeholders' view point (Blevins; 2009, Parri; 2006) [4] . Besides other factors, socio-economic status is one of the most researched and debated factor among educational professionals that contribute towards the academic performance of students. The most prevalent arguments are that the socio-economic status of learners affects the quality of their academic performance. Most of the experts argue that the low socio-economic status has negative effect on the academic performance of students because the basic needs of students remain unfulfilled and hence they do not perform better academically (Adams; 1996). The low socio-economic status causes environmental deficiencies which results in low self-esteem of students (US department of education, 2003). More specifically, this study aims to identify and analyze factors that affect the quality of student's academic performance.
Background of the study
Students entering in the university facing a very competitive exam from different dimensions with almost similar quality but perusing his or her degree on that university many of them are not performing well, even some are unable to complete their degree. Measuring of academic performance of students is challenging since student performance is the product of socio-economic, psychological and environmental factors. For the last 20 years, education in Bangladesh is growing as a profitable industry with prime objective of maximizing profit by delivering high quality of education that produces welleducated, skilled, mannered students according to needs and requirements of the dynamically growing market. That's why the scope of research is always there to find out what are the factors that affect the performance of the students. There are two groups of students as generally perceived; that are those who improve and those who do not improve. This study can contribute to find out the factors, which are responsible for student's inelastic behavior towards study; although education is one of the social factors where by gender disparity is reflected. The effect of education system, tools and other variables on attitude toward learning suggested that most of the element had positive effects mainly on motivation for learning and interested in the lesson. But there are also some important effects which have negative effects on educational performance of the students and they also de-motivated students for learning. Student performance is generally viewed as product of socio-economic, psychological and environmental factors. Hence the factors are expected to vary from place to place, country to country, religion to religion and another. This research is focusing on the activities of the students with which they are affected by in their academic life.
Objective of the study
Human life being affected by various factors relating to his/her life and most of the time change of one factor affects another factor with different diversity. Education is one of the important factors of life which is also being affected by many factors. Our main focus of this study is to identify the influencing factors regarding the academic results of the student of MBSTU. For this reason we are going to identify the associations between different factors like study hour, social media, income etc. with the academic results. We also want to establish the relationship between the significant factors and the student's academic performance to understand the change in the academic results with the factors. The effect of social media on the students' academic performance is also a matter of concern of this study.
Review of literature
Education is one of the most important factors that determine the development of society or country. The main objective of this study was to identify the factors that affect student's academic result in higher learning institutions. Due to different factors, however, both the quantity and the quantity of graduates from higher education in Ethiopia have becomes points of discussions now a day a number of indicators can be used to determine the academic achievement of graduation students. In the literature the most frequently employment measure is student's cumulative grade point average (CGPA).We consider the academic achievement of male and female students in terms of CGPA. Different researchers have made attempts to identify the factor that affect student's performances in lower and higher institutions. (Anderson, et al; 1994) concludes that students whose performance is better in high school they also perform better in college and universities and men had better grades than women. (Borg and Shapiro; 1996) said that a student's performance is better in classroom where students and professor have similar learning styles. On the other hand (Topping; 1994) have found that sitting at the back in the classroom and absence from classes negatively affect the students' performance. According to topping and increase of one percent in absence will reduce the score of the final examination by 0.043%. Another most important factors affecting students' academic performance are how early they starts reading for final exams, ESLCE GPA. Father's education, whether he /she gets the department of first choice, income category of the father and age of the student of some other factors to evaluate the performance (younger, Warrington and Williams; 1999). This indicate the students whose father more educated they perform better than students having less educated or illiterate fathers the result of the data analysis show that the most important factors that at high school level (ESLCE) GPA, getting the department of first choice time of starting reading for examinations and age of the student influenced their performance (Leonard and Jiang; 1999). Family background is also another important factor found to be significant in this study although it had not been considered in the previous studies. The more the father is educated the better is the performance of the student. This may be due to the fact that educated fathers may exempt their children from doings some household activities when they get low score (size, 2001). Performance of students on the other hand, is negatively related to economic statuses of the fathers.
Profile of the Study Area and Sources of the Data
The study is conducted by using stepwise cluster sampling technique where all the students of Mawlana Bhashani Science and Technology University are considered as the population and residential halls are considered as the cluster. To incorporate both male and female students in our study we have done sampling both male halls and female halls. For male students we consider BSMRH, MAMH, SZRH and others hostels and mess and for female students we consider SIJIH, AKBH and others private women hostels and mess. The sample covers every departments as well as faculties of the university and the respondents are from different academic sessions of the current semester. Data was gathered in this studies are both qualitative and quantitative by using structured questionnaires. The questionnaire includes demographic, social and economic variables along with their academic activities.
Checking assumption for fitting regression model
Before using the regression analysis we have to check assumption for fitting regression model. At first we are going to check whether the data are normal or not. A graphical tool for assessing normality is the normal probability plot, a q-q plot and a p-p plot of the standardized data against the standard normal distribution. After checking the normality assumption we have to check if any multicollinearity exists in our data set. Hence we use variance inflation factor (VIF) for detecting multicollinearity. Then we check heteroscedasticity for our data set. We may use batlets test, spearman's rank correlation test, gold-feld -quandt test, park test, peak test, glejser test, graphical method and many other methods to check heteroscedasticity. For grouped data we can use Cochran's C test and harlley's test. after checking of all this assumption we may fit our desire regression model.
Normality test
A graphical tool for assessing normality is the normal probability plot, a percentile -percentile plot (P-P Plot) of the standardized data against the standard normal distribution. For normal data the points plotted in the P-P plot should fall approximately on a straight line, indicating high positive correlation. For our research perspective, we want to show that our data set are normally distributed. From the above graph, we can see that the data set is going through the origin. So we may conclude that our observe data is normally distributed.
Multicollinearity checking
Multicollinearity refers to the existence of more than or exact linear relationship among some or all explanatory variables of a regression model. We have several techniques for detecting multicollinearity but we are using tolerance and variance inflation factor in our study. If the value of VIF (variance inflation factor) is equal to 3 then we can say that there exists small amount of multicollinearity in the observe data set. If VIF =5 then we can say that very likely to have multicollinearity in the data set and if VIF=10 then we can say that perfect multicollinearity exist in the data set. From the above Table we see that the value of VIF for each independent variables do not exceed 3, so that we may conclude that there is no multicollinearity exist in our observe data set.
Heteroscedasticity checking
Heteroscedasticity is the absence of homoscedasticity. There are several methods to test for the presence of heteroscedasticity. Here we use graphical method to checking heteroscedasticity.
Regression analysis 3.1 Correlation & Correlation matrix
Correlation is any of a broad class of statistical relationship involving dependence, though in common usage it most often refers to how close two variables are to having a linear relationship with each other. A correlation matrix is a The above correlation Table tells us the relationship between CGPA and other variables. Here we contain seven variables and describe the correlation between CGPA and those variables. From the above Table, we describe that the value of correlation coefficient between CGPA and study time is 0.378 which implies that there is a positive association between CGPA and study time holding teacher's lecture, completing syllabus, memorizing, group study, family income and respondent's income constant. We also see that the correlation coefficient between CGPA and teacher's lecture is 0.273 which implies that there is a positive association between CGPA and teacher's lecture holding study time, completing syllabus, memorizing, group study, family income and respondent's income constant.
Similarly the correlation coefficient between CGPA and completing syllabus is 0.434, between CGPA and memorizing is -0.262, between CGPA and group study is 0.210, between CGPA and family income is 0.028 and between CGPA and respondent's income is 0.031. For memorizing variable we obtain negative correlation coefficient but other variables give positive association with CGPA. We also conclude that completing syllabus shows strongest relationship with CGPA rather than other variables. For family income we get the regression coefficient as -0.002 which means that if family income changes one unit the CGPA changes on average-0.002 unit and opposite direction when study time, teacher's lecture, completing syllabus, memorizing, group study and respondent's income remain constant and the 95% confidence interval is -0.019 to 0.015.Finally, on the basis of beta coefficient the model shows that respondent's income causes 60% negative variation in CGPA and t value is insignificant. So we accept null hypothesis which states that there is no relationship between respondent's income and CGPA and also the 95% confidence interval is -0.033 to 0.024.
Regression Model
Regression Model
Conclusion
The purpose of this study was to assess the factors affecting the academic performance of the students at higher education and to suggest possible solutions that may help to promote students' academic performance. With this research we have tried to identify and analyze university related, socio cultural and socio-economic factors that affect students' academic performance. Socio-cultural factors (family background) and socio-economic factors (family income, family expenditure, student's income & expenditure) have no significant effect on the academic performances of the students. Also demographic factors such as age, gender, residence, marital status has no significant effects on students' academic result but we found some factors which have significant effect on academic result of the students of MBSTU. These factors are "study time', 'Respondent's attendance in the class", "Teacher's lecture", "completing syllabus", "capability of memorizing" and "involving group study". There is only one dependent variable which is student's CGPA. If the institution is able to increase the intake level requirements it is possible that more students would perform well.
Figures and tables from the paper
| Model | Collinearity Statistics | — |
|---|---|---|
| Tolerance | VIF | |
| Respondent's spending time on study in a day | .812 | 1.232 |
| Understanding teacher's lecture in the classroom | .888 | 1.126 |
| Properly completing syllabus during examination | .756 | 1.322 |
| Capability of memorizing | .883 | 1.132 |
| involving in group study | .893 | 1.119 |
| Monthly income of respondent family | .972 | 1.029 |
| Respondent's monthly income | .949 | 1.054 |
Table text extracted from the original PDF; superscript letters are shown inline. The original table image is below.
View original table image
| Correlations | — | — | — | — | — | — | — | — | — |
|---|---|---|---|---|---|---|---|---|---|
| CGPA | study time in a day | Understanding teacher's lecture | completing syllabus | Capability of memorizing | group study | Monthly income of respondent family | Respondent's monthly income | ||
| Correlation | study time in a day | .378 | 1.000 | .225 | .364 | -.189 | .194 | .060 | .179 |
| Understanding teacher's lecture | .273 | .225 | 1.000 | .245 | -.213 | .132 | -.030 | -.041 | |
| completing syllabus | .434 | .364 | .245 | 1.000 | -.288 | .304 | .074 | .061 | |
| Capability of memorizing | -.262 | -.189 | -.213 | -.288 | 1.000 | -.124 | -.087 | -.072 | |
| group study | .210 | .194 | .132 | .304 | -.124 | 1.000 | .082 | .029 | |
| Monthly income of respondent family | .028 | .060 | -.030 | .074 | -.087 | .082 | 1.000 | .113 | |
| Respondent's monthly income | .031 | .179 | -.041 | .061 | -.072 | .029 | .113 | 1.000 |
Table text extracted from the original PDF; superscript letters are shown inline. The original table image is below.
View original table image
| Coefficients | — | — | — | — | — | — | — |
|---|---|---|---|---|---|---|---|
| Model | Unstandardized Coefficients | Standardized Coefficients | t | Sig. | 95.0% Confidence Interval for B | ||
| 𝜷 | Std. Error | 𝜷 | Lower Bound | Upper Bound | |||
| (Constant) | 3.227 | .073 | 44.096 | .000 | 3.083 | 3.371 | |
| Spending time on study in a day | .047 | .012 | .224 | 4.064 | .000 | .024 | .069 |
| Understanding teacher's lecture | .081 | .035 | .122 | 2.308 | .022 | .012 | .151 |
| Completing syllabus during examination | .158 | .033 | .276 | 4.828 | .000 | .093 | .222 |
| Capability of memorizing | -.040 | .019 | -.111 | -2.096 | 0.037 | -.077 | -.002 |
| group study | .031 | .030 | .054 | 1.033 | .025 | -.028 | .089 |
| Monthly income of family | -.002 | .009 | -.013 | -.267 | .790 | -.019 | .015 |
| Respondent's monthly income | -0.60 | .007 | -.029 | -.573 | .567 | -.033 | .024 |
Table text extracted from the original PDF; superscript letters are shown inline. The original table image is below.
View original table image
References
23 in the original paper- Ballatine JH. The sociology of education: A systematic analysis. Englewood Cliffs: Prentice Hall, 1993.
- Barnard WM. Parent involvement in elementary school and educational attainment. Children and Youth Services Review. 2004; 26:39-62.
- Battle J, Lewis M. The increasing significance of class: The relative effects of race and socioeconomic status on academic achievement. Journal of Poverty. 2002; 6(2):21-35.
- Blevins BM. Effects of socioeconomic status on academic performance in Missouri public schools, 2009. Retrieved from http://gradworks.umi.com/3372318.pdf
- Caldas SJ, Bankston CL. The effect of school population socioeconomic status on individual student academic achievement. Journal of Educational Research. 1997; 90:269-277.
- Capraro MM, Capraro RM, Wiggins BB. An investigation of the effect of gender, socioeconomic status, race and grades on standardized test scores. Paper presented at the meeting of the Southwest Educational Research Association, Dallas, TX, 2000.
- Ceballo R, McLoyd V, Toyokawa T. The influence of neighborhood quality on adolescents educational values and school efforts. Journal of Adolescent Research. 2004; 19(6):716-739.
- Chambers EA, Schreiber JB. Girls academic achievement: Varying associations of extracurricular activities. Gender and Education. 2004; 16(3):327-346.
- Crosnoe R, Johnson MK, Elder GH. School size and the interpersonal side of education: An examination of race/ethnicity and organizational context. Social Science Quarterly. 2004; 85(5):1259-1274.
- Duke N. For the rich it's richer: Print environments and experiences offered to first-grade students in very lowand very high-SES school districts. American Educational Research Journal. 2000; 37(2):456-457.
- Eitle TM. Do gender and race matter? Explaining the relationship between sports participation and achievement. Sociological Spectrum. 2005; 25(2):177195.
- Fantuzzo J, Tighe E. A family involvement questionnaire. Journal of Educational Psychology. 2000; 92(2):367-376.
- Furstenberg FF, Hughes ME. Social capital and successful development among at-risk youth. Journal of Marriage and the Family. 1995; 57:580-592.
- Goddard RD. Relational networks, social trust, and norms: A social capital perspective on students' chances of academic success. Educational Evaluations & Policy Analysis. 2003; 25:59-74.
- Hanes B. The exploration of socioeconomic status and student achievement at Beverly elementary school. Un published thesis. Marietta College, 2008.
- Henderson AT. Good news: An ecologically balanced approach to academic improvement. Educational Horizons. 1988; 66(2):60-67.
- Jeynes WH. Examining the effects of parental absence on the academic achievement of adolescents: The challenge of controlling for family income. Journal of Family and Economic. 2002; 23(2):56-65.
- Krashen S. The hard work hypothesis: Is doing your homework enough to overcome the effects of poverty? Multicultural Education. 2005; 12(4):16-19.
- Lopez OS. The effect of the relationship between classroom student diversity and teacher capacity on student performance: Conclusions and recommendations for educational policy and practice. Austin, TX: The Strategic Management of the Classroom Learning Enterprise Research Series, 1995.
- Ma X, Klinger DA. Hierarchical linear modeling of student and school effects on academic achievement. Canadian Journal of Education. 2000; 25(1):41-55.
- Mann M. Macmilan students encyclopedia of sociology. England: Anchor Brendon Ltd, 1985.
- Marzano RJ. What works in schools: Translating research into action? 2003. Retrieved from http://pdonline.ascd.org/pd_online/whatworks/marzano20 03_ch13.html
- McCoy LP. Effect of demographic and personal variables on achievement in eighth grade algebra. Journal of Educational Research. 2005; 98(3):131-135.
Cited by 1
From OpenAlex, OpenCitations and reference lists read by Scinovex
- Factors Affecting Students’ Academic Performance Mediated by their Motivation for Learning ↗
Siddiky, Md. Roknuzzaman, Haque, Israt Eshita · Asian Journal of University Education · 2024
The study was intended to identify the factors that affect students' academic performance mediated by their motivation for learning.The study employed a cross-sectional survey where primary data were collected from a total of 206 samples randomly drawn from 5505 undergraduate students of a public university in Bangladesh.Both descriptive and inferential statistics were used to analyze data.The study confirmed that there…
❝ 7PDF