
Research article · 2018 · Full text
International Journal of Statistics and Applied MathematicsApplication of Queueing theory to Salem railway ticket counters
Volume 3(3) · Pages 203–207
Research areasAdvanced Queuing Theory AnalysisUrban Transport Systems AnalysisIoT and GPS-based Vehicle Safety Systems
Abstract
Author-writtenIn this paper the Queueing model (M/M/C: /FIFO) is applied to the ticket counters of the Salem railway station. In this research the various characters of that queueing model have been analyzed and concluded.
Summary
Source-checkedPlain-language reading of the full paper, prepared with AI and checked against the text. Each point links to the authors' own words.
Why it matters
- Queues form at service facilities when the system lacks the capacity to serve all arriving customers simultaneously. View evidence ↗
The question
- The study aims to apply a specific queueing model to the Salem railway station reservation centre in Tamil Nadu, India, to determine its operational characteristics. View evidence ↗
What they did
- The study utilized a multi-server queueing model (M/M/C: ∞/FIFO), assuming Poisson arrivals, exponential service rates, three servers, and a first-in-first-out discipline. View evidence ↗
What they found
- The average arrival rate of customers to the system was approximately 24 per hour. View evidence ↗
- The average departure rate from the system was approximately 26 per hour, with an individual service rate of 6.5000 per hour. View evidence ↗
- The probability that a customer enters service immediately without waiting is 0.1644. View evidence ↗
What it means
- The authors conclude that employing four reservation clerks is optimal; adding another would significantly increase idle time, while removing one would lead to rapid queue growth and chaos. View evidence ↗
- The system is considered stable because the traffic intensity remains less than one. View evidence ↗
Visual summary
2 visualsIllustrations explain the paper; charts are replotted from the paper's own table values.
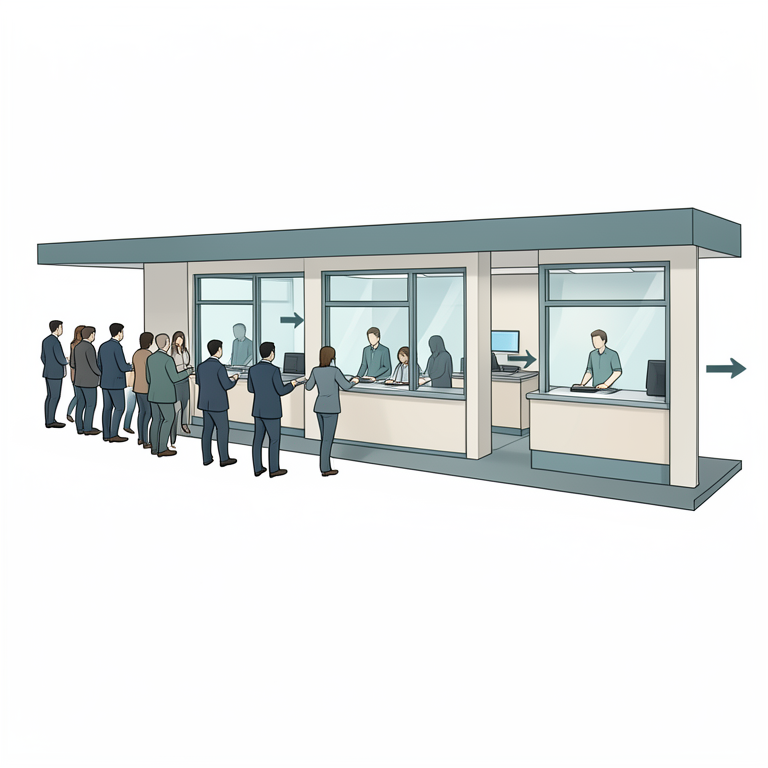
Queueing System Flow
AI-generated conceptual illustration (Railway ticket counters). It explains the idea and does not show study data.
View source evidence ↗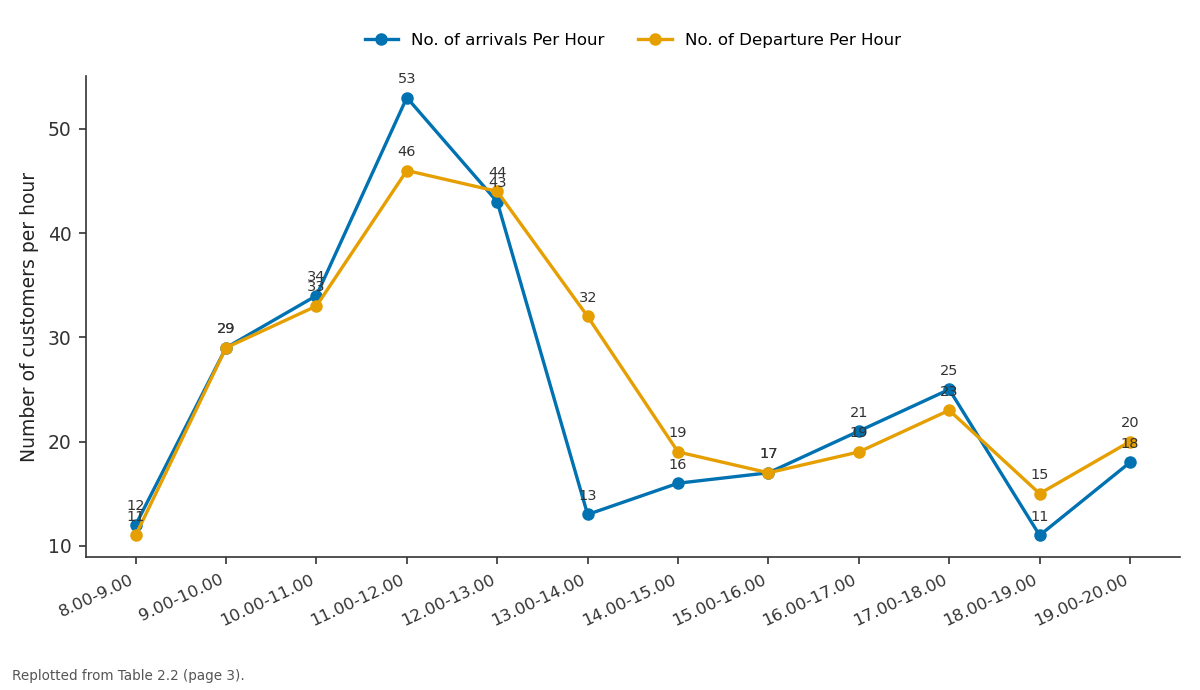
No. of arrivals Per Hour and No. of Departure Per Hour: 8.00-9.00 vs 9.00-10.00 vs 10.00-11.00 vs 11.00-12.00 vs 12.00-13.00
Replotted from Table 2 (page 3) of the original paper. Every bar is the paper's own table value.
View source evidence ↗Figures & tables
From the original paper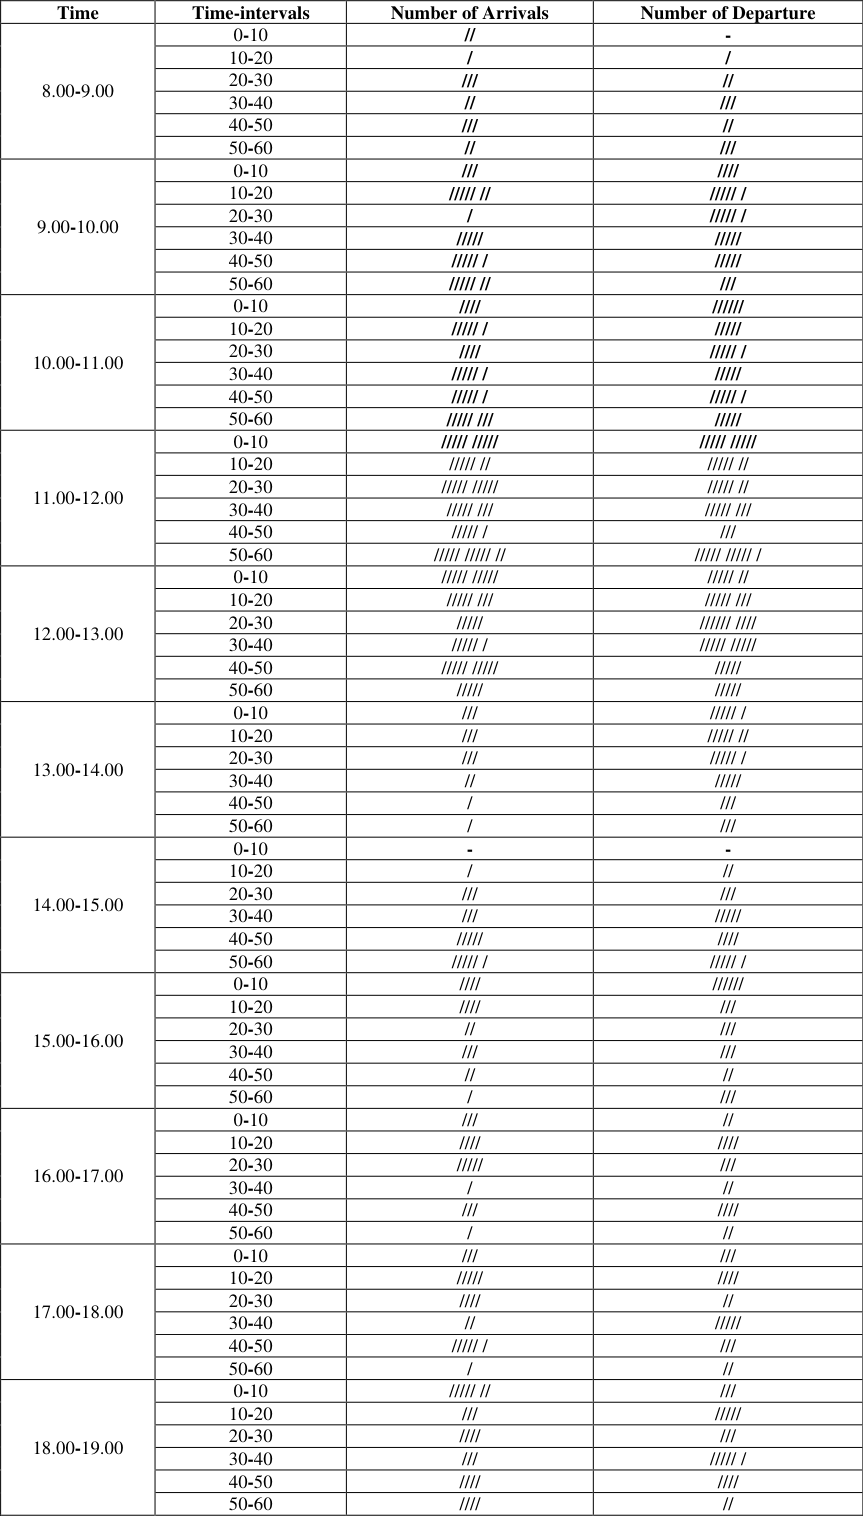 Table 2
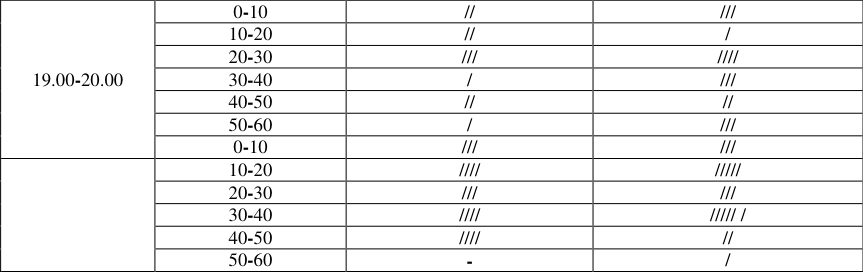 Table 2
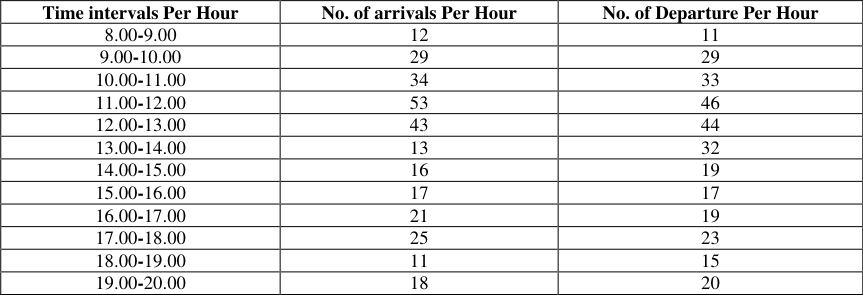 Table 2
 Table 3
Introduction
A flow of customers from infinite or finite population towards the service facility forms a queue on account of lack of capability to serve them all at a time. Our main objectives of our research are i. To apply the basic concepts of the selected queueing model to the Salem railway station, Tamil Nadu, India. ii. To determine the various characteristics of the selected queueing model to the queueing system in the railway reservation centre at Salem Railway station.
Data Collection
We have visited the railway reservation counters at Salem railway Station on various days during 8.00am to 8pm and conducted a survey about the arrivals of customers to the reservation counters and about the service rendered to the customers. The data pertaining to the arrival and Departures of customers to the reservation counters of Salem railway station are given in this section.
The customers arrive at the railway reservation counters under poisson process and the service is done to the customers in the exponential rate. This queueing model involves three servers.
Evaluation of the Characteristics
From the above table, 1. Average number of arrivals to the system per hour (𝜆) =
Observations, Summary 5.1 Observations
In our study we have made the following observations the following results. i. Traffic intensity, 𝜌 = 0.9231 ii. Probability that there are no customers in the system, 𝑃 0 = 0.0083 iii. Probability that an arrival has to wait, p (n≥c) = 0.8356 iv. Probability that an arrival enters the service without wait 1-p (n≥c) = 0.1644 v.
Summary
After conducting the survey and the analysis of data obtained from the reservation centre of salem railway station the following predictions are made regarding the characteristics of the queueing made 1 (M/M/C: ∞/FIFO):
i. An average of 24 customers are arriving to the reservation counters in an hour.
ii. An average of 26 customers are being served in the counters in an hour.
iii. The traffic intensity p= 𝜆 𝑐µ =3.6923<1 and therefore the queueing system followed in the salem railway reservation centre attains stability. iv. The probability that all the servers bring idle is nearly 2 percent. v. The probability that an arrival has to wait before getting served is 86 percent. vi. The probability that an arrival enters the service straight away without having to wait is 14 percent. vii. At any time an average of 10 customers are found waiting in the queue. viii. At any time an average of 13 customers are found waiting in the system. ix. On arrival, a customer has to wait in the queue for 25 minutes before getting served.
x. On arrival, a customer has to wait in the system for 34minutes before getting served. xi. A reservation clerk takes an average of 7 minutes to reserve a ticket.
Conclusion
In our study we have found that it is optional that there are four reservation clerks employed in the salem railway reservation. It means that if we add one more counter to the existing set up, the chance for a reservation clerk to be idle would increase enormously. And also, if one counter is removed from the existing set up, the number of customers waiting in the queue would increase rapidly, thus it would end up in chaos. Also we have analyzed that the traffic intensity of the queueing system prevailing in salem railway station always remains less then unity and therefore the system attains stability.
References
1. Kanti Swarup PK, Gupta manmohan. Operations research Sultan & Sons, New Delhi, 1995. 2. Gupta Manmohan PK. Operations Research and Statistical Analysis, Sultan & Son, New Delhi, 1991. 3. Hamdy Taha A. Operations research. Macmillan publishing Company, New York, 1987.
Figures and tables from the paper
| Time | Time-intervals | Number of Arrivals | Number of Departure |
|---|---|---|---|
| 8.00-9.00 | 0-10 | // | - |
| 10-20 | / | / | |
| 20-30 | /// | // | |
| 30-40 | // | /// | |
| 40-50 | /// | // | |
| 50-60 | // | /// | |
| 9.00-10.00 | 0-10 | /// | //// |
| 10-20 | ///// // | ///// / | |
| 20-30 | / | ///// / | |
| 30-40 | ///// | ///// | |
| 40-50 | ///// / | ///// | |
| 50-60 | ///// // | /// | |
| 10.00-11.00 | 0-10 | //// | ////// |
| 10-20 | ///// / | ///// | |
| 20-30 | //// | ///// / | |
| 30-40 | ///// / | ///// | |
| 40-50 | ///// / | ///// / | |
| 50-60 | ///// /// | ///// | |
| 11.00-12.00 | 0-10 | ///// ///// | ///// ///// |
| 10-20 | ///// // | ///// // | |
| 20-30 | ///// ///// | ///// // | |
| 30-40 | ///// /// | ///// /// | |
| 40-50 | ///// / | /// | |
| 50-60 | ///// ///// // | ///// ///// / | |
| 12.00-13.00 | 0-10 | ///// ///// | ///// // |
| 10-20 | ///// /// | ///// /// | |
| 20-30 | ///// | ////// //// | |
| 30-40 | ///// / | ///// ///// | |
| 40-50 | ///// ///// | ///// | |
| 50-60 | ///// | ///// | |
| 13.00-14.00 | 0-10 | /// | ///// / |
| 10-20 | /// | ///// // | |
| 20-30 | /// | ///// / | |
| 30-40 | // | ///// | |
| 40-50 | / | /// | |
| 50-60 | / | /// | |
| 14.00-15.00 | 0-10 | - | - |
| 10-20 | / | // | |
| 20-30 | /// | /// | |
| 30-40 | /// | ///// | |
| 40-50 | ///// | //// | |
| 50-60 | ///// / | ///// / | |
| 15.00-16.00 | 0-10 | //// | ////// |
| 10-20 | //// | /// | |
| 20-30 | // | /// | |
| 30-40 | /// | /// | |
| 40-50 | // | // | |
| 50-60 | / | /// | |
| 16.00-17.00 | 0-10 | /// | // |
| 10-20 | //// | //// | |
| 20-30 | ///// | /// | |
| 30-40 | / | // | |
| 40-50 | /// | //// | |
| 50-60 | / | // | |
| 17.00-18.00 | 0-10 | /// | /// |
| 10-20 | ///// | //// | |
| 20-30 | //// | // | |
| 30-40 | // | ///// | |
| 40-50 | ///// / | /// | |
| 50-60 | / | // | |
| 18.00-19.00 | 0-10 | ///// // | /// |
| 10-20 | /// | ///// | |
| 20-30 | //// | /// | |
| 30-40 | /// | ///// / | |
| 40-50 | //// | //// | |
| 50-60 | //// | // |
Table text extracted from the original PDF; superscript letters are shown inline. The original table image is below.
View original table image
| 19.00-20.00 | 0-10 | // | /// |
|---|---|---|---|
| 10-20 | // | / | |
| 20-30 | /// | //// | |
| 30-40 | / | /// | |
| 40-50 | // | // | |
| 50-60 | / | /// | |
| 0-10 | /// | /// | |
| 10-20 | //// | ///// | |
| 20-30 | /// | /// | |
| 30-40 | //// | ///// / | |
| 40-50 | //// | // | |
| 50-60 | - | / |
Table text extracted from the original PDF; superscript letters are shown inline. The original table image is below.
View original table image
| Time intervals Per Hour | No. of arrivals Per Hour | No. of Departure Per Hour |
|---|---|---|
| 8.00-9.00 | 12 | 11 |
| 9.00-10.00 | 29 | 29 |
| 10.00-11.00 | 34 | 33 |
| 11.00-12.00 | 53 | 46 |
| 12.00-13.00 | 43 | 44 |
| 13.00-14.00 | 13 | 32 |
| 14.00-15.00 | 16 | 19 |
| 15.00-16.00 | 17 | 17 |
| 16.00-17.00 | 21 | 19 |
| 17.00-18.00 | 25 | 23 |
| 18.00-19.00 | 11 | 15 |
| 19.00-20.00 | 18 | 20 |
Table text extracted from the original PDF; superscript letters are shown inline. The original table image is below.
View original table image
References
0 in the original paperCited by 3
From OpenAlex, OpenCitations and reference lists read by Scinovex
- Analysis and Optimization of Addis Ababa Light Railway Ticketing Window ↗
Tamene Taye Worku, Yeserah Gebeyehu Asegie · Urban and Regional Planning · 2023
The main feature of Addis Ababa's light railway (AALR) ticketing window is either congestion or underutilized 106 – 137 and 12 - 18 percent respectively. That is why the study set the main objective to analyze and optimize AALR ticketing windows. So, the researcher first studied the problem for the specified ticketing windows. Secondly, establish and analyze the performance of…
❝ 4PDF - Assessment on the Current and Future Performance of Addis Ababa Light Rail Transit Service Using Mathematical Modeling ↗
Getu Debebe, Belachew Asteray Demiss · Advances in Civil Engineering · 2022
Congestion and extended passenger waiting time are some of the key issues that the Addis Ababa Light Railway Transit service (AALRT) faces. Passengers waited an average of 14.33 minutes, resulting in congestion of passengers. This is why the study set the main objective to develop an optimization model for improving AALRT service. The study began by developing the characteristics of…
❝ 4PDF - Improving Addis Ababa light railway transit using a combined Monte Carlo simulation and queuing theory model: Data and model dual-driven approach ↗
Tamene Taye Worku, Abraham Assefa Tsehayae · African Transport Studies · 2025
❝ 0