
Research article · 2018 · Full text
International Journal of Statistics and Applied MathematicsPerformance evaluation of stochastic model on automatic teller machines considering major/minor faults
Volume 3(1) · Pages 377–383
Research areasSoftware Reliability and Analysis ResearchAdvanced Queuing Theory AnalysisReliability and Maintenance Optimization
Abstract
Author-writtenThe paper considers a reliability model for Automated Teller Machines (ATM) that may have faults in hardware/software components. In the ATM, hardware and software components may have minor or major fault(s) and the occurrence of a minor fault leads to degradation state whereas a major fault leads to failure of the system. Whenever the ATM fails or goes under degradation state then the service engineer first inspect whether there is fault in the hardware or software component then recovery of the relevant component is done. Using Markov processes and regenerative point technique various measures of system performance are obtained. Using these measures the profit analysis of the system is carried out. Various conclusions about reliability and cost of the system are made on the basis of the graphical studies
Summary
Source-checkedPlain-language reading of the full paper, prepared with AI and checked against the text. Each point links to the authors' own words.
Why it matters
- Automated Teller Machines (ATMs) are critical self-service terminals used to provide retail banking services. View evidence ↗
- ATMs are susceptible to various faults that can either cause the system to fail completely or lead to a state of degradation. View evidence ↗
- Because ATMs serve as the primary interface between customers and banks, analyzing their reliability and associated costs is essential for banking systems. View evidence ↗
The question
- The study aims to fill a research gap by performing a profit analysis of ATMs that specifically accounts for both major and minor hardware and software faults. View evidence ↗
What they did
- The model assumes that major faults result in total system failure, while minor faults lead to a degraded state of performance. View evidence ↗
- The researchers used Markov processes and the regenerative point technique to calculate performance metrics, including Mean Time to System Failure (MTSF), expected uptime, and expected degradation time. View evidence ↗
- Profit is calculated by subtracting the costs of degradation, inspection, repair, and installation from the revenue generated during system uptime. View evidence ↗
What they found
- Mean Time to System Failure (MTSF) decreases as the rate of major faults increases and is lower when there is a higher probability of minor software faults. View evidence ↗
- Expected uptime decreases as the rate of major faults increases and is further reduced by a higher probability of major hardware faults. View evidence ↗
- Expected degradation time increases with both a higher rate of minor faults and a higher probability of minor hardware faults. View evidence ↗
- System profit decreases as the rates of both minor and major faults increase. View evidence ↗
- At a major fault rate (λ1) of 0.001, the system remains profitable only if the minor fault rate (λ2) is 0.581 or less. View evidence ↗
- Profit increases as the revenue per unit of uptime increases, though it remains lower when the rate of major faults is higher. View evidence ↗
- With a major fault rate (λ1) of 0.001, the system is profitable only when the revenue per unit uptime (C0) is 514.87 or higher. View evidence ↗
What it means
- The authors conclude that system profit is positively driven by uptime revenue and negatively impacted by the frequency of both major and minor faults. View evidence ↗
Visual summary
1 visualsIllustrations explain the paper; they do not show study data.
ATM Fault State Flow
AI-generated conceptual illustration (automatic teller machine (ATM)). It explains the idea and does not show study data.
View source evidence ↗Figures & tables
From the original paper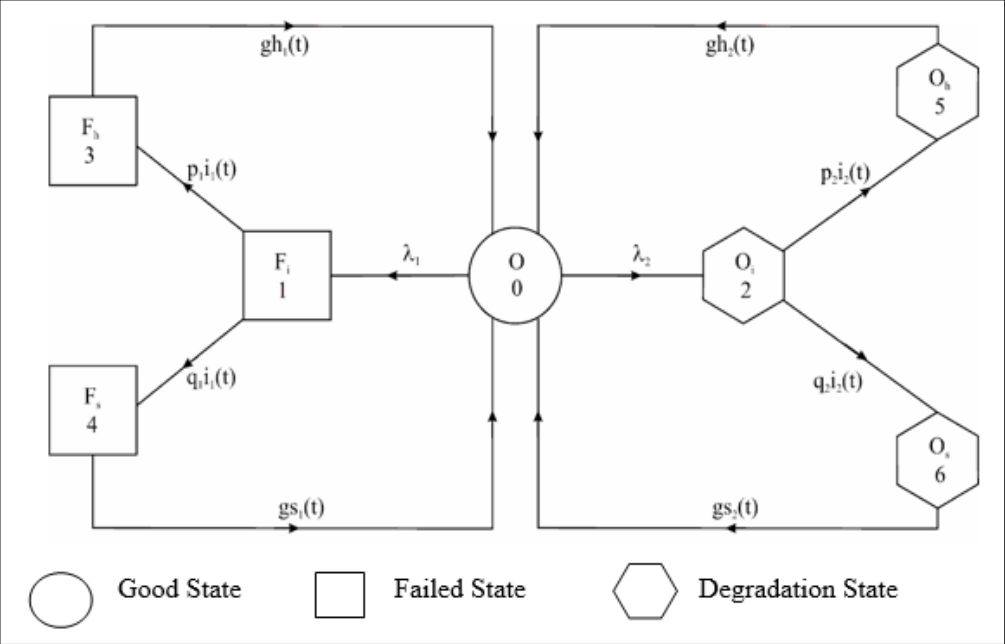 Figure 1
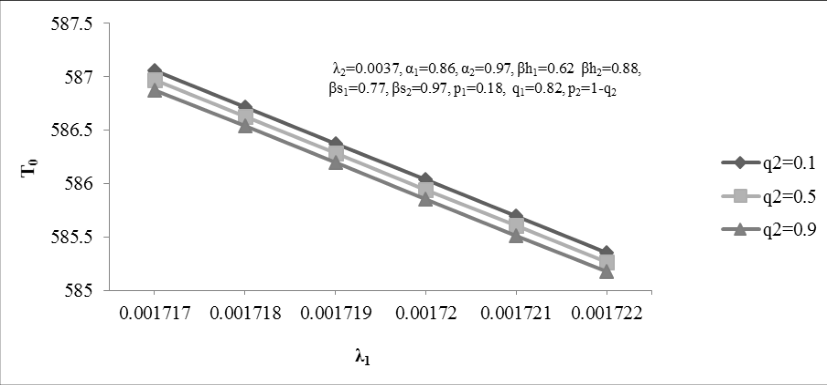 Figure 2
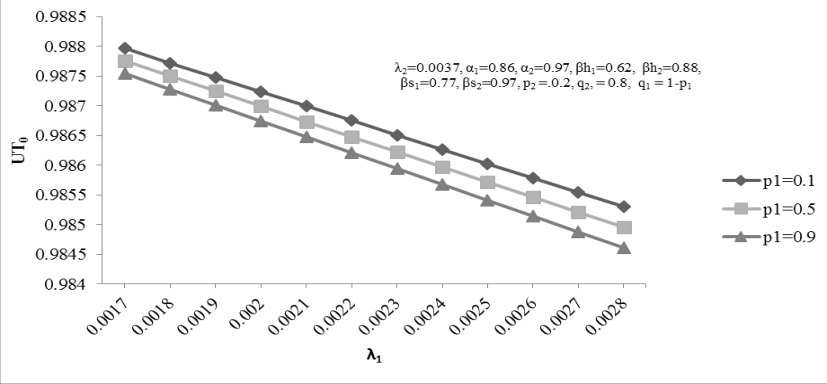 Figure 3
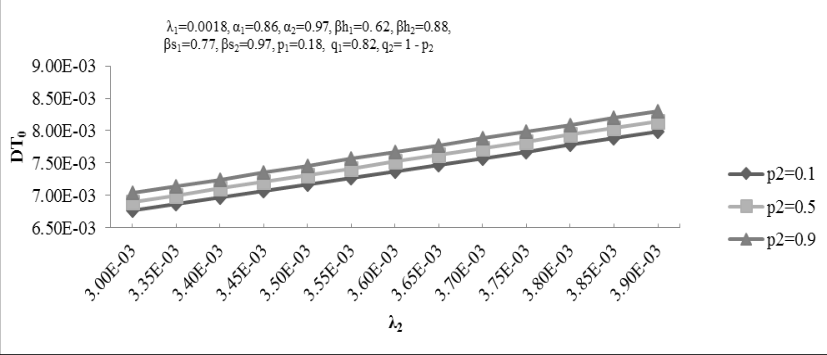 Figure 4
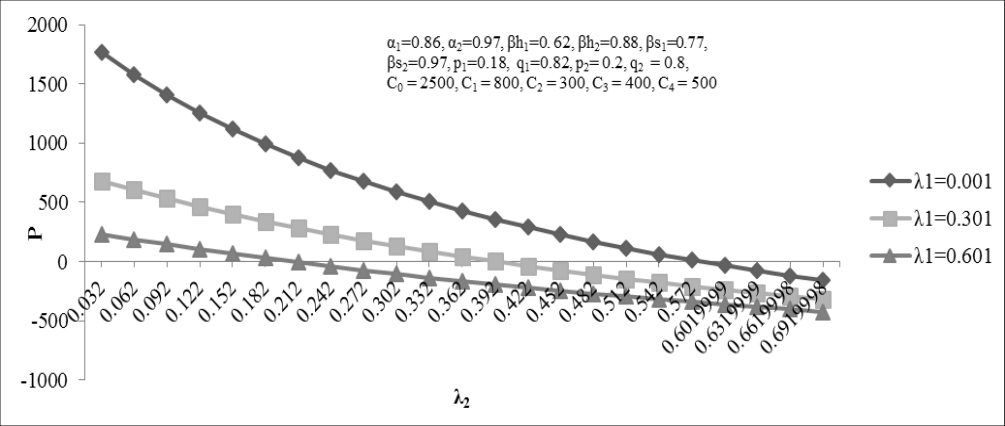 Figure 5
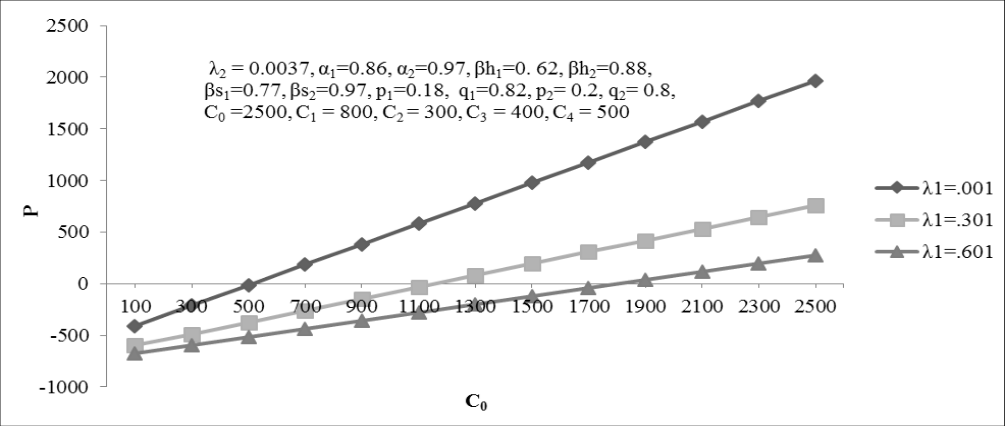 Figure 6
Introduction
Automated-Teller Machine (ATM) has been one of the best options for self service terminal in catering retail banking services. Each ATM is connected to a host computer, which is fitted inside the machine itself. This computer is connected to the central bank server also known as the ATM Switch, which resides at the bank level. The central server is the main brain behind the ATM and gives it instructions to perform various functions, including dispensation of cash. All the screen instructions in an ATM are sent from the central server. When a customer puts in a card, the card reader reads it and asks for the PIN and once the PIN is keyed in, it goes to the central server, which authenticates it and asks what the customer wants to perform through ATM. Once the withdrawal option is selected, the machine asks for the amount to be withdrawn. After the amount is entered, the server picks it up and sends it to the bank host, which could either be the same bank to which the ATM belongs or an even an outside bank, where the customer's account details are held. The central server then checks the balance, debits the account for that amount and then sends instructions to the ATM to dispense the cash. If the card is from the same bank, it is known as an "on-us" transaction and, when the card has been issued by a different bank, it is known as an "off-us" transaction. In an off-us transaction, the ATM switch recognizes the card as being from another bank and sends the information and request to the National Payments Corporation of India (NPCI), whichredirects the request to the respective bank (the outside bank host), which authenticates the request and issues instructions which are sent back to the ATM. An ATM is the most important part of modern banking system consisting of both hardware and software components. The system can have different kinds of faults that may leads to complete failure/ degradation of the system. When an ATM encounter failures, either due to hardware or software, the machine may not provide its service continuously to its subscribers. In case of occurrence of major fault, there is complete failure of system whereas in case of minor fault system performance and capacity may decrease. ATM supports the customer interface connection with banks so the reliability and cost of ATM plays a very significant role in banking systems and hence need to be analyzed.
Many researchers in the field of reliability modeling including Tuteja et al (1991) [15] , Welke et al (1995) [16] , Rizwan and Taneja (2000) [10] , Taneja et al (2004) [14] , Kumar and Bhatia (2011) [6] , Kumar and Batra (2013) [7] , Kumar and Kapoor (2014) [9] , analyzed a large number of systems considering various aspects of Reliability. Batra (2010) [1] studied operational readiness of a computerized banking system. Sagar et al (2011) [2] presents design concept, security analysis for customer satisfaction, performance ability, and software reliability of ATM system. Bing et al (2011) [3] studied hardware error likelihood induced by the operation of software. Gupta et al (2015) [13] presents an overview of results related to the operational behavior of automatic teller system with respect to reliability analysis. Saini (2015) [12] performs costbenefit analysis of two identical cold standby systems, subject to failure of airlines reservations system and failure of banking services caused by failure of internet connectivity. Iberahim et al (2016) [5] investigates the relationship between the reliability and responsiveness of ATM services with customer satisfaction and verify the determinants for service enhancement. However, none of the researcher has carried out the profit analysis of ATM considering major/ minor hardware and software faults. While analyzing the working of ATM, it was observed that there are two types of faults one is major and another is minor. So, keeping this practical situation in view, in the paper, one unit ATM is analyzed by considering the aspect of two types of faults. It is assumed that the occurrence of a minor fault leads to degradation state whereas the occurrence of a major fault leads to failure of the system. Whenever major or minor fault is detected, the service engineer inspects whether there is fault in the hardware or software component then he will repair the relevant component. Using Markov processes and regenerative point technique various measures of system performance such as MTSF/Expected uptime and Expected degradation time of the system are obtained. Using these measures profit analysis of the system is carried out. Various conclusions about reliability and cost of the system is made on the basis of graphical studies.
Other Assumptions
1. A minor or major fault may be in some hardware or software components. Hardware and Software faults are dealt separately by a team of service engineers. 2. The service engineers immediately handle all types of faults at ATM site. 3. Rate of occurrence of major and minor faults are constant whereas repair and inspection time distributions are arbitrary. 4. After each repair the system is as good as new. 5. Switching is perfect and instantaneous. 6. All random variables are mutually independent. 7. The service engineer takes negligible time to reach the site. q (t) e The mean sojourn time (µi) in the regenerative state i is defined as the time of stay in that state before transition to any other state. If T denotes the sojourn time in regenerative state i, then
Notations
The unconditional mean time taken by the system to transit for any regenerative state j, when it is counted from epoch of entrance into that state i, is mathematically stated as mij = t qij(t)dt Thus,
Other Measures of System Performance
Using probabilistic arguments for regenerative processes, various recursive relations are obtained and are solved to derive following important measures of the system performance in
Profit Analysis
The expected profit of the system is
Where C0 = revenue per unit uptime of the system C1= cost per unit degradation time of the system C2 = cost per unit time of inspection C3 = cost per unit time of repair C4 = cost of installation of the system
Graphical interpretation
For graphical analysis following particular cases are considered: Various graphs for measures of system performance viz. MTSF, expected uptime, expected degradation time and profit are plotted for different values of rates of major/minor faults, probabilities of major/minor hardware and software faults (p1, q1, p2, q2), inspection rates (α1,α2), hardware/ software repair rates The graph in fig. 5 shows the pattern of profit with respect to the rates of occurrence of minor faults (λ2) for different values of rate of major faults (λ1). The curve in the graph indicates that the profit of the system decreases with the increase in the values of the rates of occurrence of minor fault and has lower values for higher values of rate of major faults. Further from the graph it may also be noticed that for λ1 = 0.001 the profit is > or = or < 0 according as λ2 is < or = or > 0.581. Hence the system is profitable to the company whenever λ2 ≤ 0.581. Similarly, for λ1 = 0.301 and λ1 = 0.601, the profit is > or = or < 0 according as λ2 is < or = or > 0.394 and 0.206 respectively. Hence in these cases the system is profitable to the company whenever λ2 ≤ 0.394 and 0.206 respectively. The graph in fig. 6 represents the pattern of profit with respect to the revenue per unit uptime of the system (C0) for different values of rate of major faults (λ1). The curve in the graph indicates that the profit of the system increases with the increase in the values of the revenue per unit up time of the system and has lower values for higher values of rate of major faults. Further from the graph it may also be noticed that for λ1 = 0.001 the profit is < or = or > 0 according as C0 is < or = or > 514.87. Hence the system is profitable to the company whenever C0 ≥ 514.87. Similarly, for λ1 = 0.301 and λ1 = 0.601, the profit is < or = or > 0 according as C0 is < or = or > 1159.86 and 1804.85 respectively. Hence in these cases the system is profitable to the company whenever C0 ≥ 1159.86 and 1804.85 respectively.
Conclusion
From the graphs it is concluded that the mean time to system failure (MTSF) and expected uptime of the BTS deceases with the increase in the values of the rates of occurrence of major as well as minor faults. Further it is observed that the MTSF decreases with the increase in the probability of occurrence of minor software faults. The expected uptime of the BTS decreases with the increase in the values of probability of major hardware faults. Expected degradation time increases with increase in the values of rate of minor faults as well as with probability of minor hardware faults. It is also clear that the profit increases with increase in the values of revenue per unit uptime of the system but decreases with increase in the values of rates of occurrence of major and minor faults. For fixed values of rate of occurrence of major faults various cutoff points for revenue per unit uptime and rate of occurrence of minor faults are also obtained.
Figures and tables from the paper
References
16 in the original paper- Batra CM. Operational readiness of a computerized banking system", Bulletin of Pure and Applied Sciences. 2010; 30:66-74.
- Bharat Bhushan Sagar, Gurmit Singh, Saket RK. Design concept and network reliability evaluation of ATM system", Int. J. of Computer Aided Engineering and Technology. 2011; 3(1):53-76.
- Bing H, Rodriguez M, Ming L, Bernstein JB, Smidts CS. Hardware error likelihood induced by the operation of software", IEEE transactions on Reliability. 2011; 60(3):622-639.
- Hammer R, Michael W. Traffic congestion patterns, Proceedings of pattern languages of programming conference, 1999, 115.
- Iberahim H, Mohd Taufik NK, Mohd Adzmir AS, Saharuddin H. Customer Satisfaction on Reliability and Responsiveness of Self Service Technology for Retail Banking Services, Procedia Economics and Finance, 2016; 37:13-20.
- Kumar R, Bhatia P. Reliability and cost analysis of one unit centrifuge system single repairman and inspection", Pure and Applied Mathematika Sciences. 2011; 74(1, 2):113-121.
- Kumar R, Batra S. Cost benefit analysis of a reliability model on printed circuit boards manufacturing system", International Journal of Advances in Science and Technology. 2013; 6(4):56-64.
- Kumar R, Kumar M. Performance and cost-benefit analysis of a hardware-software system considering hardware based software interaction failures and different types of recovery", International Journal of computer applications. 2012; 53(17):25-32.
- Kumar R, Kapoor S. Reliability and performance analysis of a base transceiver system considering software based hardware and common cause failures, International Journal of Statistika and Mathematika. 2014; 11(1):29-43.
- Rizwan SM, Taneja G. Profit analysis of system with perfect repair at partial failure or complete failure", Pure Applied Mathematika Sciences. 2000; LII(1, 2):7-14.
- Saket RK, Bharat Bhushan Sagar, Gurmit Singh. ATM reliability and risk assessment issues based on fraud, security and safety, International Journal of Computer Aided Engineering and Technology. 2012; 4(3):272-293.
- Saini AK. Cost-Benefit Analysis of Two Identical Cold Standby System subject to failure of Airlines reservations system and failure of banking services caused by failure of internet connectivity, International Journal of Recent Advances in Engineering & Technology. 2015; 3(6):2347-2812.
- Sonendra Kumar Gupta, Dr. Rekha Choudhari, Dr. Brijesh Kumar Sinha. Mathematical Modeling of Behavior of Automatic Teller Machine with Respect to Reliability Analysis" International Journal of Mathematics Trends and Technology. 2015; 26(1):29-34.
- Taneja G, Tayagi VK, Bhardwaj. Profit analysis of single unit programmable logic controller", Pure and Applied Mathematica Sciences. 2004; LX(1-2):55-71.
- Tuteja RK, Arora RT, Taneja G. Stochastic behavior of a two unit system with two types of repairman and subject to random inspection Microelectronics Reliability. 1991; 311:79-83.
- Welke SR, Johnson BW, Aylor JH. Reliability modeling of hardware/software systems", IEEE Trans of Reliability. 1995; 44(3):413-418.
Cited by 1
From OpenAlex, OpenCitations and reference lists read by Scinovex
- Cost benefit analysis of a stochastic model on automated teller machines considering hardware, software, and networking issues
Sunny Kapoor, Pooja Nagpal, Sangeeta Malik · International Journal of Statistics and Applied Mathematics · 2026
This study proposes a stochastic model for Automated Teller Machines (ATM) that includes a number of different software and hardware elements. During operation, an Automated Teller Machine (ATM) can operate in three different modes: active, deterioration, and failure. There could be a variety of major and minor issues in the hardware and software components. A minor fault causes a partial failure, whereas a major fault and networking problems cause the system to fail completely. The bank staff or security people undertake the first level basic maintenance on the ATM whenever it enters a state