
Research article · 2018 · Full text
International Journal of Statistics and Applied MathematicsA reliability analysis of 8hp-pml gold engine coupled locally fabricated cassava grinding machine
Volume 3(6) · Pages 28–35
Research areasManagement and Optimization TechniquesReliability and Maintenance Optimization
Abstract
Author-writtenThis work models the failure rate of an 8HP-PML Gold Engine coupled locally fabricated cassava grinding machine whose operational efficiency degrades with time and usage to obtain its performance measures. The failure distribution of the machine was shown to follow a Weibull distribution with shape parameter, and scale parameter, . Some probability functions of the machine such as the failure density function, failure distribution function, the reliability function and the hazard function were obtained. Also, reliability indices obtained for the machine shows that the cassava grinding machine is in a good and sustainable working condition. These include; the mean time to repair (MTTR=99 hours), the mean time between failure (MTBF = 4190 hours) and the availability factor, A = 97.7% while the maintainability factor is M=2.3%.
Summary
Source-checkedPlain-language reading of the full paper, prepared with AI and checked against the text. Each point links to the authors' own words.
Why it matters
- Reliability is a critical characteristic for industrial systems, defined as the probability that a system remains functional over a specific time period in a given environment. View evidence ↗
- Cassava grinding machines experience a non-constant failure rate because their operational efficiency degrades as they wear down over time and usage. View evidence ↗
- Repairable systems are those that can be returned to their original working state through maintenance after a failure occurs. View evidence ↗
The question
- The study aims to determine the reliability function and performance measures of a repairable cassava grinding machine to better inform maintenance schedules and prevent wastage. View evidence ↗
What they did
- The research focused on a locally fabricated cassava grinding machine coupled with an 8HP-PML Gold Engine. View evidence ↗
- A chi-square goodness-of-fit test was employed to verify if the machine's failure data followed a Weibull distribution. View evidence ↗
- The parameters for the Weibull distribution were estimated using the Method of Least Squares. View evidence ↗
- The analysis was based on a total of 30 observed failure frequencies. View evidence ↗
What they found
- The mean time to repair (MTTR) was 99.2 hours, indicating that repairs typically take about 4 days on average. View evidence ↗
- The machine demonstrated an availability factor of 97.7%, meaning it is in a working state for the vast majority of its time. View evidence ↗
- The failure rate decreased from 0.00054 to 0.00024 during the first 3000 hours and remained constant at 0.0002 between 4000 and 8000 hours. View evidence ↗
- Reliability dropped gradually from 0.98 to 0.3 over the first 4000 hours, followed by a rapid decrease between 4000 and 8000 hours. View evidence ↗
What it means
- Based on the calculated reliability indices, the authors conclude that the cassava grinding machine is in a sustainable and good working condition. View evidence ↗
Visual summary
1 visualsIllustrations explain the paper; they do not show study data.
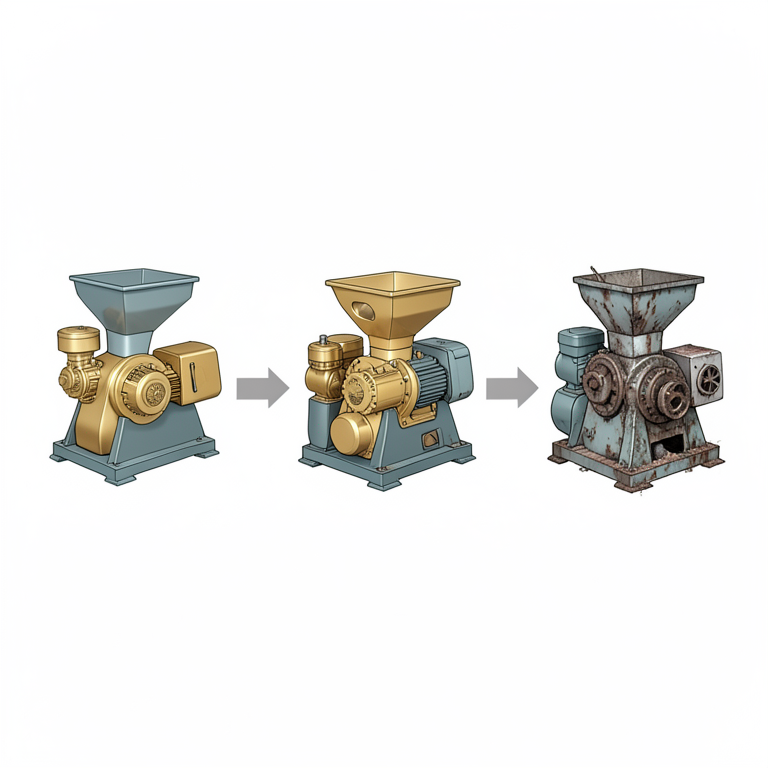
Hazard Function Concept
AI-generated conceptual illustration (locally fabricated cassava grinding machine powered by a gold engine). It explains the idea and does not show study data.
View source evidence ↗Figures & tables
From the original paper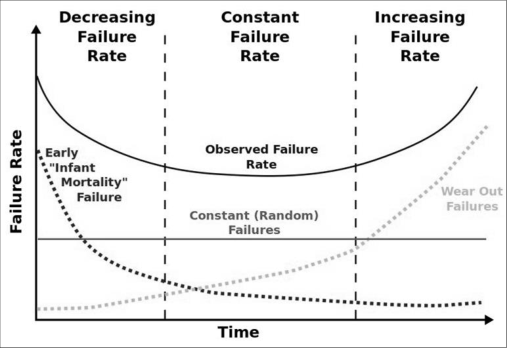 Figure 1
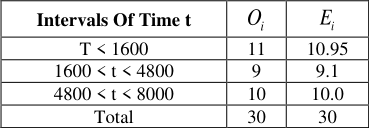 Table 1
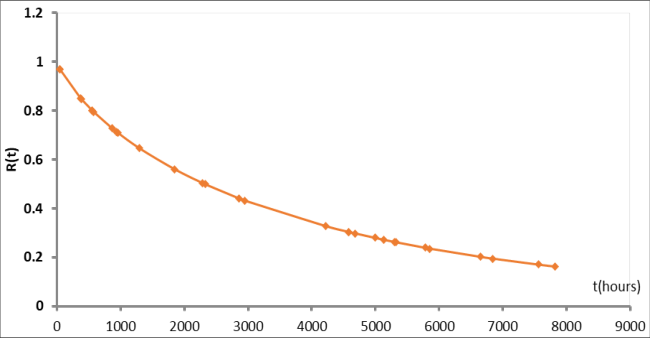 Figure 2
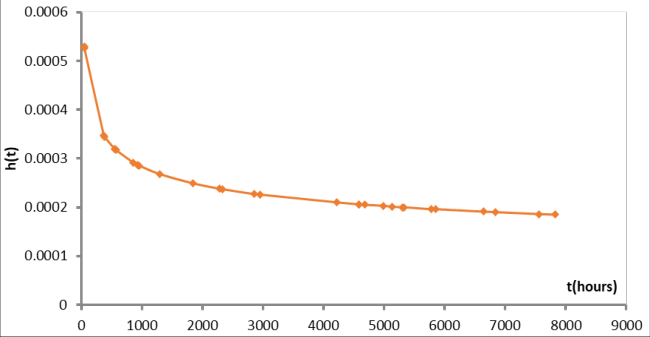 Figure 3
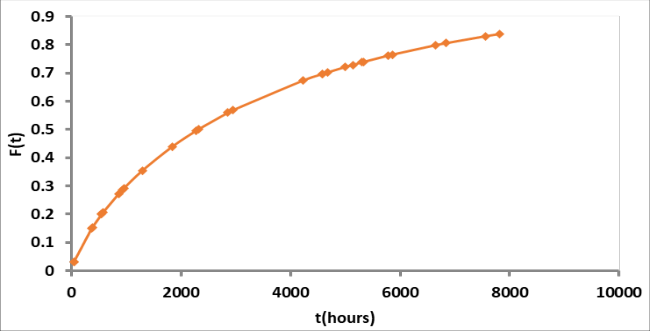 Figure 4
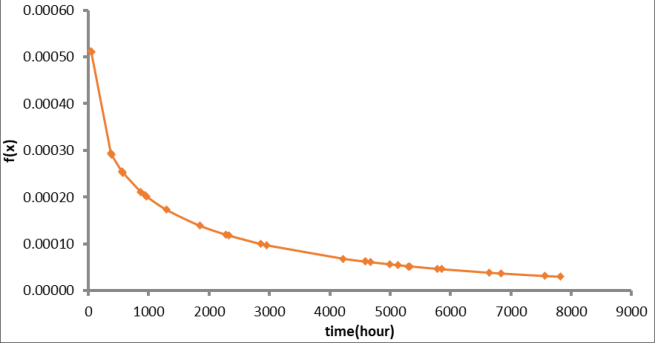 Figure 5
Introduction
A reliability study is concerned with random occurrences of undesirable events of failures during the lifetime of a physical system, Kapur (1941) [5] . Reliability is generally regarded as the likelihood that a system is functional during a certain period of time under a specified operating environment. It is always considered as one of the most important characteristics for industrial products and systems. Reliability studies life data and subsequently uses it to estimate, evaluate and control the capability of component, products and systems. The theories and tools of reliability is applied in widespread fields such as electronic and manufacturing products, aerospace equipment, earthquake and volcano forecasting, communication systems, navigation and transportation control, medical treatment to the survival analysis of human being or biological species and so on (Weibull, 1977; and Lawless 1982). The reliability period of any system is measured within the durability period of that system. The probabilistic models used are generally called "Time to Event" models, where an event is a failure. Moreover, with the increased complexity of component structure and the continuous requirements of high quality and reliability products, the role of reliability of a product is more important to both the producers and the consumers nowadays. A repairable system is a system which can be restored to its original working condition by any maintenance action after failure (Lindqvist, 2006) [7] . It can be repaired once failure happens, but it is vital to assess the risk of unexpected failures in order to improve the system reliability, Khan and Haddara (2003) [6] and Wang, Cheng, Hu and Wu (2012) [12] . Maintenance is any activity that is carried out on any facility either to restore or to retain the facility in good and acceptable working conditions. It involves all technical and other procedures performed in order to retain the satisfactory working condition of a machine or part or restoring it to an acceptable working condition so that the set tasks can be performed at the scheduled time and under given conditions. In developing countries, maintenance is often not given the priority it deserves in the overall operating strategy of a facility. Maintenance action can be preventive or corrective (repair). Generally there are two main types or assumptions of maintenance: perfect or "as good as new" and worse than or "as bad as old" maintenance, but in reality the equipment after maintenance lies somewhere in between these two conditions, which is called an imperfect maintenance or "better than old, but worse than new"; Doyen, (2005) [2] .
The first two extreme assumptions or types of maintenance are impracticable compared to the imperfect maintenance. This is because the failure nature of repairable systems depends on the repair history of the system, Muhammad, Majid, Amin and Ibrahim, (2009) [9] . Therefore, our interest is on the reliability function and measures of a mechanically repairable cassava grinding machine to provide information on the state of the machine as well as provide time to repair and time to perform other maintenance actions on the system to avoid failure and wastage. A grinding machine does not exhibit constant failure rate. Its operational efficiency degrades with time and usage. In other words, it deteriorates or wears with usage and time. These types of failures are modelled using the Weibull distribution, see Mann and Sinpurwalla (1973) [8] . The particular form of the hazard function which comprises three parts is depicted in Figure 1. The 'bathtub curve" of hazard function is a combination of a decreasing hazard of early failure and an increasing hazard of wear-out failure, plus some constant hazard of random failure. The bathtub curve is widely used in reliability engineering. The early stage or infant mortality period is the first stage, where the hazard function decreases overtime. The failures occur due to errors in design or due to mistakes caused by inexperienced personnel or user. The infant mortality period is followed by a nearly constant failure rate period known as useful life. In this region failure rate is low and approximately constant and the failures occur by pure chance. In contrast to early failure caused by the inherent weakness of the machine, the failure during this stage occur mostly due to external reasons such as overloading, collision with another object, hidden defect and mistakes of the personnel. Additionally, as the failure rate is constant, this is the only region, in which the exponential distribution can be valid and thereby the time between failures is exponentially distributed. On the other hand, the failure rate during this period follows a Weibull distribution with the shape parameter, 1 . While the wear-out period is characterized by a rapid increasing failure rate with time. The failure in this stage is caused by wear, fatigue, cohesion or gradual deterioration of the machine. From Billington's (1992) [1] point of view, this period is more evident than the other two periods as in this region, the failure density function will increase firstly, and then decrease to zero for the obsolescence of components. In the wear-out period, the failure density function can often be represented or approximated by normal distribution, gamma, and Weibull distribution among other distributions with shape parameters, whose variation can create significantly different characteristic shape.
Assumptions of the Study
The basic assumptions of this study are: 1. Failures in the machine occur at random. 2. Given the life time distribution of the machine f(t), it is assumed that failure occurs at the end of time t. 3. The failures that occur at each time t are independent and is continuously distributed.
The 8HP-PML Gold Engine Coupled Locally Fabricated Cassava Grinding Machine
This is a mechanically repairable machine which does not exhibit constant failure rate. Its operational efficiency degrades with time and usage. In other words, it deteriorates or wears with usage and time. Therefore, our interest is on the reliability function and measures of this machine to provide information on the state of the machine as well as provide time to repair and perform other maintenance actions to avoid failure and wastage. These types of failures are modelled using the Weibull distribution, see Mann and Sinpurwalla (1973) [8] .
Methodology 2.1 The Weibull life function
A handful of parametric models exist which have been successfully used as population models for failure times both for repairable and non-repairable systems, arising from a wide range of product and failure mechanism. Examples of such models are exponential, Weibull, lognormal, gamma models, etc. These distributions are exhibited by systems according to their mode of failure and failure mechanism. Sometimes, there are probabilistic arguments based on the physics of the failure mode that tends to justify the choice of models. Other times, the models are used solely because of its empirical success in fitting actual failure data. Thus, the choice of our model is based on a combination of both its failure mechanism and empirical success.
Goodness-of-Fit Test for Weibull Distribution
In this study, the chi-square test would be used to investigate whether the distribution of the failure of the cassava grinding machine differ from expected Weibull distribution. The expected frequencies of failure of the cassava grinding machine at a given intervals of time, t is given by; 1 shows the observed and expected frequencies of failure of the cassava grinding machine at a given intervals of time, t. Where i O is the observed frequency of class i =1, 2, 3, 4, 5. The test showed that the distribution of failure rate of the cassava grinding machine follows the Weibull distribution.
The Mean and Variance of a Two Parameter Weibull Distribution
The probability density function of the two parameter Weibull Distribution is given by;
Reliability Function of Weibull Distribution
Reliability, R(t) is defined as the probability in which an item or an entity performs its intended function over a period of time under stated conditions. It is given by;
Taking the limit of the failure rate at the interval,
Reliability Indices 2.6.1 The mean time between failures (MTBF):
The mean time between failures (MTBF) is the length of time within which failure occurs in a machine. It is given by;
The mean time to repair (MTTR):
The mean time to repair (MTTR) is the average time to repair a failed component or device. It is given by; c u (10) Where u is the total down time of the machine given by N i i u 1 and c is the total number of failures in the machine.
Availability factor:
It is the probability that a system will work as required during a particular period of time. It is given
Maintainability factor:
It is the ease with which maintenance of a functional unit can be performed in accordance with prescribed requirement. It is given by;
Estimating the Parameters of Weibull Distribution using Method of Least Squares
The cumulative distribution function is given as;
Taking the natural log of both sides;
And taking natural log again; we obtain
Where t y represent the order statistic, such that
Then, it can be represented as;
We obtain the following normal equations by ordinary least square method;
By solving the normal equation simultaneously, we obtain;
Analysis and Results
Analysis and Results
Evaluation of the Weibull Parameters
Evaluation of the Weibull Parameters
Let
The estimate of 1 is given by;
Evaluation of Reliability Indices of Cassava Grinding Machine
From ( 2), ( 10) -( 12), the reliability indices; MTBF, MTTR, A f and M f were respectively obtained as 4190.33 hours, 99.2 hours, 97.7% and 2.3%.
Evaluation of Reliability Functions of the Cassava Grinding Machine using Weibull Distribution
By using the estimated parameters of Weibull distribution from our data; 2, the reliability of the cassava grinding machine reduces gradually within 4000 hours between the reliability value 0.98 and 0.3. Its reliability reduces rapidly within the time interval of 4000 hours to 8000 hours which shows a sudden decrease.
4.2
The hazard function or failure rate: Figure 3 is a combination of a decreasing hazard rate of early failure and constant hazard rate of random failure which is the first and second stage of the 'bathtub curve' of the hazard function. The failure rate decreases from the failure rate value of 0.00054 to 0.00024 within 3000 hours of operation and maintains a constant failure from 4000 hours to 8000 hours at point 0.0002.
4.3
The failure distribution function: Figure 4 shows that the distribution of failure increases from point 0 to 0.65 within the time interval of 0 hour to 4000 hours. It increases continually at a rapid rate within 4000 hours to 8000 hours at point 0.65 and 0.8 respectively.
4.4
The failure density function: Figure 5 shows that the likelihood of occurrence of failure in the cassava grinding machine decreased sharply from point 0.00050 to 0.00030 within 0 hours to 400 hours of operation and started reducing gradually as time increases. This pattern is similar to the density function of a typical Weibull distribution.
The reliability indices:
With reference to subsection 3.2, the mean time between failure of the cassava grinding machine MTBF=4190. This implies that the grinding machine is operational for 4190 hours, which is about 175 days before failure occurs. Also, the mean time to repair MTTR=99.2 hours implies that the machine is restored to normal working condition within 4 days on the average after failure. The availability factor; f A =97.7% implies that the cassava grinding machine is in a working state for 97.7% of the time while the maintainability of the cassava grinding machine; f M =2.3%, implies that 2.3% out of 100% availability time of the grinding machine is used for repair and other maintenance actions.
Conclusion
The chi-squared goodness-of-fit test confirmed that the empirical failure data of the 8HP-PML Gold Engine coupled locally fabricated cassava grinding machine follows a Weibull distribution with shape parameter:
and mean time between failures as 4190 hours. The mean time to repair of the machine implies that it takes about 99 hours (3 days) to repair the cassava grinding machine after failure. Also, the availability factor, A = 97.7% implies that the machine is in a working state for about 97.7% of the time while 2.3% out of 100% availability of the machine time is used for repair/maintenance actions.
Figures and tables from the paper
| Intervals Of Time t | O i | E i |
|---|---|---|
| T < 1600 | 11 | 10.95 |
| 1600 < t < 4800 | 9 | 9.1 |
| 4800 < t < 8000 | 10 | 10.0 |
| Total | 30 | 30 |
Table text extracted from the original PDF; superscript letters are shown inline. The original table image is below.
View original table image
References
14 in the original paper- Billington R. Reliability Evaluation of Engineering System. Plenum Press, New York and London, 1992.
- Doyen L. Repair Efficiency Estimation in the ARI1 Imperfect Repair Model. Modern Statistical and Mathematical Methods in Reliability, Wilson, A. G. (Ed.). World scientific, USA, 2005. ISBN: 9789812703378: 153-168.
- Ebeling CE. An introduction to Reliability and Maintainability Engineering. Mc. Graw-Hill companies Inc. Boston, 1997.
- Kaminskiy MP, Kritsov VV. A Monte Carlo Approach to Repairable System Analysis in: Probabilistic Safety Assessment and Management, New York, springer, 1998, 1061-1068.
- Kapur KC, Lamberson LR. Reliability in Engineering Design. Wayne State University, Detroit, Michigan 48202. John Wiley and sons Printing Press, New York, Chi Chester Brishan, Toronto, 1941.
- Khan FI, Haddara MR. Risk-based maintenance (RBM): A quantitative approach for maintenance/inspection scheduling and planning Journal of Loss Prevention in the Process Industries. 2003; 16: 516-573.
- Lindqvist BH. On the Statistical Modelling and Analysis of Repairable Systems. Stat. Sci. 2006: 21:532-551.
- Mann RN, Schafer RE, Sinpurwalla ND. Methods of Statistical Analysis of Reliability and Life Data. Canoga Park, California, Hullerton, California Washington D. C. John Wiley and Sons Inc, 1973.
- Muhammad M, Majid AA, Ibrahim NA. A case study of reliability assessment for centrifugal pumps in a petrochemical plant. Proceeding of the 4 th World Congress on Engineering Asset Management, September 28-30, 2009, Athens, Greece, 2009, 398-404.
- Nwobi FN, Ugomma CA. A Comparison of Methods for the estimation of Weibull distribution parameters. Metod. Zv. 2014; II(1):65-78.
- Razali AM, Salih A, Mahdi AA. Estimation Accuracy of Weibull Distribution Parameters. Journal of Applied Science Research, 2009, 790-795.
- Wang Cheng Hu, Wu. Failure modes and effect analysis on ITER DFLL-TBM system. Fusion Eng. Des. 2012: 87:13071309.
- Weibull W. A Statistical Distribution Function of wide applicability, Journal of Applied Mechanics. 1951; 18:293-297.
- Yong. Joint Modelling and Estimation for Recurrent Event Processes and Failure time data. American statistics Assoc. 2004; 99:1153-1165.
Cited by 5
From OpenAlex, OpenCitations and reference lists read by Scinovex
- Optimization maintenance performance level through collaboration of overall equipment effectiveness and machine reliability ↗
Faisal Riza Rahman, Sugiono Sugiono, Sonief As'ad, Oyong Novareza · Istrazivanja i projektovanja za privredu · 2022
Maintenance performance level (MPL) is an important part of the key performance indicator (KPI) to improve the effectiveness of machine maintenance which includes factors of overall equipment effectiveness-machine effectiveness (OEE-ME) and machine reliability (MR). The purpose of this paper is to optimize the value of the maintenance performance level (MPL) through the collaboration of overall equipment effectiveness-machine effectiveness (OEE-ME) and…
❝ 11PDF - Availability Optimization of the Mobile Crane Using Approach Reliability Engineering at Oil and Gas Company ↗
Faisal Riza Rahman, Sugiono Sugiono, Achmad As’ad Sonief, Oyong Novareza · Mathematical Modelling and Engineering Problems · 2022
Reliability engineering is needed for scheduling maintenance to improve system or equipment performance. The purpose of this paper is to provide recommendations for maintenance schedules based on reliability, availability, and maintainability (RAM) analysis that optimizes the availability of mobile cranes operating in Indonesian oil and gas companies. This paper begins with searching for a critical system using the Pareto principle.…
❝ 4PDF - Probabilistic modeling of failure times and replacement maintenance of television transmitter system ↗
N. S. Udoh, M. Raheem, A. Udom · Nigerian Journal of Technology · 2022
Assessment of the state of health and working condition of equipment in the production and service industries is a necessary condition for effective maintenance. Therefore, this work models the failure times and other operational characteristics of television transmitter system with sudden but non-constant failure rate to enhance smooth operation of the system. The failure times was shown to follow lognormal…
❝ 1PDF - Reliability and Maintainability Analysis of Table Saw Machine ↗
Nse Udoh, Andrew Etim · European Journal of Theoretical and Applied Sciences · 2024
Reliability and Maintainability analyses are necessary actions to be taken on machines in order to reduce operation cost and enhance production efficiency. They are among the design attributes of a machine. Therefore, engineers and machine’s operators need uphold their standard in order to ensure seamless production over the production cycle, reduce wastage due to downtime and maximize profit. This work…
❝ 0PDF - Availability Optimization of the Crawler Crane Using Approach Reliability Engineering at Logistic Shore Base Company in Indonesia ↗
Tiara Shinta Raharkandi, Dendi Prajadhiana Ishak · 2023
Reliability engineering is needed for scheduling maintenance to improve system or equipment performance.The purpose of this paper is to provide recommendations for maintenance schedules based on reliability, availability, and maintainability (RAM) analysis that optimizes the availability of Crawler Cranes operating in Logistic Shore Base companies in Indonesia.This paper begins with searching for a critical system using the Pareto principle.The critical…
❝ 0PDF