
Research article · 2018 · Full text
International Journal of Statistics and Applied MathematicsPredicting infant mortality in India using time series models
Volume 3(5) · Pages 33–42
Research areasIoT and GPS-based Vehicle Safety SystemsArtificial Intelligence and Decision Support SystemsForecasting Techniques and Applications
Abstract
Author-writtenPredicting infant mortality rate is an important aspect of study to prepare society and government for better or worst in future Many Programs might approach to fulfill the desired target in given time. In study an approach of time series models had used for prediction of infant mortality in India and some of its states. States had been selected by using the target sated in revised population policy 2017. In the study we found 13 states of India which does not have twenty eight per thousand infant mortality Rate in 2016 SRS data. We made our prediction using time series model named as Autoregressive Integrated Moving Average Method. This Chapter also compares these results to previous attempt to predict IMR Using ARIMA models.
Summary
Source-checkedPlain-language reading of the full paper, prepared with AI and checked against the text. Each point links to the authors' own words.
Why it matters
- Infant mortality rate (IMR) is used by global organizations like the WHO and UN as a key measure of a country's socio-economic development and social well-being. View evidence ↗
- The United Nations previously set a target to reduce the infant mortality rate by two-thirds between 1990 and 2015 as part of the Millennium Development Goals. View evidence ↗
- India showed progress in reducing under-five child deaths, which dropped from 2.5 million in 2001 to 1.5 million in 2012. View evidence ↗
The question
- The study aims to predict the future infant mortality rate for India and several of its states using the Autoregressive Integrated Moving Average (ARIMA) model. View evidence ↗
What they did
- The study used Sample Registration System (SRS) data from 1980 to 2016, though for Chhattisgarh, Jharkhand, and Uttarakhand, data was only available from 2000 to 2016. View evidence ↗
- The ARIMA model parameters (p, d, q) were adopted from a previous study by De et al. (2016). View evidence ↗
What they found
- For Andhra Pradesh, the study predicted an IMR of 28 (95% CI: 27-30) by 2019, suggesting the state would meet the target that year. View evidence ↗
- Assam is predicted to reach the target IMR of 28 (95% CI: 23-31) in the year 2030. View evidence ↗
- Bihar is predicted to achieve the target IMR in 2023, with a predicted value of 27 (95% CI: 23-31). View evidence ↗
- Chhattisgarh is predicted to reach the target IMR of 28 (95% CI: 25-31) in 2020, one year after the 2019 goal. View evidence ↗
- Madhya Pradesh is predicted to achieve the target IMR of 28 (95% CI: 26-29) in 2024. View evidence ↗
- Uttar Pradesh is predicted to meet the target IMR of 28 (95% CI: 26-31) in 2027. View evidence ↗
- Uttarakhand is predicted to achieve the target IMR of 28 in 2022. View evidence ↗
- For India as a whole, the study predicts the target IMR of 28 (95% CI: 27-30) will be achieved in 2022. View evidence ↗
What it means
- The authors conclude that India can reach its overall target if specific focus is placed on the states that are lagging. View evidence ↗
- The authors recommend periodic updates to the data to ensure more accurate future planning. View evidence ↗
Visual summary
3 visualsIllustrations explain the paper; charts are replotted from the paper's own table values.
ARIMA Prediction Concept
AI-generated conceptual illustration (Infants in India). It explains the idea and does not show study data.
View source evidence ↗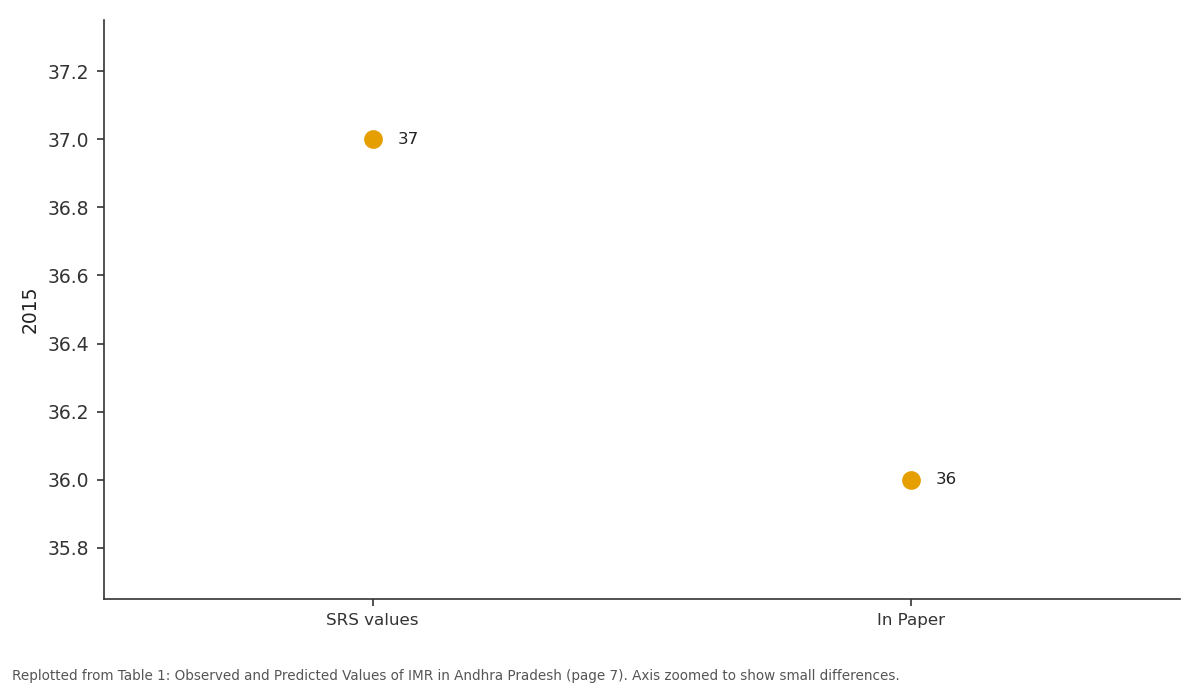
2015: SRS values vs In Paper
Replotted from Table 1 (page 7) of the original paper. Every bar is the paper's own table value.
View source evidence ↗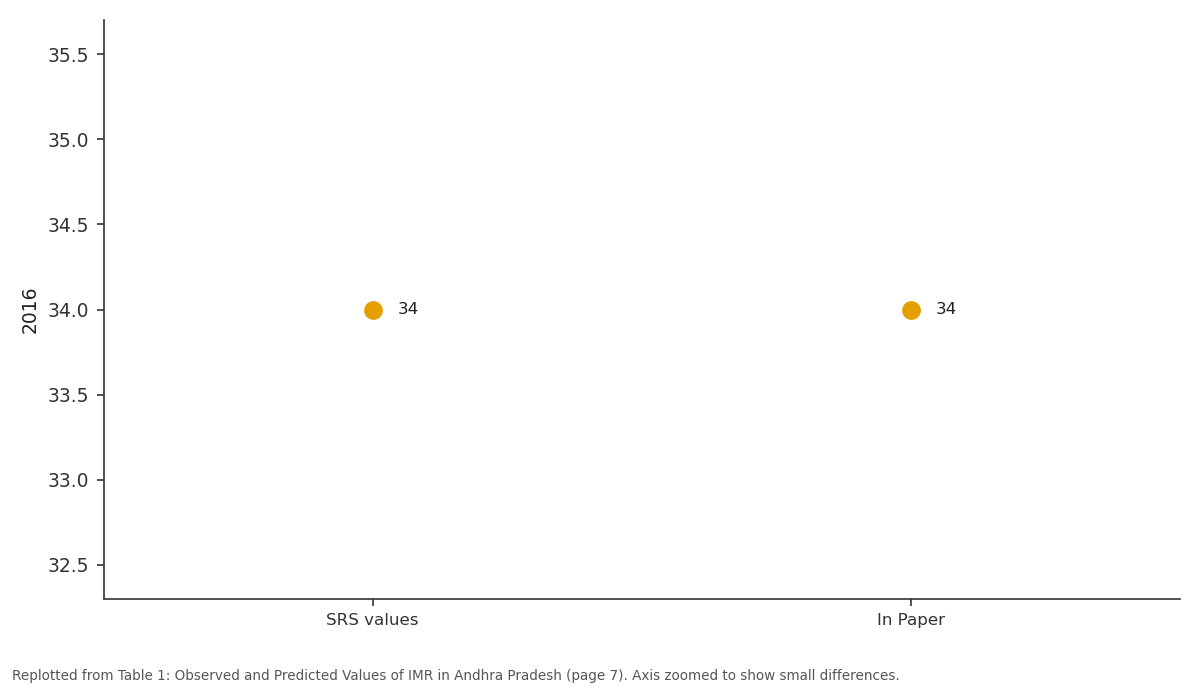
2016: SRS values vs In Paper
Replotted from Table 1 (page 7) of the original paper. Every bar is the paper's own table value.
View source evidence ↗Figures & tables
From the original paper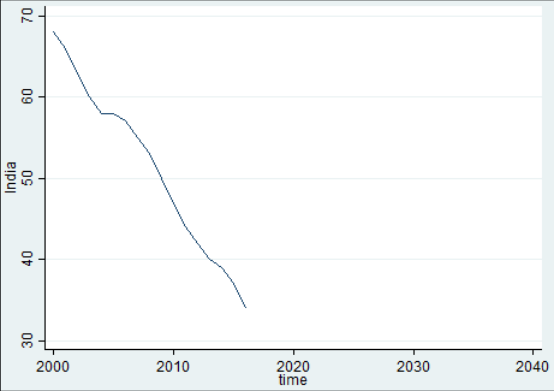 Figure 1
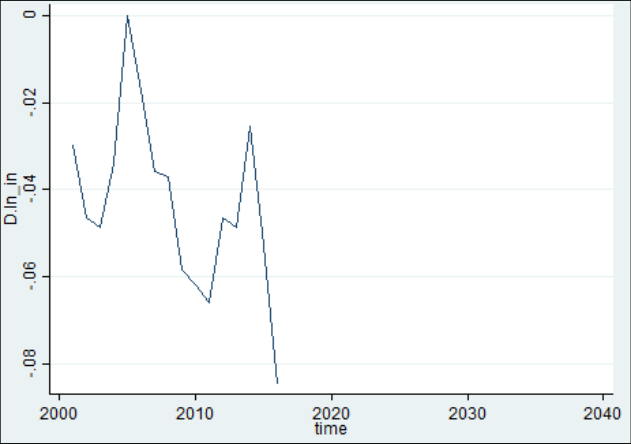 Figure 1
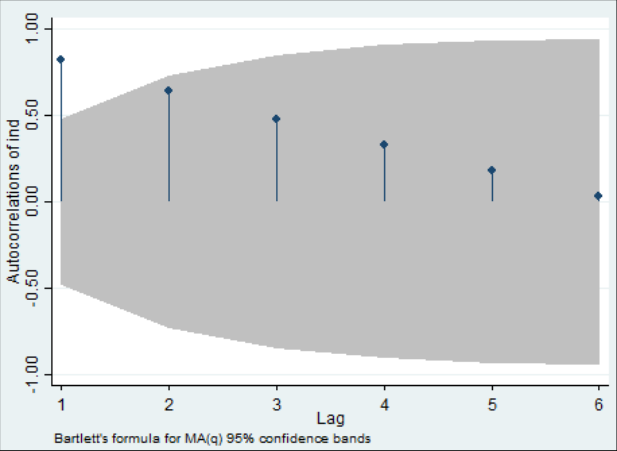 Figure 3
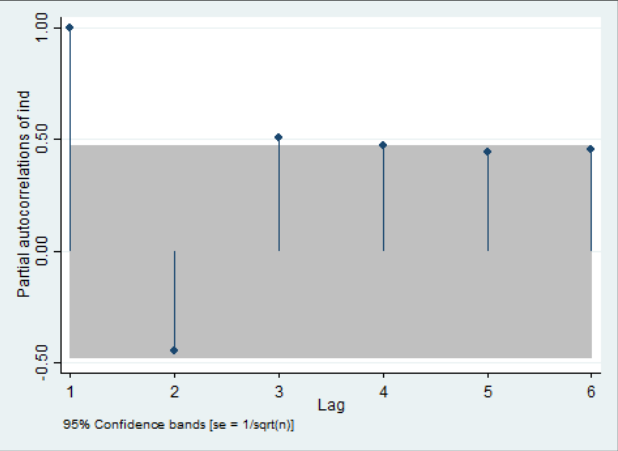 Figure 4
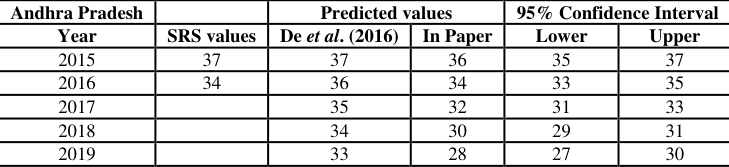 Table 1
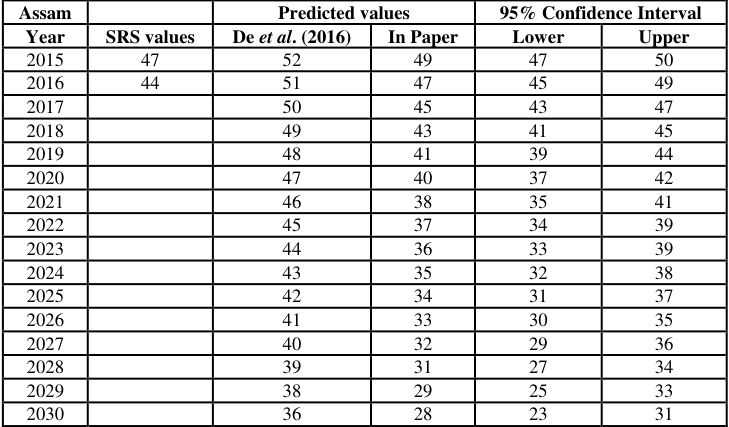 Table 2
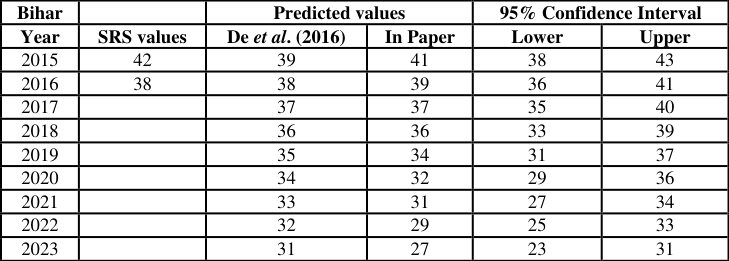 Table 3
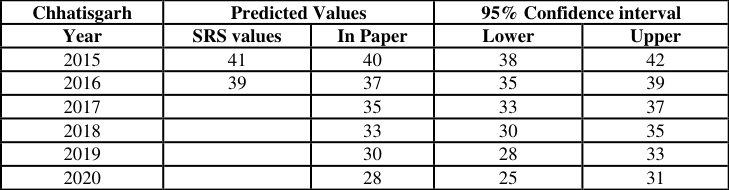 Table 4
 Table 5
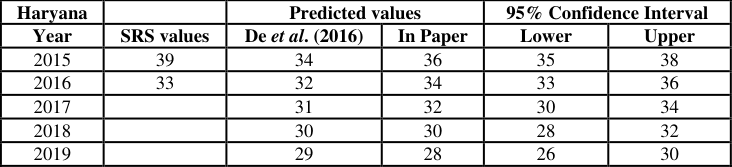 Table 6
 Table 7
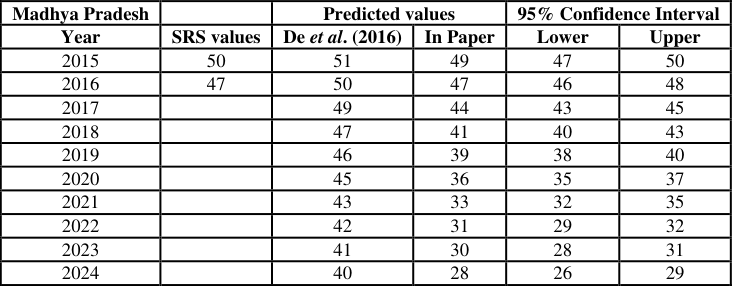 Table 8
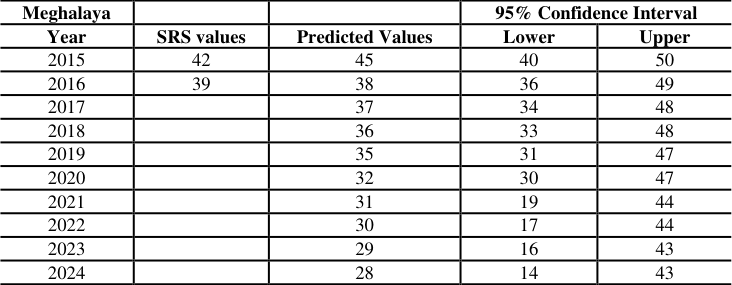 Table 9
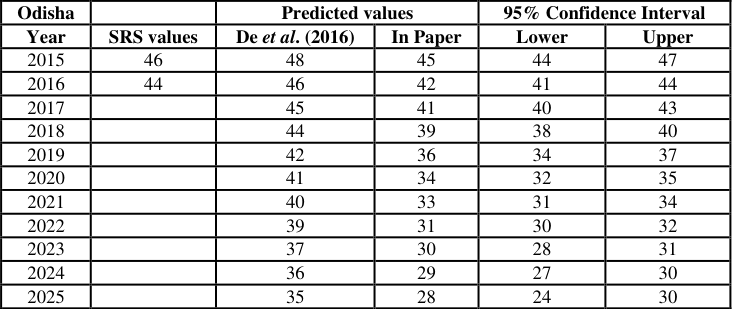 Table 10
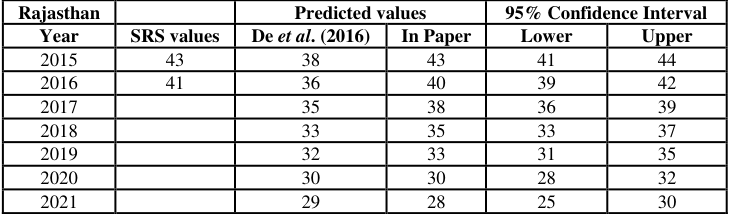 Table 11
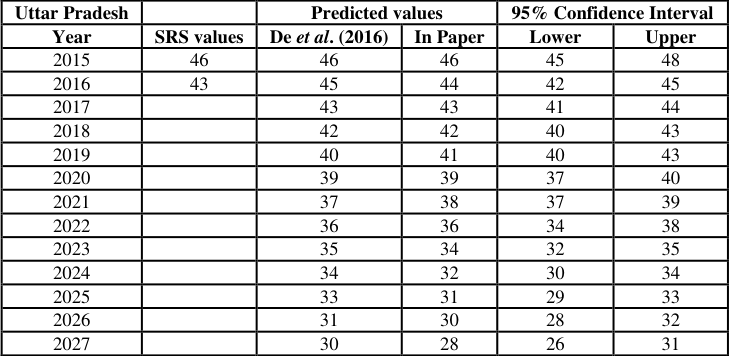 Table 12
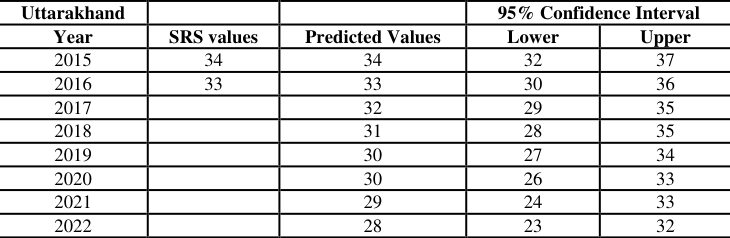 Table 13
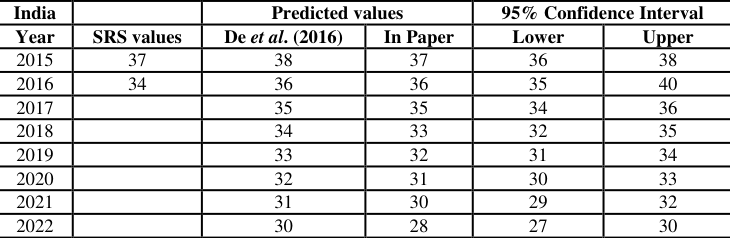 Table 14
Introduction
The infant mortality is judged as a comprehensive indicator of socio-economic development. Policy-making bodies like World Health Organization (WHO), United Nations (UN) have been using it as an important indicator to measure the socio-economic development of a country. It as often used as an indicator to understand the equity of distribution of resources and investment in health and social services (WHO, 2001) [12] . The UN currently uses IMR as a measure of social well-being and considers the trends of IMR as one of the indicators to achieve the Millennium Development Goals (MDG). Its target is to two third reduction in infant mortality rate (IMR) from 1990 to 2015 (United Nations, 2000). Thus study of underfive mortality trends and the possible explanations for such trends are of prime importance to understand socio-economic progress and investment in public health (De, 2011) visualized in sustainable development goals too. The International Conference on Primary health car held in Alma Ata in 1978 was the first global forum to consider how child and infant mortality could be reduced by the systematic development of primary health care system (WHO, 1978) [11] . Ahmad et al. (2000) [6] suggested that rapid rate of decline observed earlier was not sustainable given the slow rate of economic development and infusion of a very narrowly defined set of sophisticated technology-driven public health inventions. India has made steady progress in reducing deaths in children younger than 5 years, with total deaths declining from 2.5 million in 2001 to 1.5 million in 2012 (UN, 2012) [10] . Neonatal and 1-59 month mortality vary substantially between subregions of India as a result of the underlying differences in social and economic status, child nutrition status, health services, work culture, gender bias, and other factors that affect child mortality. The National Rural Health Mission recommends district-based planning for maternal child health programs and, indeed, for other disease-specific initiatives (Bhan, 2013) [4] . Benicio et al. (1985) [5] studied the declining trend of the infant mortality rate in Sao-Paulo during the 1980 in relation to the improvement of social conditions, especially the increased numbers of households with mains water, the schooling levels of parents, and the expanded reach of health services as reflected in vaccination coverage and hospital attendance. Concurrent with the improving profile of infant mortality in the city, the rise in mortality associated with perinatal events and nutritional deficiencies in the poorest areas reflected increasing social inequalities (Monteiro, et al. 1995) [1] .
Proposing and planning the programs related to infant mortality are based on the present conditions to improve future. That initiates the curiosity that what will be future if no new programs or plans are included in population at present. Which turns to idea of future prediction. General future predictions are made by the base of some past data. Sample registration system data is being used for past study. To predicting the infant Mortality various methods are available. In recent times the time series models are considered quite useful in predicting the demographic phenomenon. These methods are Simple moving average (SMA), Exponential Smoothing System (SES), Autoregressive integrated moving Average method (ARIMA), Neral Network (NN) and Crosten. Tripathi et al. (2018) [9] proposed the Baysian Approach of ARIMA model in Indian Context to predict the total fertility rate. De et al. (2016) [8] Suggested to use the ARIMA model to predict Child mortality in some states of India for the duration of 2015-2030. He also suggested that if a predicted values in future vary from original values that might effect whole other predicted values. This chapter is an attempt to predict infant mortality rate in India and some of its states up to sometime points in future Using ARIMA Model using De et al. (2016) [8] results with its corresponding diagnostics and also being compared to results of those states whose infant mortality had predicted by De et al. (2016) [8] because observed infant mortality of 2014, 2015 and 2016 are different from predicted values in De et al. (2016) [8] . Now for better studies we move to data and methodology section.
Data and Methodology
Data and Methodology
Arima Model Assumptions
The main Assumption is that ARIMA models is of stationarity of process over time or a process whose Unconditional joint probability distribution does not change when shifted in time if not it will transformed into it before applying ARIMA. (Box and Jenkins(1970)).
Arima Model
Given a time series of data 𝑋 𝑡 where t is an integer index and the 𝑋 𝑡 are real numbers, an ARIMA (𝑝, 𝑞) model is given by
Where 𝐿 is the lag operator, the 𝛼 𝑖 are the parameters of the autoregressive part of the model, the 𝜃 𝑖 are the parameters of the moving average part and the 𝜀 𝑡 are error terms. Standard Form of ARIMA Consists with three Values (p,d,q) where p is autoregressive term, d is the difference, and q is moving average estimate, to evaluate value of (p,d,q) different graphs have been used over time. In this chapter the values of IMR have been predicted for above states and India to obtain that when the target of 28/1000 achieved by India and these states and How many years the states are behind or forward to achieve the target than India. The estimated values of p,d,q are considered as the values of De et al. (2016) [8] . Data of SRS from 1980-2016 have been taken except for 3 states as Chhatisgarh, Jharkhand and Uttarakhand data is not available before 2000. Thus for these states data of IMR from 2000 to 2016 SRS is being considered.The data of Telangana is not available before 2015 so prediction for Telangana not been made.
Results
When we study diagnostic of model we found that the model satisfies the value of Arima (0, 1, 1) for India which is same as the values considered in De et al. (2016) [8] . So using these results we go for the predicted values for states considered.
Predicted Values for Andhra Pradesh
Result shows the predicted values for Andhra Pradesh as in 2015 SRS value is 37, in De et al. (2016) [8] the predicted value was 37 our result shows the predicted value 36 with 95% confidence interval 35-37. For year 2016 SRS value is 34 De et al. (2016) [8] predicted values 36, in study this value is 34 with 95% confidence interval 33-35. In case of year 2017 the predicted values for De et al. (2016) [8] 35, in study predicted value is 32 with 95% confidence interval 31-33. For 2018 the predicted value in De et al.
(2016) [8] 34 and in study the predicted value is 30 with 95% confidence interval 29-31. For year 2019 the predicted value in De et al. (2016) [8] is 33 whether in study the predicted value is 28 with confidence interval of 95% 27-30. This shows that the state achieve the target in year 2019.
Predicted Values for Assam
Result shows the predicted values for Assam as in 2015 SRS value is 47, in De et al. (2016) [8] the predicted value was 52 our result shows the predicted value 49 with 95% confidence interval 47-50. For year 2016 SRS value is 44 De et al. (2016) [8] predicted values 51, in study this value is 47 with 95% confidence interval 45-49. In case of year 2017 the predicted values for De et al. (2016) [8] 50, in study predicted value is 45 with 95% confidence interval 43-47. For 2018 the predicted value in De et al.
(2016) [8] 49 and in study the predicted value is 43 with 95% confidence interval 41-45. For year 2019 the predicted value in De et al. (2016) [8] is 48 whether in study the predicted value is 41 with confidence interval of 95% 39-44. This shows that the state does not achieve the target in year 2019. Result also shows for Assam in 2020, in De et al. (2016) [8] the predicted value was 47 our result shows the predicted value 40 with 95% confidence interval 37-42. For year 2021, De et al. (2016) [8] predicted values 46, in study this value is 38 with 95% confidence interval 35-41. In case of year 2022 the predicted values for De et al. (2016) [8] 45, in study predicted value is 37 with 95% confidence interval 34-39. For 2023 the predicted value in De et al. (2016) [8] 44 and in study the predicted value is 36 with 95% confidence interval 33-39. For year 2024 the predicted value in De et al. (2016) [8] is 43 whether in study the predicted value is 35 with confidence interval of 95% 32-38. Result suggest that the predicted values for Assam as in 2025, in De et al. (2016) [8] the predicted value was 42, our result shows the predicted value 34 with 95% confidence interval 31-37. For year 2026, De et al. (2016) [8] predicted value 41, in study this value is 33 with 95% confidence interval 30-35.
In case of year 2027 the predicted values for De et al. (2016) [8] is 40, in study predicted value is 32 with 95% confidence interval 29-36. For 2028 the predicted value in De et al. (2016) [8] is 39 and in study the predicted value is 31 with 95% confidence interval 27-34. For year 2029 the predicted value in De et al. (2016) [8] is 38 whether in study the predicted value is 29 with confidence interval of 95% 25-33. Result shows that in 2030, De et al. (2016) [8] predicted value 36 our result shows the predicted value 28 with 95% confidence interval 23-31. This shows that the state achieve the target in year 2030.
Predicted Values for Bihar
Result shows the predicted values for Bihar as in 2015 SRS value is 42, in De et al. (2016) [8] the predicted value was 39, our result shows that predicted value 41 with 95% confidence interval 38-43. For year 2016 SRS value is 38 De et al. (2016) [8] predicted values 38, in study this value is 39 with 95% confidence interval 36-41. In case of year 2017 the predicted values for De et al. (2016) [8] 37, in study predicted value is 37 with 95% confidence interval 35-40. For 2018 the predicted value in De et al.
(2016) [8] is 36 and in study the predicted value is 36 with 95% confidence interval 33-39. For year 2019 the predicted value in De et al. (2016) [8] is 35 whether in study the predicted value is 35 with confidence interval of 95% 31-37. This shows that the state does not achieve the target in year 2019. Result also shows the predicted values for Bihar as in 2020 De et al. (2016) [8] the predicted value was 34 our result shows the predicted value 32 with 95% confidence interval 29-36. For year 2021 De et al.
(2016) [8] predicted values 33, in study this value is 31 with 95% confidence interval 27-34. In case of year 2022 the predicted values for De et al. (2016) [8] 32, in study predicted value is 29 with 95% confidence interval 25-33. For 2023 the predicted value in De et al. (2016) [8] 31 and in study the predicted value is 27 with 95% confidence interval 23-31. This shows that the state achieve the target in year 2023.
Predicted Values for Chhatishgarh
Result shows the predicted values for Chhatisgarh as in 2015 SRS value is 41, our result shows the predicted value 40 with 95% confidence interval 38-42. For year 2016 SRS value is 39, in study this value is 37 with 95% confidence interval 35-39. In case of year 2017 predicted value is 35 with 95% confidence interval 33-37. For 2018 the predicted value is 33 with 95% confidence interval 30-35. For year 2019 the predicted value in study is 30 with confidence interval of 95% 28-30. This shows that the state does not achieve the target in year 2019. In 2020 in our result shows the predicted value is 28 with 95% confidence interval 25-31. This shows that the state achieve the target one year later than 2019.
Predicted Values for Gujrat
Result shows the predicted values for Gujrat as in 2015 SRS value is 33, in De et al. (2016) [8] the predicted value was 34 our result shows the predicted value 33 with 95% confidence interval 32-35. For year 2016 SRS value is 30 De et al. (2016) [8] predicted values 32, in study this value is 31 with 95% confidence interval 30-33. In case of year 2017 the predicted values for De et al. (2016) [8] 31, in study predicted value is 29 with 95% confidence interval 28-31. For 2018 the predicted value in De et al.
(2016) [8] 30 and in study the predicted value is 27 with 95% confidence interval 26-29. This shows that the state achieve the target in year 2019.
Predicted Values for Haryana
Result shows the predicted values for Haryana as in 2015 SRS value is 39, in De et al. (2016) [8] the predicted value was 34 our result shows the predicted value 36 with 95% confidence interval 35-38. For year 2016 SRS value is 33 De et al. (2016) [8] predicted values 32, in study this value is 34 with 95% confidence interval 33-36. In case of year 2017 the predicted values for De et al. (2016) [8] 31, in study predicted value is 32 with 95% confidence interval 30-34. For 2018 the predicted value in De et al.
(2016) [8] 30 and in study the predicted value is 30 with 95% confidence interval 28-32. For year 2019 the predicted value in De et al. (2016) [8] is 29 whether in study the predicted value is 28 with confidence interval of 95% 26-30. This shows that the state achieve the target in year 2019.
Predicted Values for Jharkhand
Result shows the predicted values for Jharkhand as in 2015 SRS value is 32, result shows the predicted value 31 with 95% confidence interval 29-33. For year 2016 SRS value is 29, in study this value is 29 with 95% confidence interval 26-32. In case of year 2017 the predicted values in study is 27 with 95% confidence interval 24-30. This shows that the state achieve the target before year 2019.
Predicted Values for Madhya Pradesh
Result shows the predicted values for Madhya Pradesh as in 2015 SRS value is 50, in De et al. (2016) [8] the predicted value was 51 our result shows the predicted value 49 with 95% confidence interval 47-50. For year 2016 SRS value is 47 De et al. (2016) [8] predicted values 50, in study this value is 47 with 95% confidence interval 46-48. In case of year 2017 the predicted values for De et al. (2016) [8] is 49, in study predicted value is 44 with 95% confidence interval 43-45. For 2018 the predicted value in De et al.
(2016) [8] 47 and in study the predicted value is 41 with 95% confidence interval 40-43. For year 2019 the predicted value in De et al. (2016) [8] is 46 whether in study the predicted value is 39 with confidence interval of 95% 38-40. This shows that the state does not achieve the target in year 2019. Result also shows in 2020, in De et al. (2016) [8] the predicted value was 45 our result shows the predicted value 36 with 95% confidence interval 35-37. For year 2021, De et al. (2016) [8] predicted values 43, in study this value is 33 with 95% confidence interval 32-35. In case of year 2022 the predicted values for De et al. (2016) [8] is 42, in study predicted value is 31 with 95% confidence interval 29-32. For 2023 the predicted value in De et al. (2016) [8] is 41 and in study the predicted value is 30 with 95% confidence interval 28-31. For year 2024 the predicted value in De et al. (2016) [8] is 40 whether in study the predicted value is 28 with confidence interval of 95% 26-29. This shows that the state achieve the target in year 2024.
Predicted Values for Meghalaya
Result shows the predicted values for Meghalaya as 2015 SRS value is 42, our result shows the predicted value 45 with 95% confidence interval 40-50. For year 2016 SRS value is 39, in study this value is 38 with 95% confidence interval 36-49. In case of year 2017 predicted value is 37 with 95% confidence interval 34-48. For 2018 predicted value is 36 with 95% confidence interval 33-48. For year 2019 in study the predicted value is 35 with confidence interval of 95% 31-47. This shows that the state does not achieve the target in year 2019. Result also shows the predicted values in our study for 2020 is 32 with 95% confidence interval 30-47. For year 2021, in study this value is 31 with 95% confidence interval 19-44. In case of year 2022 the predicted values, in study predicted value is 30 with 95% confidence interval 17-44. For 2023 the predicted value, in study is 29 with 95% confidence interval 16-43. For year 2024 the predicted value in study is 28 with confidence interval of 95% 14-43. This shows that the state achieve the target in year 2024.
Predicted Values for Odisha
Result shows the predicted values for Odisha as in 2015 SRS value is 46, in De et al. (2016) [8] the predicted value was 48 our result shows the predicted value 45 with 95% confidence interval 44-47. For year 2016 SRS value is 44, De et al. (2016) [8] predicted values 46, in study this value is 42 with 95% confidence interval 41-44. In case of year 2017 the predicted values for De et al. (2016) [8] 45, in study predicted value is 41 with 95% confidence interval 40-43. For 2018 the predicted value in De et al.
(2016) [8] 44 and in study the predicted value is 39 with 95% confidence interval 38-40. For year 2019 the predicted value in De et al. (2016) [8] is 42 whether in study the predicted value is 36 with confidence interval of 95% 34-37. This shows that the state does not achieve the target in year 2019. Result also shows for 2020, in De et al. (2016) [8] the predicted value was 41 our result shows the predicted value 34 with 95% confidence interval 32-35. For year 2021, De et al. (2016) [8] predicted value 40, in study this value is 33 with 95% confidence interval 31-34. In case of year 2022 the predicted values for De et al. (2016) [8] 39, in study predicted value is 31 with 95% confidence interval 30-32. For 2023 the predicted value in De et al. (2016) [8] is 37 and in study the predicted value is 30 with 95% confidence interval 28-41. For year 2024 the predicted value in De et al. (2016) [8] is 36 whether in study the predicted value is 29 with confidence interval of 95% 27-30. Result shows the predicted values for state, in 2025, in De et al. (2016) [8] was 35 our result shows the predicted value 28 with 95% confidence interval 24-30. This shows that the state achieve the target in year 2025.
Predicted Values for Rajasthan
Result shows the predicted values for Rajasthan as in 2015 SRS value is 43, in De et al. (2016) [8] the predicted value was 38 our result shows the predicted value 43 with 95% confidence interval 41-44. For year 2016 SRS value is 41 De et al. (2016) [8] predicted values 36, in study this value is 40 with 95% confidence interval 39-42. In case of year 2017 the predicted values for De et al. (2016) [8] 35, in study predicted value is 38 with 95% confidence interval 36-39. For 2018 the predicted value in De et al.
(2016) [8] 33 and in study the predicted value is 35 with 95% confidence interval 33-37. For year 2019 the predicted value in De et al. (2016) [8] is 32 whether in study the predicted value is 33 with confidence interval of 95% 31-35. This shows that Country does not achieve the target in year 2019. In 2020, in De et al. (2016) [8] the predicted value was 30 our result shows the predicted value 30 with 95% confidence interval 28-32. For year 2021 De et al. (2016) [8] predicted values 29, in study this value is 28 with 95% confidence interval 25-30. Which interprets that Rajasthan will achieve the target in 2021.
Predicted Values for Uttar Pradesh
Result shows the predicted values for Uttar Pradesh as in 2015 SRS value is 46, in De et al. (2016) [8] the predicted value was 46 our result shows the predicted value 46 with 95% confidence interval 45-48. For year 2016 SRS value is 43 De et al. (2016) [8] predicted value 45, in study this value is 44 with 95% confidence interval 44-45. In case of year 2017 the predicted values for De et al. (2016) [8] 43, in study predicted value is 43 with 95% confidence interval 41-44. For 2018 the predicted value in De et al.
(2016) [8] 42 and in study the predicted value is 42 with 95% confidence interval 29-31. For year 2019 the predicted value in De et al. (2016) [8] is 40 whether in study the predicted value is 41 with confidence interval of 95% 40-43. This shows that the state does not achieve the target in year 2019.Result also shows the predicted values for Uttar Pradesh as in 2020, in De et al. (2016) [8] the predicted value was 39 our result shows the predicted value 39 with 95% confidence interval 37-40. For year 2021 De et al.
(2016) [8] predicted values 37, in study this value is 38 with 95% confidence interval 37-39. In case of year 2022 the predicted values for De et al. (2016) [8] 36, in study predicted value is 36 with 95% confidence interval 34-38. For 2023 the predicted value in De et al. (2016) [8] 34 and in study the predicted value is 34 with 95% confidence interval 32-35. For year 2024 the predicted value in De et al. (2016) [8] is 34 whether in study the predicted value is 32 with confidence interval of 95% 30-34. Result suggest that the predicted values for Uttar Pradesh as in 2025, in De et al. (2016) [8] the predicted value was 33 our result shows the predicted value 31 with 95% confidence interval 29-33. For year 2026, De et al. (2016) [8] predicted values 31, in study this value is 30 with 95% confidence interval 28-32. In case of year 2027 the predicted values for De et al. (2016) [8] 30, in study predicted value is 28 with 95% confidence interval 26-31. This shows that the state achieve the target in year 2027.
Predicted Values for Uttarakhand
Result shows the predicted values for Uttarakhand as in 2015 SRS value is 34, our result shows the predicted value 34 with 95% confidence interval 32-37. For year 2016 SRS value is 33, in study this value is 33 with 95% confidence interval 30-36. In case of year 2017 the predicted value is 32 with 95% confidence interval 29-35. For 2018 the predicted value in study is 31 with 95% confidence interval 28-35. For year 2019 the predicted value in study is 30 with confidence interval of 95% 27-34. This shows that the state does not achieve the target in year 2019. In 2020, our result shows the predicted value 30 with 95% confidence interval 26-33. For year 2021, in study this value is 29 with 95% confidence interval 24-33. In case of year 2022 the predicted values in study 28 with 95% confidence interval 23-23. This implies that the target will be achieved in 2022.
Predicted Values for India
Result shows the predicted values for India as in 2015 SRS value is 37, in De et al. (2016) [8] the predicted value was 38 our result shows the predicted value 37 with 95% confidence interval 36-38. For year 2016 SRS value is 34 De et al. (2016) [8] predicted values 36, in study this value is 36 with 95% confidence interval 35-40. In case of year 2017 the predicted values for De et al.
(2016) [8] 35, in study predicted value is 35 with 95% confidence interval 33-36. For 2018 the predicted value in De et al. (2016) [8] 34 and in study the predicted value is 33 with 95% confidence interval 32-35. For year 2019 the predicted value in De et al.
(2016) [8] is 33 whether in study the predicted value is 32 with confidence interval of 95% 31-34. This shows that Country does not achieve the target in year 2019. In 2020, in De et al. (2016) [8] the predicted value was 32 our result shows the predicted value 31 with 95% confidence interval 30-33. For year 2021 De et al. (2016) [8] predicted values 31, in study this value is 30 with 95% confidence interval 29-32. In case of year 2022 the predicted values for De et al. (2016) [8] 30, in study predicted value is 28 with 95% confidence interval 27-30. Which interprets that India will achieve the target in 2022.
Discussions and Conclusion
A thorough attempt of study on those states which cover the target of infant mortality of twenty eight per thousand at time point of end of year 2016 is made. Prediction are made up to different time years for different states as they can cover the set target in new national population policy (2017) of 28 infant death per thousand live births up to 2019. results shows that the states which can achieve the target in time of before that are Andhra Pradesh, Gujrat, Haryana, Jharkhand. Assam is 11 years behind the target time points. Bihar shows 4 year behind the target up to set time point. Chhatisgarh is 1 year behind the target of 2019. Result of Madhya Pradesh shows that this state is 5 year behind the target. Odisha is 7 year behind the target time point. Rajasthan shows its 2 year backwardness to target time point to achieve target. Uttar pradesh lies at 8 year behind the target in respect of the time point. Uttarakhad provides that it is 3 year behind the target. Study shows of all over India, The country itself 3 year behind the target of twenty eight infant deaths per thousand live births. This reflect that India can achieve the target if special focus on some states is been made. Results also reflects that the assumption in previous studies that if some new actual values are different from previously predicted values then whole other predicted values will be changed. It can be seen that when we include data of 2014 to 2016 Sample registration system for infant mortality is introduced the whole predicted values are changed from the prediction of previous study for the same methods. It also suggest that it is better to study the data time to time for better future planning.
Figures and tables from the paper
| Andhra Pradesh | — | Predicted values | — | 95% Confidence Interval | — |
|---|---|---|---|---|---|
| Year | SRS values | De et al. (2016) | In Paper | Lower | Upper |
| 2015 | 37 | 37 | 36 | 35 | 37 |
| 2016 | 34 | 36 | 34 | 33 | 35 |
| 2017 | 35 | 32 | 31 | 33 | |
| 2018 | 34 | 30 | 29 | 31 | |
| 2019 | 33 | 28 | 27 | 30 |
Table text extracted from the original PDF; superscript letters are shown inline. The original table image is below.
View original table image
| Assam | — | Predicted values | — | 95% Confidence Interval | — |
|---|---|---|---|---|---|
| Year | SRS values | De et al. (2016) | In Paper | Lower | Upper |
| 2015 | 47 | 52 | 49 | 47 | 50 |
| 2016 | 44 | 51 | 47 | 45 | 49 |
| 2017 | 50 | 45 | 43 | 47 | |
| 2018 | 49 | 43 | 41 | 45 | |
| 2019 | 48 | 41 | 39 | 44 | |
| 2020 | 47 | 40 | 37 | 42 | |
| 2021 | 46 | 38 | 35 | 41 | |
| 2022 | 45 | 37 | 34 | 39 | |
| 2023 | 44 | 36 | 33 | 39 | |
| 2024 | 43 | 35 | 32 | 38 | |
| 2025 | 42 | 34 | 31 | 37 | |
| 2026 | 41 | 33 | 30 | 35 | |
| 2027 | 40 | 32 | 29 | 36 | |
| 2028 | 39 | 31 | 27 | 34 | |
| 2029 | 38 | 29 | 25 | 33 | |
| 2030 | 36 | 28 | 23 | 31 |
Table text extracted from the original PDF; superscript letters are shown inline. The original table image is below.
View original table image
| Bihar | — | Predicted values | — | 95% Confidence Interval | — |
|---|---|---|---|---|---|
| Year | SRS values | De et al. (2016) | In Paper | Lower | Upper |
| 2015 | 42 | 39 | 41 | 38 | 43 |
| 2016 | 38 | 38 | 39 | 36 | 41 |
| 2017 | 37 | 37 | 35 | 40 | |
| 2018 | 36 | 36 | 33 | 39 | |
| 2019 | 35 | 34 | 31 | 37 | |
| 2020 | 34 | 32 | 29 | 36 | |
| 2021 | 33 | 31 | 27 | 34 | |
| 2022 | 32 | 29 | 25 | 33 | |
| 2023 | 31 | 27 | 23 | 31 |
Table text extracted from the original PDF; superscript letters are shown inline. The original table image is below.
View original table image
| Chhatisgarh | Predicted Values | — | 95% Confidence interval | — |
|---|---|---|---|---|
| Year | SRS values | In Paper | Lower | Upper |
| 2015 | 41 | 40 | 38 | 42 |
| 2016 | 39 | 37 | 35 | 39 |
| 2017 | 35 | 33 | 37 | |
| 2018 | 33 | 30 | 35 | |
| 2019 | 30 | 28 | 33 | |
| 2020 | 28 | 25 | 31 |
Table text extracted from the original PDF; superscript letters are shown inline. The original table image is below.
View original table image
| Gujrat | — | Predicted values | — | 95% Confidence Interval | — |
|---|---|---|---|---|---|
| Year | SRS values | De et al. (2016) | In Paper | Lower | Upper |
| 2015 | 33 | 34 | 33 | 32 | 35 |
| 2016 | 30 | 32 | 31 | 30 | 33 |
| 2017 | 31 | 29 | 28 | 31 | |
| 2018 | 30 | 27 | 26 | 29 |
Table text extracted from the original PDF; superscript letters are shown inline. The original table image is below.
View original table image
| Haryana | — | Predicted values | — | 95% Confidence Interval | — |
|---|---|---|---|---|---|
| Year | SRS values | De et al. (2016) | In Paper | Lower | Upper |
| 2015 | 39 | 34 | 36 | 35 | 38 |
| 2016 | 33 | 32 | 34 | 33 | 36 |
| 2017 | 31 | 32 | 30 | 34 | |
| 2018 | 30 | 30 | 28 | 32 | |
| 2019 | 29 | 28 | 26 | 30 |
Table text extracted from the original PDF; superscript letters are shown inline. The original table image is below.
View original table image
| Jharkhand | — | — | 95% Confidence Interval | — |
|---|---|---|---|---|
| Year | SRS values | Predicted Values | Lower | Upper |
| 2015 | 32 | 31 | 29 | 33 |
| 2016 | 29 | 29 | 26 | 32 |
| 2017 | 27 | 24 | 30 |
Table text extracted from the original PDF; superscript letters are shown inline. The original table image is below.
View original table image
| Madhya Pradesh | — | Predicted values | — | 95% Confidence Interval | — |
|---|---|---|---|---|---|
| Year | SRS values | De et al. (2016) | In Paper | Lower | Upper |
| 2015 | 50 | 51 | 49 | 47 | 50 |
| 2016 | 47 | 50 | 47 | 46 | 48 |
| 2017 | 49 | 44 | 43 | 45 | |
| 2018 | 47 | 41 | 40 | 43 | |
| 2019 | 46 | 39 | 38 | 40 | |
| 2020 | 45 | 36 | 35 | 37 | |
| 2021 | 43 | 33 | 32 | 35 | |
| 2022 | 42 | 31 | 29 | 32 | |
| 2023 | 41 | 30 | 28 | 31 | |
| 2024 | 40 | 28 | 26 | 29 |
Table text extracted from the original PDF; superscript letters are shown inline. The original table image is below.
View original table image
| Meghalaya | — | — | 95% Confidence Interval | — |
|---|---|---|---|---|
| Year | SRS values | Predicted Values | Lower | Upper |
| 2015 | 42 | 45 | 40 | 50 |
| 2016 | 39 | 38 | 36 | 49 |
| 2017 | 37 | 34 | 48 | |
| 2018 | 36 | 33 | 48 | |
| 2019 | 35 | 31 | 47 | |
| 2020 | 32 | 30 | 47 | |
| 2021 | 31 | 19 | 44 | |
| 2022 | 30 | 17 | 44 | |
| 2023 | 29 | 16 | 43 | |
| 2024 | 28 | 14 | 43 |
Table text extracted from the original PDF; superscript letters are shown inline. The original table image is below.
View original table image
| Odisha | — | Predicted values | — | 95% Confidence Interval | — |
|---|---|---|---|---|---|
| Year | SRS values | De et al. (2016) | In Paper | Lower | Upper |
| 2015 | 46 | 48 | 45 | 44 | 47 |
| 2016 | 44 | 46 | 42 | 41 | 44 |
| 2017 | 45 | 41 | 40 | 43 | |
| 2018 | 44 | 39 | 38 | 40 | |
| 2019 | 42 | 36 | 34 | 37 | |
| 2020 | 41 | 34 | 32 | 35 | |
| 2021 | 40 | 33 | 31 | 34 | |
| 2022 | 39 | 31 | 30 | 32 | |
| 2023 | 37 | 30 | 28 | 31 | |
| 2024 | 36 | 29 | 27 | 30 | |
| 2025 | 35 | 28 | 24 | 30 |
Table text extracted from the original PDF; superscript letters are shown inline. The original table image is below.
View original table image
| Rajasthan | — | Predicted values | — | 95% Confidence Interval | — |
|---|---|---|---|---|---|
| Year | SRS values | De et al. (2016) | In Paper | Lower | Upper |
| 2015 | 43 | 38 | 43 | 41 | 44 |
| 2016 | 41 | 36 | 40 | 39 | 42 |
| 2017 | 35 | 38 | 36 | 39 | |
| 2018 | 33 | 35 | 33 | 37 | |
| 2019 | 32 | 33 | 31 | 35 | |
| 2020 | 30 | 30 | 28 | 32 | |
| 2021 | 29 | 28 | 25 | 30 |
Table text extracted from the original PDF; superscript letters are shown inline. The original table image is below.
View original table image
| Uttar Pradesh | — | Predicted values | — | 95% Confidence Interval | — |
|---|---|---|---|---|---|
| Year | SRS values | De et al. (2016) | In Paper | Lower | Upper |
| 2015 | 46 | 46 | 46 | 45 | 48 |
| 2016 | 43 | 45 | 44 | 42 | 45 |
| 2017 | 43 | 43 | 41 | 44 | |
| 2018 | 42 | 42 | 40 | 43 | |
| 2019 | 40 | 41 | 40 | 43 | |
| 2020 | 39 | 39 | 37 | 40 | |
| 2021 | 37 | 38 | 37 | 39 | |
| 2022 | 36 | 36 | 34 | 38 | |
| 2023 | 35 | 34 | 32 | 35 | |
| 2024 | 34 | 32 | 30 | 34 | |
| 2025 | 33 | 31 | 29 | 33 | |
| 2026 | 31 | 30 | 28 | 32 | |
| 2027 | 30 | 28 | 26 | 31 |
Table text extracted from the original PDF; superscript letters are shown inline. The original table image is below.
View original table image
| Uttarakhand | — | — | 95% Confidence Interval | — |
|---|---|---|---|---|
| Year | SRS values | Predicted Values | Lower | Upper |
| 2015 | 34 | 34 | 32 | 37 |
| 2016 | 33 | 33 | 30 | 36 |
| 2017 | 32 | 29 | 35 | |
| 2018 | 31 | 28 | 35 | |
| 2019 | 30 | 27 | 34 | |
| 2020 | 30 | 26 | 33 | |
| 2021 | 29 | 24 | 33 | |
| 2022 | 28 | 23 | 32 |
Table text extracted from the original PDF; superscript letters are shown inline. The original table image is below.
View original table image
| India | — | Predicted values | — | 95% Confidence Interval | — |
|---|---|---|---|---|---|
| Year | SRS values | De et al. (2016) | In Paper | Lower | Upper |
| 2015 | 37 | 38 | 37 | 36 | 38 |
| 2016 | 34 | 36 | 36 | 35 | 40 |
| 2017 | 35 | 35 | 34 | 36 | |
| 2018 | 34 | 33 | 32 | 35 | |
| 2019 | 33 | 32 | 31 | 34 | |
| 2020 | 32 | 31 | 30 | 33 | |
| 2021 | 31 | 30 | 29 | 32 | |
| 2022 | 30 | 28 | 27 | 30 |
Table text extracted from the original PDF; superscript letters are shown inline. The original table image is below.
View original table image
References
12 in the original paper- Monteiro C, Mondini L, de souza ALM, Popkin B. The nutrition transition in Brazil. European journal of clinical nutrition. 1995; 49:105-13.
- Box GE, Jenkins GM, Reinsel GC, Ljung GM. Time series analysis: forecasting and control. John Wiley & Sons, 2015.
- Besag JE. Discussion of the paper by grenander and miller. Journal of the Royal Statistical Society, Series B. 1994; 56:591592.
- Bhan MK. Accelerated progress to reduce under-5 mortality in India. Open Access. 2013; 13:70076-70077.
- Benicio M, Monteiro C, de Souza JM, Castilho E, Reis I. Multivariate analysis of risk factors for low birth weight in live births in the municipality of São Paulo, SP (Brazil). Revista de saúde pública. 1985; 19:311-20.
- Ahmad OB, Lopez AD, Inoue M. The decline in child morality:. a repprasial bulletin of World Health Orgnization. 2000; 78(10):1175-1191.
- De P. A Temporal and Spatial Dimension of Under Five Mortality with Emphasis on Impact of National Health Programme: For the Period 1976-2004. PhD thesis, Jadhavpur University, 2011.
- De P, Sahu D, Pandey A, Gulati BK, Chandhiok N, Shukla A et al. Post Millennium Development Goals Prospect on Child Mortality in India: An Analysis Using Autoregressive Integrated Moving Averages (ARIMA) Model. Health. 2016; 08:18451872.
- Tripathi PK, Mishra RK. Upadhyay SK. Bayes and Classical Prediction of Total Fertility Rate of India Using Autoregressive Integrated Moving Average Model, J Stat. Appl. Pro. 2018; 7(2):233-244 233.
- UN. World population prospects: the revision, 2012.
- WHO. Primary health care: Report of the international conference on primary health care. In Alma Ata, USSR, 6-12 September, 1978.
- WHO. World health chart. In Karolinka Institute/ Lund University SIDA, 2001.
Cited by 4
From OpenAlex, OpenCitations and reference lists read by Scinovex
- Auto-Regressive Integrated Moving Average Model (ARIMA): conceptual and methodological aspects and applicability in infant mortality ↗
Aline Beatriz dos Santos Silva, Ana Catarina de Melo Araújo, Paulo Germano de Frias, Mirella Bezerra Rodrigues Vilela, Cristine Vieira do Bonfim · Revista Brasileira de Saúde Materno Infantil · 2021
Abstract This reflective theoretical article, aims to discuss conceptual and methodological aspects about the applications of time series modeling, in particular, the Integrated Auto-regressive Moving Average model and its applicability in infant mortality. This modeling makes it possible to predict future values using past data, outlining and estimating possible scenarios of the health event, highlighting its magnitude. Due to the…
❝ 13PDF - Análisis temporal de la mortalidad por causas evitables en las primeras 24 horas de vida, 2000-2021 ↗
Aline Beatriz dos Santos Silva, Luciana Scarlazzari Costa, Paulo Germano de Frias, Ana Catarina de Melo Araújo, Cristine Vieira do Bonfim · Revista Latino-Americana de Enfermagem · 2023
OBJECTIVE: to analyze the temporal pattern and estimate mortality rates in the first 24 hours of life and from preventable causes in the state of Pernambuco from 2000 to 2021. METHOD: an ecological study, using the quarter as the unit of analysis. The data source was made up of the Mortality Information System and the Live Birth Information System. The…
❝ 2PDF - Temporal analysis of mortality from preventable causes in the first 24 hours of life, 2000-2021 ↗
Aline Beatriz dos Santos Silva, Luciana Scarlazzari Costa, Paulo Germano de Frias, Ana Catarina de Melo Araújo, Cristine Vieira do Bonfim · Revista Latino-Americana de Enfermagem · 2023
Objective: to analyze the temporal pattern and estimate mortality rates in the first 24 hours of life and from preventable causes in the state of Pernambuco from 2000 to 2021. Method: an ecological study, using the quarter as the unit of analysis. The data source was made up of the Mortality Information System and the Live Birth Information System. The…
❝ 0PDF - Análise temporal da mortalidade por causas evitáveis nas primeiras 24 horas de vida, 2000-2021 ↗
Aline Beatriz dos Santos Silva, Luciana Scarlazzari Costa, Paulo Germano de Frias, Ana Catarina de Melo Araújo, Cristine Vieira do Bonfim · Revista Latino-Americana de Enfermagem · 2023
Objetivo: analisar o padrão temporal e estimar as taxas de mortalidade nas primeiras 24 horas de vida e por causas evitáveis no estado de Pernambuco no período de 2000 a 2021. Método: estudo ecológico, tendo como unidade de análise o trimestre. A fonte de dados foi constituída pelo Sistema de Informações sobre Mortalidade e pelo Sistema de Informações sobre Nascidos…
❝ 0PDF