
Research article · 2018 · Full text
International Journal of Statistics and Applied MathematicsCost, revenue and profit efficiency of private sector banks in India-DEA approach
Volume 3(3) · Pages 70–73
Research areasEfficiency Analysis Using DEABanking Sector Performance and Management
Abstract
Author-writtenThe most powerful technique for measuring relative efficiency of a set of decision making units (DMUs) is Data Envelopment Analysis (DEA). DEA is one of the most important tools to deal with the aspects of cost minimization efficiency, revenue and profit maximization efficiency of Decision making units. The objective of the study is to compare the performance of the Indian Private Sector banks over the period 2015-16. This study demonstrates the identification of cost, revenue and profit efficient DMUs under variable returns to scale (VRS). Empirical investigation of this study indicates that more number of DMUs are profit efficient and the level of average cost efficiency is highest than the level of average Revenue efficiency and the average profit efficiency.
Summary
Source-checkedPlain-language reading of the full paper, prepared with AI and checked against the text. Each point links to the authors' own words.
Why it matters
- Measuring the performance of the banking system is critical because it can impact the overall stability of the banking industry. View evidence ↗
- Data Envelopment Analysis (DEA) is a powerful technique used to measure relative efficiency regarding cost minimization and revenue and profit maximization. View evidence ↗
- For firms aiming to make a profit, profit efficiency provides more comprehensive information than cost efficiency alone. View evidence ↗
The question
- The study aims to compare the performance of private sector banks in India during the 2015-16 period. View evidence ↗
What they did
- The analysis was conducted on 21 private sector banks, using three input variables and three output variables for each. View evidence ↗
- The inputs measured were deposits, labour, and fixed assets, while the outputs were loans, other assets, and investments. View evidence ↗
- The study identified cost, revenue, and profit efficient decision-making units (DMUs) using the variable returns to scale (VRS) assumption. View evidence ↗
What they found
- Six banks (DMUs 10, 11, 15, 16, 19, and 21) were found to be cost efficient. View evidence ↗
- Six banks (DMUs 10, 13, 15, 16, 19, and 21) were identified as revenue efficient. View evidence ↗
- Seven banks (DMUs 10, 11, 13, 15, 16, 19, and 21) were found to be profit efficient. View evidence ↗
- Three banks (DMUs 11, 19, and 21) achieved full efficiency across all three measures: cost, revenue, and profit. View evidence ↗
- The average efficiency scores were 0.723 for cost, 0.710 for revenue, and 0.424 for profit. View evidence ↗
- The study found that a higher number of banks were profit efficient, and the average cost efficiency was higher than both average revenue and profit efficiency. View evidence ↗
What it means
- The authors conclude that banks lacking cost efficiency should reduce their use of expensive inputs to improve their efficiency levels. View evidence ↗
- The authors state that overall profit efficiency represents the potential for profit increase if inputs and outputs are used in an optimal combination. View evidence ↗
Visual summary
1 visualsIllustrations explain the paper; charts are replotted from the paper's own table values.
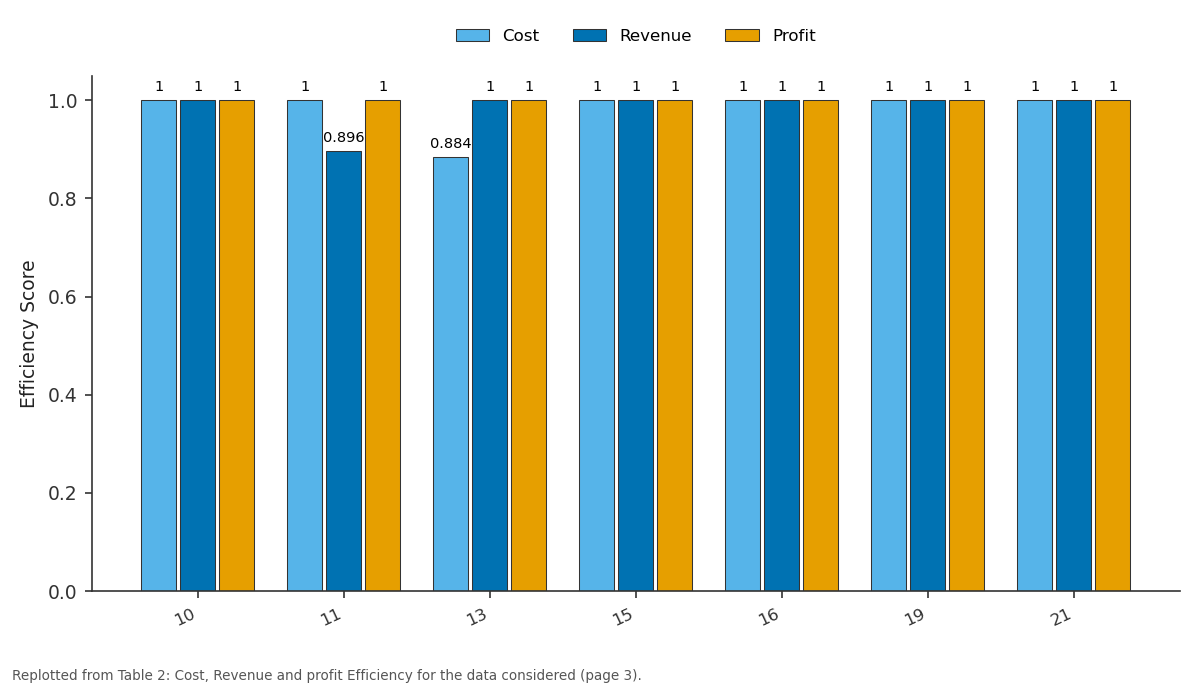
Cost and Revenue and more: 10 vs 11 vs 13 vs 15 vs 16
Replotted from Table 2 (page 3) of the original paper. Every bar is the paper's own table value.
View source evidence ↗Figures & tables
From the original paper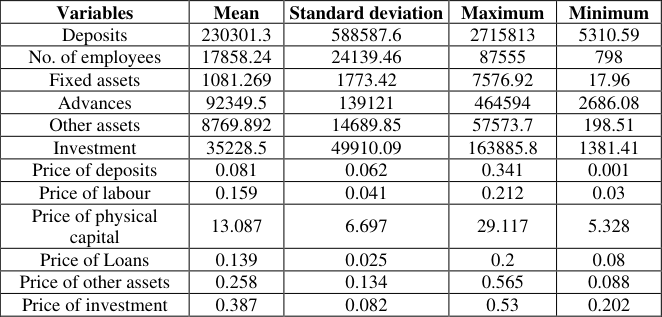 Table 1
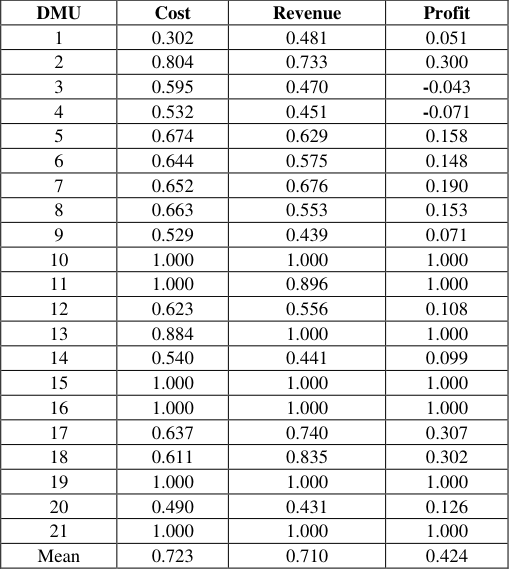 Table 2
Introduction
Present days Performance of Banks and other financial institutions is very important issues for discussion. Performance measurement of banking system is one of the vital issues in financial market because it could affect the stability of banking industry. It is fact that there are many approaches to define efficiency in the modern society. provided the first measure of efficiency and basic definition of efficiency is based on was the first to define the concept of Technical Efficiency (TE). There is a great variety of DEA models to measure the efficiency of Decision making units (DMU). But initially the basic DEA model is proposed by charnes, cooper and Rhodes (CCR 1978) and then followed by Banker, charnes and cooper (BCC 1984). CCR model is based on "constant return to scale (CRS)" assumption under BCC model admits "variable returns to scale" (VRS) assumptions Then based on the above models Cost, Revenue and Profit DEA models are developed. The efficiency value calculated in CCR is the "over all Technical efficiency" (OTE), whereas the efficiency value computed by BCC is "Pure technical efficiency" (PTE). In cost minimization process, a firm would seek to minimize the total input cost for a given level of output and in revenue maximization it would look for maximizing the output thereby total revenue for a given level of input. In profit maximization, the objective of the firm would be to select such an input-output mix that generates maximum revenue with minimum cost, for given input and output prices. Thus, maximizing revenue is as much a necessary condition as cost minimization for the maximizing profit. Hence for a profit-making firm, profit efficiency is more important source of information than the cost efficiency, which provides partial information (Ray and Das, 2010) [13] . The objective of this study is to evaluate the performance of the banks in India during 2015-2016, using cost, revenue and profit models of DEA. The structure of the paper is as follows. The review of relevant literature is described in section 1.2. Section 1.3. Contains the methodology used in this study Section 1.4 carries Empirical investigation relating to measuring Cost, revenue and profit efficiency of Private sector banks. Finally, Section 1.5 provides the results and conclusions.
Review of literature
Data envelopment analysis is a non-parametric mathematical modeling technique based on linear programming for frontier estimation. The basic DEA models were discussed earlier in the introduction part and these models have been developed in input and output-oriented both. CCR and BCC models are applied in many areas by various authors. Sherman and Gorld (1985) [15] applied DEA in banking sector as the first and evaluated operating efficiency of 14 saving bank branches, Pastor et al. (1997) applied DEA to analyze the performance of banks in US and selected countries of Europe Casu and Molyneux (2003) [6] studied efficiency of 750 selected European banks through intermediation approach. Prasuna (2004) [12] , analyzed the performance of Indian banks by adopting the CAMEL Model. The performance of 65 banks were studied for the period 2003-04. The author concluded that the competition was tough and consumers benefited from better services quality, innovative products and better bargains. Asmild et al. (2004) [2] implements DEA window and malquist index to analyze the performance of Canadian banking industry over time. Herrmann et al. (2006) [8] carried a study German universal bank and analyze their level of efficiency based on both efficiency models namely stochastic frontier approach and Data envelopment analysis. Ray and Das (2010) [13] applied DEA to analyze the cost and profit efficiency of Indian banks during the post reformed period. They identified public sector banks are more efficients comparatively private sector banks and small banks which are operating below the efficiency frontier. Kaur and Kaur (2010) [9] investigated impact of the merges on the cost efficiency of Indian commercial banks by applied DEA. Das and Kumhakar (2012) [7] used hedonic aggregator function to study the productivity and efficiency of Indian banks. From this study they observed the efficiency of public sector bank exceeds the efficiency of private sector banks in the post-reform period 1996-2005. Kristina Kocisova (2014) [10] applied DEA to measure Cost, revenue and profit efficiency of Slovak and Czech commercial banks during 2009-2013. Saha et al. (2015) [14] found that size, capital and profit of Malaysian banking system have significantly positive relationship with efficiency but expenses and non-performing loans have significantly negative relationship with the efficiency. Md. Qamruzzaman and WEI Jianguo (2016) [17] identified financial efficiency level of financial institutions (banks) in Bangladesh over the period 2011-2015. Their study revealed that above 62% of the banks performing efficiently under CRS assumption and 75% banks performing efficient under VRS assumption in respect of both input and output orientation. Tugba Eyceyurt Batir et al. (2017) [16] examined the technical, allocative and cost efficiency of conventional and participation bank in Turkey using DEA and they observed average efficiency of participation banks is higher than the average efficiency of conventional banks each year.
Data and methodology
In this study the data analyzed is collected from the performance highlights of Indian banking sector published by Indian bank association, Mumbai, during 2015-2016. The author of this paper considered 21 private sector banks and each includes three inputs and three outputs for the performance analysis. The following are the 21 private sector banks and each bank is considered as the DMU in the study 1. City union Bank 2. Tamil Nadu Mercantile Bank 3 Catholic Syrian Bank 4. Dhanlaxmi Bank 5. Federal Bank 6. Jammu & Kashmir Bank 7. The Karnataka Bank 8. The Karur Vysya Bank Ltd. 9. The Lakshmi Vilas Bank 10. The Nainital Bank Ltd. 11. Ratnaker Bank 12. The South Indian Bank Ltd. 13 Since price data in respect of both inputs and outputs are available, attempts have been made to compute Cost, Revenue and profit efficiency and the same have been presented in this paper. The variables included in this study are Deposits, labour and fixed assets as inputs and Loans, Other assets, investments as outputs. The corresponding input and output prices are respectively w 1 : price of deposit, w 2 : price of labour, w 3: price of physical capital and Meanwhile, three output prices are p 1 : price of loans, p 2 : price of other earning assets, p 3 : price of investment. The above input and output prices are calculated as followes, w1: price of labour = personnel expenses/labour w2: Price of Deposits=Total interest expenses/deposits w3: price of physical capital= other operating expenses/fixed assets p1: Price of loans =interest income/loans p2: Price of other earning assets= other interest income/other earning assets p3: price of investments = Total income/ total investments Where, w iq : vector of input prices of DMUq X* iq : cost minimizing vector of input quantities for DMUq, given the input prices w iq and the output levels y rq . Overall cost efficient: Revenue Maximization model:
Where, P rq : vector of output prices of DMUq and x * iq : revenue maximizing vector of output quantities for DMUq, given the output prices P rq and th input levels X iq . Overall Revenue maximization:
Profit Maximization model: Where all notations have same meaningsimilar to the previous models. Overall Profit efficient:
The cost, revenue and profit efficiency scores are bounded within the range 0 and 1.
Empirical analysis
It is quite general to carryout basic statistical measure to verify the validity of any data so some basic measures namely mean, standard deviation etc. Have been calculated for the data taken for this study and the same is presented in the table.
Figures and tables from the paper
| Variables | Mean | Standard deviation | Maximum | Minimum |
|---|---|---|---|---|
| Deposits | 230301.3 | 588587.6 | 2715813 | 5310.59 |
| No. of employees | 17858.24 | 24139.46 | 87555 | 798 |
| Fixed assets | 1081.269 | 1773.42 | 7576.92 | 17.96 |
| Advances | 92349.5 | 139121 | 464594 | 2686.08 |
| Other assets | 8769.892 | 14689.85 | 57573.7 | 198.51 |
| Investment | 35228.5 | 49910.09 | 163885.8 | 1381.41 |
| Price of deposits | 0.081 | 0.062 | 0.341 | 0.001 |
| Price of labour | 0.159 | 0.041 | 0.212 | 0.03 |
| Price of physical capital | 13.087 | 6.697 | 29.117 | 5.328 |
| Price of Loans | 0.139 | 0.025 | 0.2 | 0.08 |
| Price of other assets | 0.258 | 0.134 | 0.565 | 0.088 |
| Price of investment | 0.387 | 0.082 | 0.53 | 0.202 |
Table text extracted from the original PDF; superscript letters are shown inline. The original table image is below.
View original table image
| DMU | Cost | Revenue | Profit |
|---|---|---|---|
| 1 | 0.302 | 0.481 | 0.051 |
| 2 | 0.804 | 0.733 | 0.300 |
| 3 | 0.595 | 0.470 | -0.043 |
| 4 | 0.532 | 0.451 | -0.071 |
| 5 | 0.674 | 0.629 | 0.158 |
| 6 | 0.644 | 0.575 | 0.148 |
| 7 | 0.652 | 0.676 | 0.190 |
| 8 | 0.663 | 0.553 | 0.153 |
| 9 | 0.529 | 0.439 | 0.071 |
| 10 | 1.000 | 1.000 | 1.000 |
| 11 | 1.000 | 0.896 | 1.000 |
| 12 | 0.623 | 0.556 | 0.108 |
| 13 | 0.884 | 1.000 | 1.000 |
| 14 | 0.540 | 0.441 | 0.099 |
| 15 | 1.000 | 1.000 | 1.000 |
| 16 | 1.000 | 1.000 | 1.000 |
| 17 | 0.637 | 0.740 | 0.307 |
| 18 | 0.611 | 0.835 | 0.302 |
| 19 | 1.000 | 1.000 | 1.000 |
| 20 | 0.490 | 0.431 | 0.126 |
| 21 | 1.000 | 1.000 | 1.000 |
| Mean | 0.723 | 0.710 | 0.424 |
Table text extracted from the original PDF; superscript letters are shown inline. The original table image is below.
View original table image
References
17 in the original paper- Ariff M, Can L. Cost and profit efficiency of Chinese banks: A non-parametric analysis. China Economic Review. 2008; 19:260-273.
- Asmild M, JcParadi Aggarwall C. Schaffinet Combining DEA window Analysis with the Malmquist Index Approach in a study of the Canadian Banking Industry JPA. 2004; 21(1):67-89.
- BADER MKI. Cost, Revenue, and Profit Efficiency of Islamic Versus Conventional Banks: International Evidence Using Data Envelopment Analysis. Islamic Economic Studies. 2008; 2:23-70.
- Banker RD, Charnes A, Cooper WW. Some Models for Estimating Technical and Scale Inefficiencies in Data Envelopment Analysis. Management Science. 1984; 9:1078-1092.
- Charnes A, Cooper WW, Rhodes E. Measuring the efficiency of decision making units. European Journal of Operational Research. 1978; 2(6):429-444.
- Casu B, Molyneux PA. Comparative Study of Efficiency in European Banking. Applied Economics. 2003; 17:18651876.
- Das A, Kumbhakar SC. Productivity and efficiency dynamics in Indian banking: An input distance function approach incorporating quality of inputs and outputs function approach incorporating quality of inputs and outputs. Journal of Applied Econometrics. 2012; 27(2):205-234.
- Heinz Herrmann TLH. The cost efficiency of German banks: a comparison of SFA and DEA. Germany: Deutsche Bundesbank, 2006.
- Kaur Pardeep, kaur Gian. Impact of Mergers on the Cost Efficiency of Indian Commercial Banks. Eurasian Journal of Business and Economics. 2010; 3(5):27-50.
- Kristina Kocisova. Application of Data Envelopment Analysis to Measure Cost, Revenue and Profit Efficiency of Slovak and czech commercial banks, 2014.
- Maudos J, Pastor JM, Pe´rez F, Quesada J. Cost and profit efficiency in European banks. J Int. Financ. Mark. Inst. Money. 2002; 12:76-85.
- Prasuna DG. Performance Snapshot 2003-04, chartered Financial Analyst. 2004; X(11):6-13.
- Ray S, Das A. Distribution of cost and profit efficiency: evidence from Indian banking. European Journal of Operational Research. 2010; 201(1):297-307.
- Saha A, Ahmad NH, Dash U. Drivers of technical efficiency in Malaysian banking: A new empirical insight. Asian-Pacific Economic Literature. 2015; 29(1):161-173. http://dx.doi.org/10.1111/apel.12091.
- Sherman HD, Gold F. Bank branch operating efficiency: Evaluation with data envelopment analysis. Journal of Banking & Finance. 1985; 9(2):297-315. http://dx.doi.org/10.1016/0378-4266 (85)90025-1.
- Tugba Eyceyurt Batir. Determinants of bank efficiency in Turkey: Participation banks versus conventional banks journal of Borsa Istanbul Review 17-2, 86-96. Drivers of technical efficiency in Malaysian banking: A new empirical insight. Asian-Pacific Economic Literature. 2017; 29(1):161-173. http://dx.doi.org/10.1111/apel.12091.
- Md. Qamruzzaman. An Assessment of Financial Efficiency using Data Envelopment Analysis (DEA)- Multistage Approach: A Case Study of Banks in Bangladesh. IOSR Journal of Economics and Finance. 2016; 7(6):96-103. ISSN: 2321-5933, p-ISSN: 2321-5925.