
Research article · 2018 · Full text
International Journal of Statistics and Applied MathematicsBayesian approximation of the reliability function of the three parameter generalized compound Rayleigh distribution under the squared error loss function
Volume 3(3) · Pages 19–28
Research areasStatistical Distribution Estimation and ApplicationsReliability and Maintenance OptimizationProbabilistic and Robust Engineering Design
Abstract
Author-writtenLife testing and reliability theory is a very important branch of Engineering Statistics. Over the years reliability estimation methods based on sampling theory have been found to be extremely useful for a wide variety of problems. There are, however, many instances in which the classical methods have been found to be less than satisfactory. The main objective of the paper is to obtain the Bayes estimate of reliability function of Generalized Compound Rayleigh distribution (re-parameterized) assuming all the parameters unknown under the squared error loss function. Then by using Lindley approximation procedure we have obtain the Approximate Bayes estimate of reliability function of the Generalized Compound Rayleigh distribution under SELF. We also analyze the sensitivity of Approximate Bayes Estimate of model and presented a numerical study to illustrate the above technique on generated observations. The comparison is done by using R-programming.
Summary
Source-checkedPlain-language reading of the full paper, prepared with AI and checked against the text. Each point links to the authors' own words.
Why it matters
- Life testing and reliability theory are critical components of engineering statistics. View evidence ↗
- Classical reliability estimation methods based on sampling theory are sometimes unsatisfactory. View evidence ↗
- Bayesian methods are beneficial because they allow for the explicit organization of prior knowledge or ignorance. View evidence ↗
The question
- The study aims to determine the Bayes estimate of the reliability function for a re-parameterized Generalized Compound Rayleigh distribution with unknown parameters under a squared error loss function. View evidence ↗
What they did
- The authors used the Lindley approximation procedure to obtain the Approximate Bayes estimate of the reliability function. View evidence ↗
- Numerical calculations and simulations were performed using the R programming language. View evidence ↗
- The study evaluated Maximum Likelihood Estimators (MLE) and Approximate Bayes estimators using sample sizes from 10 to 80, repeating the process 500 times to calculate Mean Squared Errors (MSE). View evidence ↗
- For the simulations, the parameters were set to α = 1, β = 0.5, and γ = 0.8. View evidence ↗
What they found
- All three tested estimators were found to be efficient when the sample size was n=50. View evidence ↗
- The Mean Squared Errors (MSE) for the estimators began to increase as the sample size approached 70. View evidence ↗
- The Approximate Bayes estimator (R̂ABS) demonstrated superior performance compared to the other estimators. View evidence ↗
What it means
- The authors conclude that the Approximate Bayes estimator is the most effective method among those compared for this distribution. View evidence ↗
Visual summary
1 visualsIllustrations explain the paper; they do not show study data.
Bayesian Estimation Workflow
AI-generated conceptual illustration (A mathematical probability distribution curve and a computational processing pipeline). It explains the idea and does not show study data.
View source evidence ↗Figures & tables
From the original paper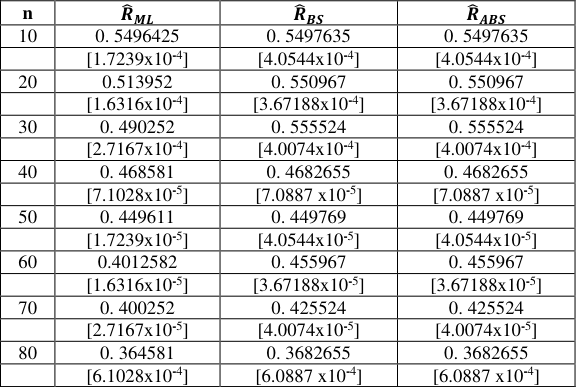 Table 1
Introduction
Reliability engineering concerned with the ability of a system or component to perform its required functions under stated conditions for a specified time. When a manufacturer floats a new product in the market, he would like his customer to have some information the reliability of product with regards to its performance. In this process he would like to know the answers of the questions that what is the probability that the item will fail in the time interval [𝑡, 𝑡 + ∆𝑡] given that it was working at the time t, or when customer purchases some items e.g. refrigerator, an air conditioner or a LED bulb etc., he thinks about the life of the item means some prior knowledge about its mean life and variance etc. Since the failure of the item may occur at any time and is affected by random causes, it may assumed the failure time (T) is a random variable. Over the years reliability estimation methods based on sampling theory have been found to be extremely useful for a wide variety of problems. There are, however, many instances in which the classical methods have been found to be less than satisfactory. Increasing instance of cost-effectiveness in reliability testing programs has had a decreasing effect on the case for consideration of sampling theory methods. If one were to consider only the use of sampling theory methods, one would be extremely limited, because of cost and time constraints, to a very small number of samples. Such a limited sample size would result in either very low level of confidence in the reliability estimate or imprecise estimates. Grohowski, Hausman, and Lamberson (1976) [5] . For the reason such as these, clauses in military and government reliability contracts permit other methods such as Bayesian procedures, with the onus of justification put on the producer. There are several benefits in using Bayesian methods in reliability. First of all, it is important to recognize that all the inferential theories whether the sampling theory, Bayesian theory likelihood or otherwise, requires some degree of subjectivity in their use. And only Bayesian method provides a satisfactory way of explicitly introducing and organizing assumptions regarding prior knowledge or ignorance. Evans (1969) the distribution function of failure time is given by F(𝑡)=[𝑇 < 𝑡 <] which is the probability that the item will survive till time't', and Let f (𝑡) be the probability density function of the random variable 'T' (Sinha, S.K, 1986) [12] . Consider the function
The function h (t) is called the hazard rate or instantaneous failure rate. Let
Denote the failure free operation till time't', then it is quite evident that the stochastic behavior of time may be studied through either of the four functions, f(t), F(t), R(t) or h(t). Here, Reliability Function
Failure Rate density Function
Now, since Failure Rate distribution function
Various life time distributions may be classified according to behavior of the function h (t). If h(t) is increasing, decreasing or constant function of 't' it has the direct physical meaning that more the chronological age of the item more, less or equal are the chances of failure of an item. (Sinha, S.K, 1986) [12] . The Bayesian inference procedures have been developed generally under squared error loss function 𝐿 (𝑅 ̂(𝑡), 𝑅(𝑡)) = (𝑅 ̂(𝑡) -𝑅(𝑡))
The Generalized Compound Rayleigh Distribution is a special case of the three-parameter Burr type XII distribution. Considered it as a gamma mixture of Rayleigh distribution and obtained the compound Rayleigh model with unimodal hazard function. This unimodal hazard function is generalized and a flexible parametric model is thus constructed, which embeds the compound Rayleigh model, by adding shape parameter. Bain and Engelhardt (1991) [1] studied this distribution (also known as the Compound Weibull distribution from a Poisson perspective. The Generalized Compound Rayleigh Distribution is a special case of the three-parameter Burr type XII distribution with probability density function (p.d.f.) re-parameterized 𝛾 𝑎𝑠 = 0 (2.6)
Respectively. Applying the Newton-Raphson method 𝛼 ̂𝑀𝐿𝐸 and 𝛽 ̂𝑀𝐿𝐸 can be derived and then from them 𝛾 ̂𝑀𝐿𝐸 can be obtained. The MLE's of 𝑅(𝑡) are given respectively by replacing 𝛼, 𝛽 𝑎𝑛𝑑 𝛾 𝑏𝑦 𝛼 ̂𝑀𝐿 , 𝛽 ̂𝑀𝐿 𝑎𝑛𝑑 𝛾 ̂𝑀𝐿 on the value obtained by solving the equation (1.3).
Bayes estimated for 𝜸 with known parameter 𝜶 𝒂𝒏𝒅 𝜷 under SELF
If 𝛼 ̂ and 𝛽 ̂ is known we assume 𝛾(𝑎, 𝑏) as conjugate prior for 𝛾 as
Combining the likelihood function equation (2.1) and prior density equation (2.8), we obtain the posterior density of 𝛾 in the form;
Bayes Estimate of Reliability function of Generalized Compound Rayleigh distribution
The posterior mean of the Reliability function of the Generalized Compound Rayleigh distribution is obtained by substituting R=(
This is the posterior mean of the reliability function of Generalized Compound Rayleigh distribution.
Bayes Estimate of R under Squared Error Loss Function (SELF)
The Bayes estimator of reliability function of generalized Compound Rayleigh Distribution under squared error loss function is given by
Bayes Estimators with unknown parameters𝜶, 𝜷 and 𝜸
The joint prior density of 𝛼, 𝛽, 𝛾 is given by
The joint posterior with likelihood equation ( 2
Lindley Approximation Procedures
The ratio of integrals in equation (3.7) does not seem to take a closed form so we must consider the Lindley approximation procedure as 𝐸(𝜇(𝜃, 𝑝)|𝑥) = ∫ 𝜇(𝜃).𝑒 (𝑙(𝜃)+𝜌(𝜃)) 𝑑𝜃 ∫ 𝑒 (𝑙(𝜃)+𝜌(𝜃)) .𝑑𝜃 (3.7a) Lindley developed approximate procedure for evaluation of posterior expectation of 𝜇(𝜃). Several other authors have used this technique to obtain Bayes estimators (see Sinha (1986) [12] , Sinha and sloan (1988) [13] , Soliman (2001)) [15] . The posterior expectation of Lindley approximation procedure to evaluate of 𝜇(𝜃) in equation (3.7a) under SELF, where where𝜌(𝜃) = log 𝑔(𝜃), and 𝑔(𝜃) is an arbitrary function of 𝜃 and 𝑙(𝜃) is the logarithm likelihood function (Lindley (1980)) [6] .
Figures and tables from the paper
| n | 𝑹̂ 𝑴𝑳 | 𝑹̂ 𝑩𝑺 | 𝑹̂ 𝑨𝑩𝑺 |
|---|---|---|---|
| 10 | 0. 5496425 | 0. 5497635 | 0. 5497635 |
| [1.7239x10⁻⁴] | [4.0544x10⁻⁴] | [4.0544x10⁻⁴] | |
| 20 | 0.513952 | 0. 550967 | 0. 550967 |
| [1.6316x10⁻⁴] | [3.67188x10⁻⁴] | [3.67188x10⁻⁴] | |
| 30 | 0. 490252 | 0. 555524 | 0. 555524 |
| [2.7167x10⁻⁴] | [4.0074x10⁻⁴] | [4.0074x10⁻⁴] | |
| 40 | 0. 468581 | 0. 4682655 | 0. 4682655 |
| [7.1028x10⁻⁵] | [7.0887 x10⁻⁵] | [7.0887 x10⁻⁵] | |
| 50 | 0. 449611 | 0. 449769 | 0. 449769 |
| [1.7239x10⁻⁵] | [4.0544x10⁻⁵] | [4.0544x10⁻⁵] | |
| 60 | 0.4012582 | 0. 455967 | 0. 455967 |
| [1.6316x10⁻⁵] | [3.67188x10⁻⁵] | [3.67188x10⁻⁵] | |
| 70 | 0. 400252 | 0. 425524 | 0. 425524 |
| [2.7167x10⁻⁵] | [4.0074x10⁻⁵] | [4.0074x10⁻⁵] | |
| 80 | 0. 364581 | 0. 3682655 | 0. 3682655 |
| [6.1028x10⁻⁴] | [6.0887 x10⁻⁴] | [6.0887 x10⁻⁴] |
Table text extracted from the original PDF; superscript letters are shown inline. The original table image is below.
View original table image
References
16 in the original paper- Bain LJ, Engelhardt M. Statistical analysis of reliability and life testing models: Theory and Methods. New York: M. Dekker, 1991.
- Burr IW. Cumulative Frequency Distribution, Annals of Mathematical Statistics. 1942; 13:215-232.
- Dubey S, Pradhan B, Kundu D. Parameter Estimation of the Generalized Rayleigh Distribution, 2010.
- George W. Evans; Simulation Using Digital Computers, 2010, 60-67.
- Grohowski G, Hausman W, Lamberson LR. (ASQC) General Motor Corporation, Warren.MI; Wayne State University, Detroit, MI. QICID: 5240 October, 1976, 197-208.
- Lindley DV. Approximate Bayesian Method. Trab. Esta. 1980; 31:223-237.
- Mostert J, Roux J, Bekker J. A Generalized Compond Rayleigh Distribution Using Bayesian Method. 2000; 29(7):14191433'
- Patil GP, Boswell MT, Joshi SW, Ratnaparkhi V. Dictionary and classified Bibliography of Statistical Distributions in Scientific Work. International Cooperative publishing house, Fairland, MD, 1984, 1.
- Satya D, Dubey; june, 1968.
- Sinha SK. Robustness of Posteriors under Improper Priors in Some Life Testing Models, J Indian Statist. Assoc. 1980; 18:127-144.
- Sinha SK. Reliability and Life Testing, Wiley Eastern Ltd. Delhi, India, 1986.
- Sinha SK, Sloan JA. Bayesian Estimation of Parameters and Reliability Function of the 3-Paramters Weibull Distrib. IEEE Tra. Rel. V-R-37, 1988, 364-369.
- Siddiqui J, Weiss G. Families of Distributions for received power of radio wave, J Research of the NBS, D. Radio Propagation, 1963, 753-762.
- Soliman AA. Linex and Quadratic Approximate Bayesian Estimators Applied to Pareto Model", Communication in StatisticsSimulation. 2001; 30(1):47-62.
- Varian HR. A Bayesian Approach to Real Estate Assessment, in Studies in Bayesian Econometrics and Statistics in Honor of Leonard J. Savage, SE. Fienberg and A. Zellner, Eds. North-Holland Amsterdam, the Neterlands., 1975, 195-208.
- Zellner A, Giesel MS. Sensitivity of Control to Uncertainty and Form of Criterion Function in the Future of Statistics. Ed. Donal G. Watts. N Y Academic Press, 1968.