
Research article · 2018 · Full text
International Journal of Statistics and Applied MathematicsEnhancing the distribution of zakat by exploring data envelopment analysis
Volume 3(2) · Pages 518–522
Research areasIslamic Finance and Banking StudiesMicrofinance and Financial Inclusion
Abstract
Author-writtenThe paper attempts to examine the role of zakat institution in the society in order to alleviate poverty and breach the gap between the rich and poor in Sokoto State, Nigeria. Zakat institutions are trusted bodies that managed Zakat monies in most of the Sharia states in Nigeria. The main objective of this paper is to analyze the efficiency of Zakat and Endowment Board in Sokoto State using Data Envelopment Analysis (DEA) method to estimate Zakat coefficients in the state. Efforts have been made to use three different types of DEA model which are technical efficiency (TE), pure technical efficiency (PTE) and scale efficiency (SE) model. The empirical findings suggest that zakat payment system efficiency is significantly affected by the board size, audit committee and computerized system.
Summary
Source-checkedPlain-language reading of the full paper, prepared with AI and checked against the text. Each point links to the authors' own words.
Why it matters
- Poverty is a significant issue in Nigeria, with a 2010 UNDP report indicating that 64% of the population is poor. View evidence ↗
- Zakat institutions in Northern Nigerian states are used to alleviate poverty by collecting and distributing zakat funds. View evidence ↗
- The Zakat and Endowment Board in Sokoto State manages these funds, but the distribution process remains a subject of significant problem and debate. View evidence ↗
The question
- The study aims to analyze the efficiency of the Zakat and Endowment Board in Sokoto State using the Data Envelopment Analysis (DEA) method. View evidence ↗
- The research also seeks to identify the specific factors that affect the efficiency of the board. View evidence ↗
What they did
- The study examined the efficiency of eight Decision Making Units (DMUs). View evidence ↗
- The researchers employed three DEA models: technical efficiency (TE), pure technical efficiency (PTE), and scale efficiency (SE). View evidence ↗
- The study tested eight independent variables: number of branches, number of staff, zakat payment system, computerized payment system, board size, meetings per year, audit committee, and decentralization. View evidence ↗
What they found
- The mean efficiency scores were highest for scale efficiency (0.93), followed by pure technical efficiency (0.86), and lowest for technical efficiency (0.81). View evidence ↗
- The higher scale efficiency relative to pure technical efficiency suggests that the board's efficiency is driven more by its size of operation than by technical efficiency. View evidence ↗
- For pure technical efficiency (PTE), ZPS, audit committee (AC), and decentralization (DEC) had positive impacts, while the computerized payment system (CPS) had a negative impact. View evidence ↗
- For scale efficiency (SE), ZPS and decentralization (DEC) had positive impacts, while number of staff (NOS) and audit committee (AC) were negatively correlated. View evidence ↗
- The zakat payment system (ZPS) and decentralization (DEC) were the only variables found to be consistently significant across all efficiency measures. View evidence ↗
What it means
- The authors recommend decentralizing the chairmanship of zakat institutions to include high-integrity individuals from lower levels to improve distribution efficiency. View evidence ↗
- The authors conclude that zakat institutions should increase their transparency and accountability in management. View evidence ↗
- The authors state that further studies are needed to provide better guidance for policymakers to improve the board's efficiency. View evidence ↗
Visual summary
1 visualsIllustrations explain the paper; they do not show study data.

Efficiency Comparison
AI-generated conceptual illustration (Three overlapping translucent spheres of varying sizes). It explains the idea and does not show study data.
View source evidence ↗Figures & tables
From the original paper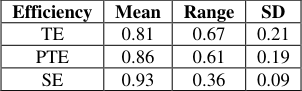 Table 1
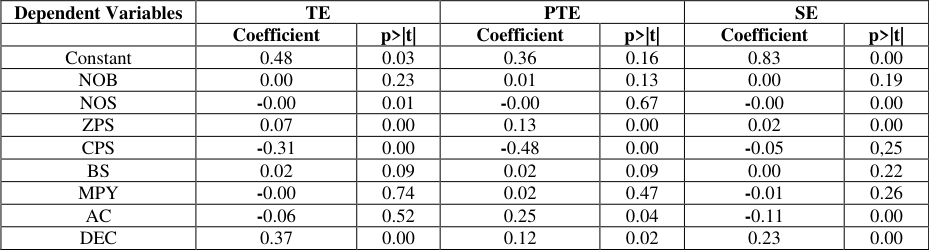 Table 2
Introduction
Data Envelopment Analysis (DEA) is relatively new data oriented approach for evaluating the performance of a set of peer entities called Decision Making Units (DMUs) which converts multiple inputs into multiple outputs. DEA is a methodology directed to frontiers rather than central tendencies. Because of this perspective, DEA proves particularly adept at uncovering relationships that remain hidden from other methodologies. As pointed out in Cooper, DEA has also been used to supply new insights into activities that have previously been evaluated by other methods. This means some previous work can be revisit if the outcome have certain anomalies or the desired results have not been achieved. When we look at issue of poverty in Nigeria, the situation is quite disheartening. If you are talking about a country with abundant natural endowment and mineral resources, no doubt Nigeria would be one of the highly scored ones. Adebayo (2011) [1] pointed out that the land is good for both cash and food crops and it has high potentials for industrial and economic development. The discovery of crude oil is an additional advantage to the country and this serves as her major foreign exchange income. Such other mineral resources like limestone, tin, gold, silver, coals, sand marble to mention a few, are also in abundance there. In spite of all these divine blessings, it is sad to note that the country is scored low in terms of human development. An inference could be drawn to UNDP 2010 Human Development Report which indicates that 64% of Nigerians are poor and that there is no increase in her education index. Claimed that in 1996, the number of people bitten by excessive poverty in Nigeria was 39.2 million representing 65.6% of the Nigerian population in 1980. Some State governments especially in the Northern States try to alleviate poverty using Zakat institutions. Zakat is one of the major financial obligations which every Muslim has to pay once in a year. It has been made obligatory by Allah to each and every Muslim to carry out. According to the basic principles of zakat, the zakat institution has to be established first within Muslim society in a well-organized way (Shawal, 2009) [12] . The zakat institution should be under the responsibility of a supervisory body that has been appointed by the Government. The roles of zakat are not only to collect the zakat dues but also to distribute the zakat funds to the recipients. In Sokoto State, we have Zakat and Endowment Board which collects and distributes the zakat funds. The issue of zakat distribution still causes a lot of problems, arguments as well as discussions. The difficulty with the distribution methods, distribution process to the qualified and unqualified recipient, the problem of poverty that is still happening even though the zakat institution has been implemented are among our concern in this paper. According to Yusuf (2000) [13] , the government should be accountable in collecting and distributing zakat funds for a few reasons. Zakat distribution by the government will keep and maintain the dignity of needy and poor people, instead of receiving zakat funds from the rich people directly. Now, having discussed on the Zakat institution let us look at its efficiency. Economic efficiency is defined in economic theory as a term describing how well a system is performing, in generating the maximum desired output for a given inputs with available technology. Efficiency is improved if more output is generated without changing inputs. An economic system is more efficient if it can provide more goods and services for society without using more resources. There is still lack of studies on the efficiency using DEA. Hussain et al. (2000) [9] studied the efficiency of Road Transport Department using DEA found out that out of 46 service unit, only 11 service units score above 50% of efficiency score. Ibrahim and Salleh (2006) [10] also in their studies of local governments providing local public goods and services found that the overall result showed that most of the local governments in Malaysia are cost inefficient, and that municipality councils were more inefficient than the district councils. Despite the limitation, this paper tries to explore the efficiency of zakat and endowment board in Sokoto and identify the factors affecting the efficiency.
Method
Date Envelopment Analysis (DEA) is a linear programming based technique for measuring the performance efficiency of organizational units which are termed Decision Making Units (DMUs). This technique aims to measure how efficiently a DMU uses the resources available to generate a set of outputs (Charnes et al. 1978) [6] . Each DMU is measured by obtaining the ratio of weighted outputs to weighted inputs. This means that the more the output produced from a given input, the more efficient is the production. The weights for the ratio are determined by a restriction that the similar ratios for every DMU have to be less than or equal to unity. The CCR model presupposes that there is no significant relationship between the scale of operations and efficiency by assuming constant returns to scale (CRS) and it delivers the overall technical efficiency (OTE). The CRS assumption is only justifiable when all DMUs are operating at an optimal scale. However, firms or DMUs in practice might face either economies or diseconomies of scale. Thus, if one makes the CRS assumption when not all DMUs are operating at the optimal scale, the computed measures of technical efficiency will be contaminated with scale efficiencies. Banker et al. (1984) [3] extended the CCR model by relaxing the CRS assumption. The resulting "BCC" model was used to assess the efficiency of DMUs characterized by variable returns to scale (VRS). The VRS assumption provides the measurement of pure technical efficiency (PTE), which is the measurement of technical efficiency devoid of the scale efficiency (SE) effects. If there appears to be a difference between the TE and PTE scores of a particular DMU, then it indicates the existence of scale inefficiency. The input oriented DEA model with VRS technologies can be represented by the following linear programming problem: min , , .
Where is an N x 1 intensity vector of constants and is a scalar ( 1).
N1 is an N x 1 vector of ones. For N number of firms, y i and x i are the M x N and K x N output and input vectors respectively. Y comprises the data for all the N firms. Given a fixed level of inputs for the ith firm, the proportional increase in output to be achieved the firm indicated by 1.
Note that without the convexity constraint N1' =1, equation ( 1) becomes a DEA model with CRS technology. The convexity constraint implies that an inefficient firm is benchmarked against firms of a similar size and therefore the projected point of that firm on the DEA frontier will be a convex combination of observed firms. In other words, each firm would produce on or to the right of the convex production possibility frontier. If TE scores for a particular firm with or without the convexity constraint imposed are the same, then the firm is operating under CRS. If these scores are different, the firm operates under VRS technology. However, in such a case, it would be necessary to identify whether the firm or the DMU operates with IRS or DRS. To do this, assumption of non-increasing returns to scale (NIRS) is imposed in (1) and the convexity constraint N1' λ =1 is substituted with N1' λ ≤1. This is given as follows: min , , .
Solution of the equation ( 2) reveals the nature of scale efficiencies. IRS exists if TE score obtained with NIRS technology differs from the TE estimates with VRS technology. If both of these efficiency scores are equal, then the corresponding firm operates with DRS. Because the number of zakat institutions is small, the scope to undertake this study using standard econometric methods is somewhat limited. Amongst the strengths of the DEA is that, DEA is less data demanding as it works fine with small sample size (Canhoto and Dermine, 2003) [5] . The small sample size is among other reasons, which leads us to DEA as the tool of choice for evaluating efficiency of zakat institutions in Malaysia. Furthermore, DEA does not require a preconceived structure or specific functional form to be imposed on the data in identifying and determining the efficient frontier, error, and inefficiency structures of the DMUs (Bauer et al. 1998) [4] . DEA can be used to derive measures of scale efficiency by using the variable returns to scale (VRS), or the BCC model, alongside the constant returns to scale (CRS), or the CCR model. Coelli et al. (1998) [7] noted that the BCC model have been most commonly used since the beginning of the 1990s. A DEA model can be constructed either to minimize inputs or to maximize outputs. An input orientation aims at reducing the input amounts as much as possible while keeping at least the present output levels, while an output orientation aims at maximizing output levels without increasing use of inputs. The standard approach to measuring scale effects using DEA is to run models on both a CRS and VRS basis. Scale efficiency is then found by dividing the efficiency score from the CRS model by the efficiency score from the VRS model. Because the data points are enveloped more tightly under the VRS model, the VRS efficiency scores will be higher and the scale efficiency measures will therefore be in the range 0 to 1. A useful feature of VRS model as compared to the CRS model is that it reports whether a decision-making unit (DMUs) is operating at increasing, constant, or decreasing returns to scale. Constant returns to scale will apply when CRS and VRS efficiency frontiers are tangential with each other; in other words, when the slope of the efficiency frontier is equal to the ratio of inputs to outputs. Increasing returns to scale must apply below that level, as the slope of the efficient frontier, which reflects the marginal rate of transformation of inputs to outputs will be greater than the average rate of conversion. Likewise, decreasing returns to scale must apply above the zone in which constant returns to scale apply. DMUs not on the efficient frontier must first be projected onto the efficient frontier before their returns to scale status can be assessed.
Tobit Analysis
One of the models to use in testing the determinants of efficiency of Zakat and Endowment Board in Sokoto is Tobit model. This is because Tobit uses a limited dependent variable approach. Since the DEA technique produces efficiency scores which are bounded by 0 and 1, it is appropriate to employ the use of Tobit. As stated earlier three model of efficiency (TE, PTE, and SE) will be tested against the determinant of Zakat efficiency. The possible determinants of the efficiency of zakat institutions are investigated using a random effects Tobit model. The model is written as:
Where: TE, PTE, SE: Technical efficiency, pure technical efficiency and scale efficiency computed from the DEA model NOB (Number of Branches), NOS (number of staff), ZPS (zakat payment system), CPS (computerized payment system), CS (committee size per LG), MPY (meeting per year), AC (audit committee), and DEC (decentralization).
For the purpose of this study, the efficiency of eight DMUs will be examined to enable enhancement of the zakat distribution as well as estimate the coefficient of the DMUs. It will also investigate the suitable method, which can be applied in order to enhance the existing method in distributing zakat fund in Sokoto. The production approach is chosen in defining the inputs and outputs used in the study whereby zakat institutions are assumed to produce more zakat funds (collecting zakat, and 'persuade' more people to pay zakat and distribute it) using daawah and other promotion methods. Since this study is the first attempt in measuring efficiency of zakat and endowment board, the choices of inputs and outputs for this study are solely and based on the availability of data for analysis. The data used in the analysis are different in units of measurement (some are ordinal, nominal such as computerized system, decentralization, while the others are in terms of real number). Avkiran (1999) [2] acknowledges the edge of the DEA by stating that the technique allows the researchers to choose any kind of inputs and outputs of managerial interest, regardless of different measurement units and there is no need for standardization.
Results
Here, the results of technical efficiency (TE), and its decomposition into pure technical efficiency (PTE) and scale efficiency (SE) components are presented. The efficiency is examined first by employing the DEA method for each DMU under investigation. To substantiate the results under the DEA approach, a random-effect Tobit model is employed to relate the efficiency scores with its determinants. 1 reveals that the scale efficiency have the highest score of zakat distribution (0.93) while the technical efficiency is the lowest (0.81). It is interesting to note that the higher results of SE compared to PTE suggests that the efficiency of Zakat board in Sokoto may be due to the size rather than its technical efficiency. The result also reveals that pure technical inefficiency dominates scale inefficiency of the board. In other words, it shows that zakat and endowment board relied more on its size of operation in gaining efficiency. However, based on the results, the efficiency score of zakat board does not change much as both the scores have minimum variance. Hence, the concern of the differences between efficiency score of different DMUs should be paid more attention as the results of the range between the minimum and the maximum score of the DMUs are bigger in size.
The regression results focusing on the relationship between zakat efficiency and the explanatory variables are presented in Table 2. In this section, the determinants of efficiency of zakat DMUs are tested against the TE, PTE and SE of zakat and endowment board in Sokoto State. are not statistically significant at any conventional levels, the results imply that the extension of branch network to collect and distribute zakat funds, although may increase the costs, however, the increase in outputs (zakat collection and distribution) gathered dominates the increase in inputs used.
| Dependent Variables | TE | — | PTE | — | SE | — |
|---|---|---|---|---|---|---|
| Coefficient | p>|t| | Coefficient | p>|t| | Coefficient | p>|t| | |
| Constant | 0.48 | 0.03 | 0.36 | 0.16 | 0.83 | 0.00 |
| NOB | 0.00 | 0.23 | 0.01 | 0.13 | 0.00 | 0.19 |
| NOS | -0.00 | 0.01 | -0.00 | 0.67 | -0.00 | 0.00 |
| ZPS | 0.07 | 0.00 | 0.13 | 0.00 | 0.02 | 0.00 |
| CPS | -0.31 | 0.00 | -0.48 | 0.00 | -0.05 | 0,25 |
| BS | 0.02 | 0.09 | 0.02 | 0.09 | 0.00 | 0.22 |
| MPY | -0.00 | 0.74 | 0.02 | 0.47 | -0.01 | 0.26 |
| AC | -0.06 | 0.52 | 0.25 | 0.04 | -0.11 | 0.00 |
| DEC | 0.37 | 0.00 | 0.12 | 0.02 | 0.23 | 0.00 |
Table text extracted from the original PDF; superscript letters are shown inline. The original table image is below.
View original table image
Conclusion
In conclusion, Sokoto State Zakat and endowment board can be considered as one of the outstanding and excellent State in the country in managing zakat compared to the other States that also have similar zakat institution (Grand Stride, 2013) [8] . This may be due to the contribution and awareness by the State government which as a result wealthy individual also contributes immensely to the zakat board for the purpose of distribution. For instance during the year 2013 the zakat board took to door to door sensitization to wealthy individual in the State. Both the State Government and traditional rulers participates in the overall activities, i.e. collection and distribution of zakat monies and items. As Noaralina and Abdulrahim (2011) [11] suggested decentralizing the chairmanship of zakat institution to involve common men of lower level that are of integrity this will tend to improve the efficiency of zakat distribution. They should also be more transparent and accountable in managing the institutions.
For instance, there is award ceremony organized by His Eminence the Sultan of Sokoto to honour the first District head that excelled in Zakat collection during a given period.
The results of the determinants of zakat board with three dependent variables (TE, PTE and SE) were tested against eight (8)
Figures and tables from the paper
| Efficiency | Mean | Range | SD |
|---|---|---|---|
| TE | 0.81 | 0.67 | 0.21 |
| PTE | 0.86 | 0.61 | 0.19 |
| SE | 0.93 | 0.36 | 0.09 |
Table text extracted from the original PDF; superscript letters are shown inline. The original table image is below.
View original table image
References
13 in the original paper- Adebayo RI. Zakat and Poverty alleviation: A Lesson for the Fiscal Policy Makers in Nigeria. Journal of Islamic Economics, Banking and Finance. 2011; 7:424.
- Avkiran NK. An Application Reference for Data Envelopment Analysis in Branch Banking: Helping the Novice Researcher. International Journal of Bank Marketing. 1999; 17(5):206-220.
- Banker R, Charnes A, Cooper WW. Some models for estimating technical and scale inefficiencies in data envelopment analysis. Management Sciences. 1984; 30:1078-1092.
- Bauer R, Berger PW, Ferrier GD, Humphrey DB. Consistency Condition for regulatory Analysis of Financial Institution. Journal of Economics and Business. 1998; 50(2):85-114
- Canhoto A, Dermine J. A note on banking efficiency in Portugal, New vs Old banks, Journal of Banking and Finance. 2003; 27:2087-98.
- Charnes A, Cooper WW, Rhodes E. Measuring the efficiency of decision making units, European Journal of Operations Research. 1978; 2:429-444.
- Coelli T, Prasada Rao D, Battese GE. An Introduction to Efficiency and Productivity Analysis, Kluwer Academic Publishers, Norwall, MA, 1998.
- Cooper WW, Seiford LM, Tone K. Data Envelopment Analysis. Boston: Kluwer Academic Publishers. Grand Stride: Sokoto State Zakat and Endowment Board Report, 2013.
- Hussain N, Abdullah M, Kuman S. Evaluating public sector efficiency with DEA. A case study in Road Transport Dept. Selangor. Total Quality Mgt. 11 (4, 5 & 6), 2000.
- Ibrahim F, Salleh MFM. Stochastic Frontier estimation: an application to Local Government in Malaysia. Malaysia Jpournal of Economics Studies. 2006; 43:1-2.
- Norazlina A, Abdulrahim A. Efficiency of Zakat Institutions and its determinants 8 th International Conference on Islamic Economics and Finance, Doha, Qatar Ogbulafor Vincent (2000): How to Pull Out Poverty, The Guardian, Thursday, April 13, 2011.
- Shawal Kaslam. The advancement of e-zakat for delivering better quality service and enhancing governance sphere of zakat institution in Malaysia. Proceeding of World Zaka Forum, 2009.
- UNDP. Human Development Reports. United Nations Development Programme Yusuf Qardhawi (2000): Fiqh al-zakah, English Translation by King Abdulaziz UniversiMonzar kahf, Jedda. Scientific Publishing Centre, 2010.