
Research article · 2018 · Full text
International Journal of Statistics and Applied MathematicsApplication of time series analysis on the forecasting of the outbreak of malaria epidemic in Nigeria
Volume 3(6) · Pages 98–105
Research areasForecasting Techniques and Applications
Abstract
Author-writtenThis study examined the application of time series analysis in forecasting of the monthly outbreak of malaria epidemic in Nigeria. The secondary data was obtained from the National Bureau of Statistics (NBS). The model; ARIMA (1,0,1) was used to forecast the monthly reported cases of malaria with 16 months lead, which shows a gradual increase and decrease in the series. It was recommended among others that the Government should ensure the provision of insecticide-treated nets, insecticides and anti-malaria drugs in the rural areas in Nigeria.
Summary
Source-checkedPlain-language reading of the full paper, prepared with AI and checked against the text. Each point links to the authors' own words.
Why it matters
- Malaria is currently one of the most significant health challenges globally. View evidence ↗
- The African region is disproportionately affected, accounting for 90% of malaria-related deaths in 2015. View evidence ↗
- In Nigeria, poverty in rural areas limits access to clean water and adequate healthcare, increasing vulnerability to malaria. View evidence ↗
The question
- The study aimed to determine if time series analysis could be used to forecast monthly malaria outbreaks in Nigeria using data from January 2009 to April 2013. View evidence ↗
What they did
- The researchers used secondary data sourced from the National Bureau of Statistics (NBS). View evidence ↗
- Autoregressive Integrated Moving Average (ARIMA) models were employed to analyze the time series data. View evidence ↗
- The Box-Jenkins methodology was used to build the model, utilizing Autocorrelation Function (ACF) and Partial Autocorrelation Function (PACF) correlograms. View evidence ↗
What they found
- Initial analysis of monthly reported cases from January 2009 to April 2013 indicated that the time series was non-stationary. View evidence ↗
- Among three tested models, the ARIMA (1, 0, 1) model was selected as the best fit based on the minimum Normalized BIC and AIC. View evidence ↗
- The estimated parameters for the ARIMA model were AR1 = -0.4471 (SE 0.1528) and MA1 = -0.9423 (SE 0.0616). View evidence ↗
- Monthly reported cases decreased from 9,468 in 2009 to 8,714 in 2010, indicating an improvement. View evidence ↗
- Reported monthly cases were 8,155 in 2011 and 8,353 in 2012; while 2011 showed improvement over 2009, 2012 showed a slight increase over 2011. View evidence ↗
- Forecasting for a 16-month lead period using the ARIMA (1,0,1) model showed a pattern of gradual increase and decrease in reported cases. View evidence ↗
What it means
- The authors conclude that encouraging the use of insecticide-treated nets and increasing the availability of anti-malaria drugs in rural areas are necessary to reduce deaths. View evidence ↗
- The authors recommend the use of ARIMA models for future studies on malaria outbreaks in Nigeria and other West African nations. View evidence ↗
Visual summary
3 visualsIllustrations explain the paper; charts are replotted from the paper's own table values.
ARIMA Forecasting Workflow
AI-generated conceptual illustration (Anopheles mosquitoes and a map of Nigeria). It explains the idea and does not show study data.
View source evidence ↗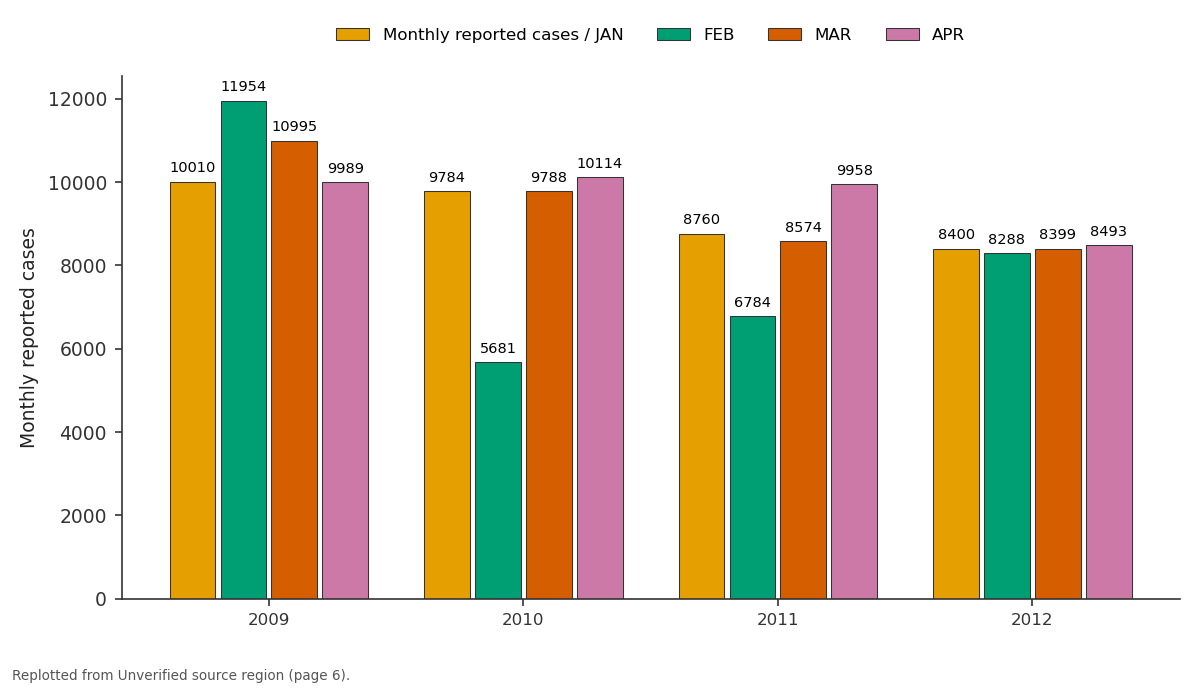
Monthly reported cases / JAN and FEB and more: 2009 vs 2010 vs 2011 vs 2012
Replotted from a table (page 6) of the original paper. Every bar is the paper's own table value.
View source evidence ↗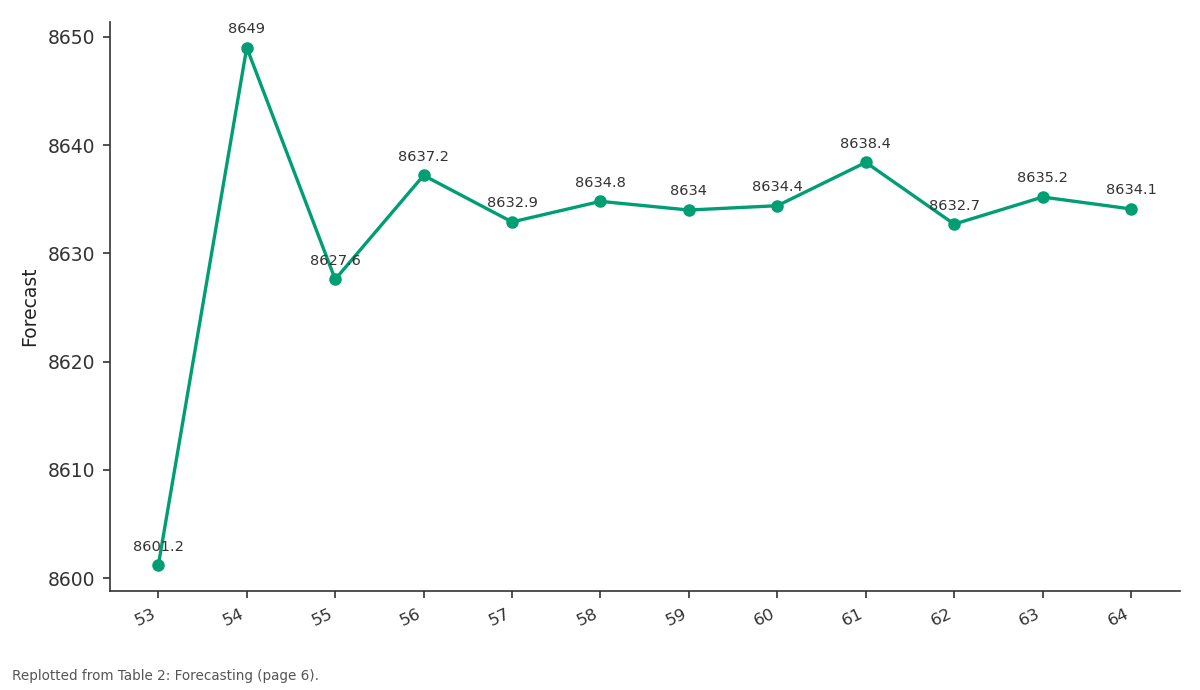
Forecast: 53 vs 54 vs 55 vs 56 vs 57
Replotted from Table 2 (page 6) of the original paper. Every bar is the paper's own table value.
View source evidence ↗Figures & tables
From the original paper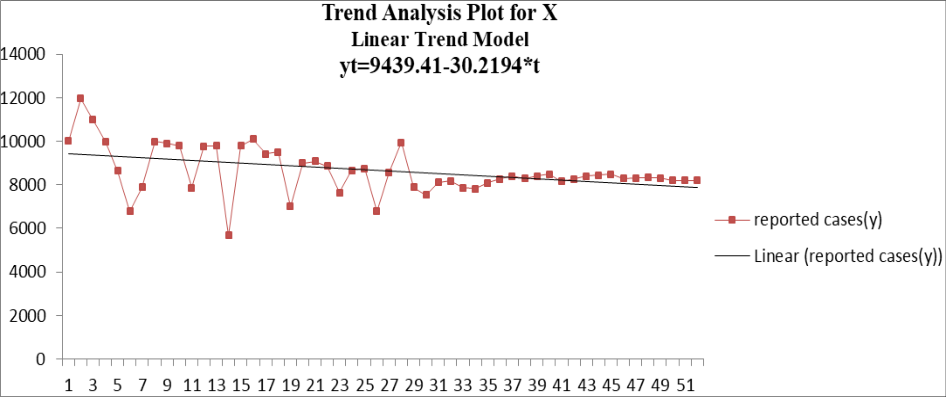 Figure 1
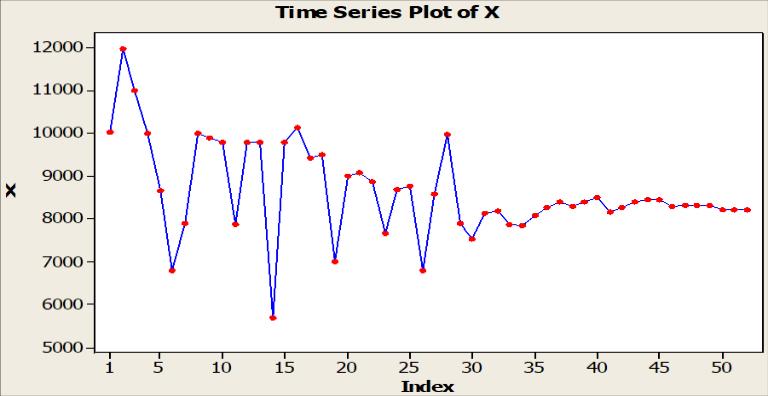 Figure 2
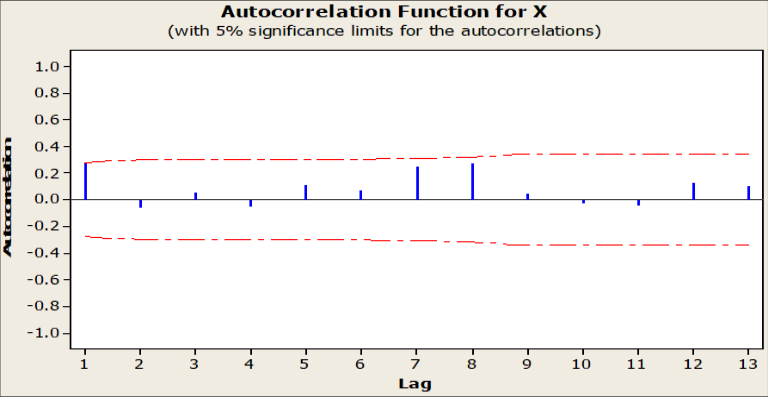 Figure 3
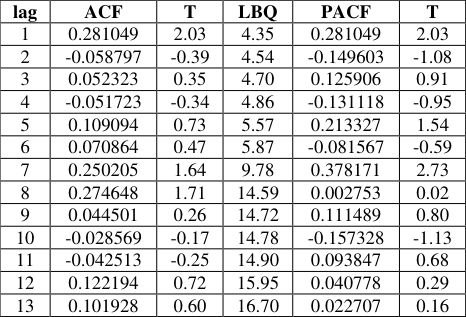 Table 1
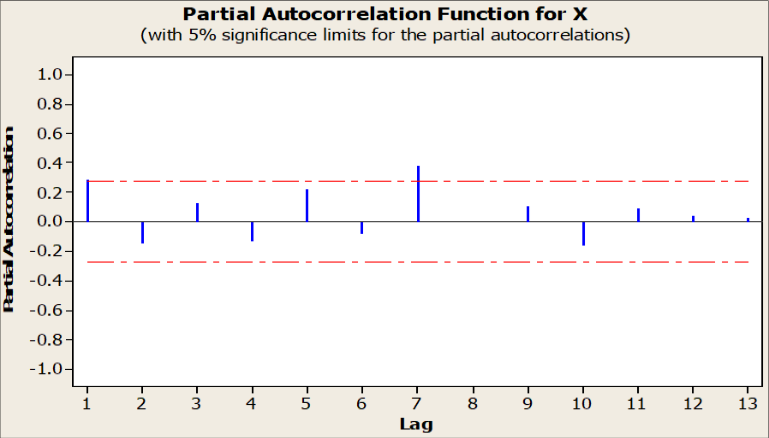 Figure 4
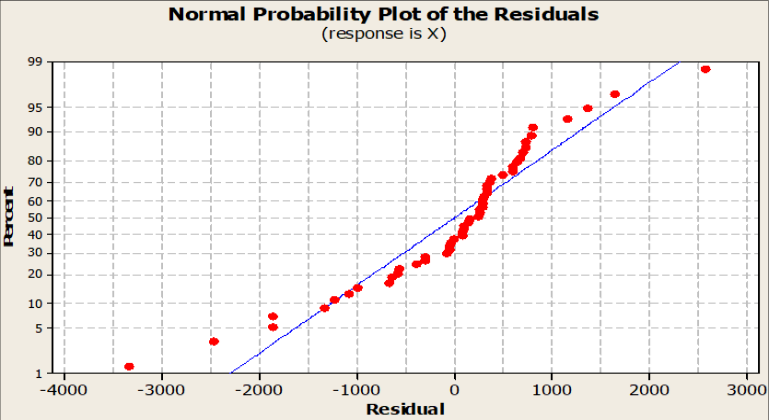 Figure 5
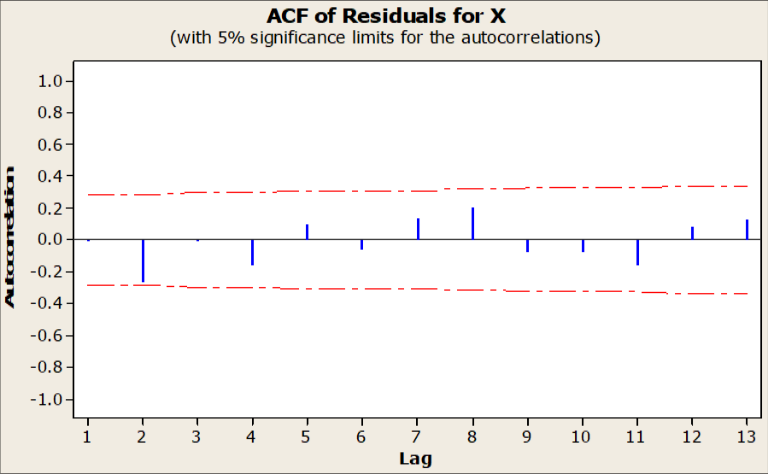 Figure 6
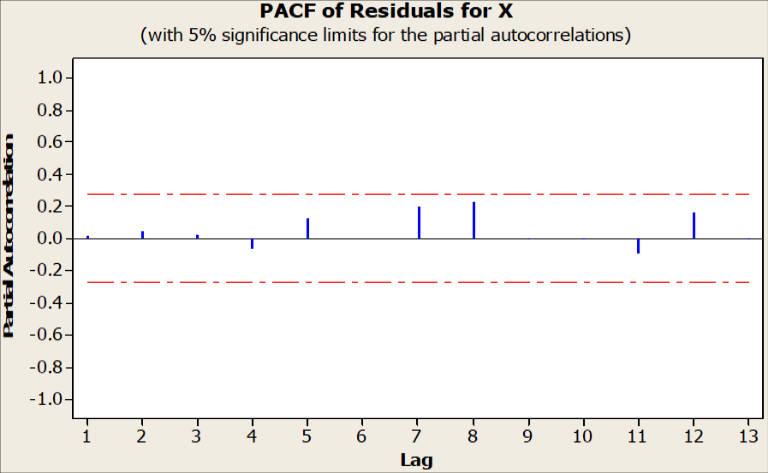 Figure 7
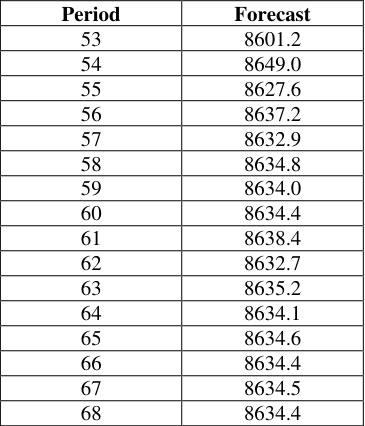 Table 2
Introduction
Today, one of the most serious health challenges facing the world is malaria. A recent report from the World Health Organization (2018) [12] shows that irrespective of the efforts to control malaria, data from 2015-2017 indicated that there appears to be no significant progress in minimizing the cases of malaria globally during this period. The report further shows that there was an estimated 219 million cases and 435,000 related deaths worldwide in 2017 with 3.1 billion dollars in funding to reduce the scourge. Specifically, WHO (2018) [12] also reported that most, 90% of the malaria-related deaths in 2015 were in the African region with South-East Asia and Eastern Mediterranean WHO regions represented with 7%and 2% respectively. A huge proportion of the Nigerian population lives in abject poverty in the rural areas, where there is neither access to adequate healthcare nor drinkable water. Nigeria is faced with massive foreign debt issues amidst low income. There is the probability of Nigeria sinking into more debt while struggling with sick residents because its economic growth seriously depends on the good health of the populace (Carrington, 2001) [5] . The prevalence of malaria in Africa is influenced by poverty. According to Pattanayak et al., (2006) [10] many of the world's poorest people reside in locations of high rates of malaria. Financial constraint hinders the access of these people to effective healthcare. The financial status of a susceptible nation plays an added part in ascertaining the adequate facility-based preparation and control measures in case of epidemics (Sudhakar & Subramani 2007) [11] . It is, therefore, imperative to forecast the monthly outbreak of malaria using time series analysis in an attempt to identify the current trend in its prevalence in Nigeria and make recommendations where necessary. Mathematically, a time series is defined by the functional relationship Y = F (t), where Y is the value of the variable under consideration at time t. Lin et al., (2009) [8] used time series analysis to investigate the relationship between Falciparum malaria in the endemic provinces and the imported malaria in the non-endemic provinces of China. An autoregressive integrated moving average model was first fit to the predictor variable. Out of all the models tested, the seasonal ARIMA (1,1,1,) (0,1,1,) 12 model for malaria cadence, fits the data best according to the AIC and goodness-of-it criteria. Briet et al., (2008) [3] , formulated a model for short-term malaria prediction in Sri Lanka. Contreras et al., (2003) [6] developed a model for predicting the next-day electricity prices in mainland span and California markets using an ARIMA model.
Their developed model was able to forecast the 24 market clearing prices of tomorrow. The ARIMA model is an effective tool for forecasting time series. A good model is to be developed for forecasting the malaria cases. A model fitting quality is defined as the sum of the residuals squares divided by the sample size. Its objective is to measure the model's capacity to produce the sample data (Guerrero, 2003) [7] .
Purpose of the Study
This study investigated the applicability of time series analysis in forecasting the outbreak of malaria epidemic in Nigeria. (i.e reported monthly cases of malaria epidemic in Nigeria January 2009 -April 2013)
Model Formation
This research work used ARIMA models to analyse the data. ARIMA model consists of autoregressive integrated and moving average models. The ARIMA model incorporates both non-seasonal and seasonal factors in a multiplicative model. A forecast was calculated by carefully inserting a time value of malaria cases reported in Nigeria into the Minitab statistical package. Box-Jenkins (1976) [1] methodology was used to construct a suitable mathematical model by putting the Autocorrelation Function (ACF) and Partial Autocorrelation Function (PACF) correlogram into consideration.
Mathematical Formation
One shorthand notation for the ARIMA model is given by ARIMA (P,d, q,)X (P,D,Q,) S, With P = non-seasonal AR order, d = non-seasonal differencing q = non-seasonal MA order P = monthly AR order D = monthly differencing Q= monthly MA order, and S = time span of repeating monthly pattern.
Without differencing operations, the model could be written more formally as:
The seasonal components are:
Method of Solution
A time series is said to follow autoregressive moving average model of p,q [ARMA (p,d,q)] if it satisfies the difference equation;
The error term is generally assumed to be independently and identically distributed random variable from a normal distribution with mean zero and variance, 2 < ∞.
For the process (2) to be stationary, we required that the root of (B) =0 lie outside the unit circle. To be invertible we required that the roots of (B) =0 lies outside the unit circle. We assume that (B) = 0 and (B) =0 share no common roots. Procedure for choosing p and q often known as model identification as well as estimation of time series models can be found in Box, Jenkins and Reinsel (1994) [2] , Chartfield (2004) [4] .
Trend Analysis
From figure 1, the time series has a linear trend model given by; Yt=9439.41-30.2194t, where Yt is the number of monthly reported cases and t is the given month. The values had irregular swings and hence had irregular variability. Where X is the reported cases of malaria epidemic. But the fact that there were irregular fluctuations in the plot was not a clear indication that the series was non-stationary. This called for verification to confirm the non-stationarity as indicated by the plotting of autocorrelation function and partial autocorrelation function. The ACF and PACF for are given in Table 1. It can be seen from Table 1 that the ACF and PACF cut off after lag 1, indicating that is stationary. A close examination of the ACF and PACF of suggesting an ARMA (1, 0, 1) model which is given by.
| lag | ACF | T | LBQ | PACF | T |
|---|---|---|---|---|---|
| 1 | 0.281049 | 2.03 | 4.35 | 0.281049 | 2.03 |
| 2 | -0.058797 | -0.39 | 4.54 | -0.149603 | -1.08 |
| 3 | 0.052323 | 0.35 | 4.70 | 0.125906 | 0.91 |
| 4 | -0.051723 | -0.34 | 4.86 | -0.131118 | -0.95 |
| 5 | 0.109094 | 0.73 | 5.57 | 0.213327 | 1.54 |
| 6 | 0.070864 | 0.47 | 5.87 | -0.081567 | -0.59 |
| 7 | 0.250205 | 1.64 | 9.78 | 0.378171 | 2.73 |
| 8 | 0.274648 | 1.71 | 14.59 | 0.002753 | 0.02 |
| 9 | 0.044501 | 0.26 | 14.72 | 0.111489 | 0.80 |
| 10 | -0.028569 | -0.17 | 14.78 | -0.157328 | -1.13 |
| 11 | -0.042513 | -0.25 | 14.90 | 0.093847 | 0.68 |
| 12 | 0.122194 | 0.72 | 15.95 | 0.040778 | 0.29 |
| 13 | 0.101928 | 0.60 | 16.70 | 0.022707 | 0.16 |
Table text extracted from the original PDF; superscript letters are shown inline. The original table image is below.
View original table image
Model Parameter Estimation for Reported Cases
The ARIMA model for the Malaria Epidemic in Nigeria (Jan 2009-April 2013) AR1: ϕ 1 = -0.4471 with standard error of 0.1528 MA1: ϴ 1 = -0.9423 with standard error of 0.0616 To determine the adequacy of the model, a diagnostic check of the residual ACF and PACF given in Table 1 was done. Following Chatfield (2004), the ACF and PACF are close to zero and lie within indicating that the model is adequate or fit the data. Similarly, the values of the Q statistic (Ljung and Box (1978) [9] are not as significant as given above confirming that the model is adequate.
Forecasting
The fitted model generated the following forecast with lead time L =12
Conclusion
The forecast from May 2013 to August 2014 has a gradual increase and decrease in the series and constant infections. Malaria has endangered the lives of many people over the years. Education and sensitization should be taken seriously in order to avoid keeping stagnant water for mosquitoes to breed. The use of insecticide treated nets should be encouraged to minimize the spread. The antimalaria drugs should be made available in rural areas to reduce the malaria related deaths among poor people.
Recommendations
In line with the finding of this work, it is recommended that:
1. The ARIMA model has been found to be useful in forecasting malaria epidemic and it should be used in future studies on the outbreak of malaria epidemic in Nigeria and other West African countries. 2. Parents/guardians should ensure they check the health condition of their children/wards at least once a month. 3. The Government should ensure the provision of insecticide-treated nets, insecticides and anti-malaria drugs in the rural areas in Nigeria
Figures and tables from the paper
| Period | Forecast |
|---|---|
| 53 | 8601.2 |
| 54 | 8649.0 |
| 55 | 8627.6 |
| 56 | 8637.2 |
| 57 | 8632.9 |
| 58 | 8634.8 |
| 59 | 8634.0 |
| 60 | 8634.4 |
| 61 | 8638.4 |
| 62 | 8632.7 |
| 63 | 8635.2 |
| 64 | 8634.1 |
| 65 | 8634.6 |
| 66 | 8634.4 |
| 67 | 8634.5 |
| 68 | 8634.4 |
Table text extracted from the original PDF; superscript letters are shown inline. The original table image is below.
View original table image
References
11 in the original paper- Box GEP, Jenkins GM. Time series analysis: Forecasting and control. Rev. ed. San Francisco. Holden-Day, 1976.
- Box GEP, Jenkins GM, Reinsel GC. Time Series Analysis: Forecasting & Control, 3rd edition. Prentice Hall, New Jersey, 1994.
- Briet OJT, Vounatsou P, Amerasinghe PH. Malaria seasonality and rainfall seasonality in Sri Lanka are correlated in space. Geospatial Health. 2008; 2(2):183-190.
- Chartfield C. The Analysis of Series: An Introduction 6th edition, Chapman and Hall/CRC, 2004.
- Carrington A. Malaria: its human impact, challenges, and control strategies in Nigeria. Harvard Health Policy Review. 2001; 2(2):1-3.
- Contreras J, Espinola R, Nogales FJ, Antonio J, Conejo AJ. IEEE Transactions on power systems. 2003; 18(3):1014-1020.
- Guerrero VM. Anảlisis estadistico de series de tiempo econὁmicas. Segunda ediciὁn, Mẻxico, 2003.
- Lin H, Lu L, Tian L, Zhou S, Wu HBY, Ho SC et al. Spatial and temporal distribution of falciparum malarial in China. Malaria Journal. 2009; 8(130). doi: 10.1186/1475-2675-8-130.
- Ljung GM, Box GEP. On a measure of lack of fit in time series models, Biometrika. 1978; 65:297-303.
- Pattanayak S, Dickinson K, Corey C, Murray B, Sills E, Kramer R. Deforestation, malaria and poverty: a call for transdisciplinary research to support the design of cross-sectoral policies. Sustainability: Science, Practice, & Policy. 2006; 2(2):45-56. http://sspp.proquest.com/archives/vol2iss2/0512-022.pattanayak.html
- Sudhakar P, Subramani P. Literature review: insights into formulating a protective malaria medicine. Journal of Young Investigators. 2007; 16(1).
Cited by 1
From OpenAlex, OpenCitations and reference lists read by Scinovex
- Time series analysis applicability on the forecast of currency in circulation in Nigeria using moving average model MA (q) ↗
Journal of Environmental Science Computer Science and Engineering & Technology · 2020
This paper estimates the optimal forecasting model of Currency in Circulation CIC in Nigeria, using a secondary data from Central Bank of Nigeria statistical bulletin, the Federal Inland Revenue Service, Nigerian bureau of statistics and the authors' computations.The research work employed Box-Jenkins (1976) methodology to construct a suitable mathematical model by putting the Autocorrelation Function (ACF) and Partial Autocorrelation Function…
❝ 1PDF