
Research article · 2019 · Full text
International Journal of Statistics and Applied MathematicsStatistical analysis of the factors affecting students’ academic performance in tertiary institutions: A case study of the department of statistics, Ahmadu Bello University, Zaria
Volume 4(1a) · Pages 58–61 · DOI: 10.22271/maths.2019.v4.i1a.09 ↗
Research areasEducation and Islamic Studies
Abstract
Author-writtenThis research examined factors affecting students’ academic performance in tertiary institutions taking the department of statistics, ABU, Zaria as a case study. Five factors namely: family income, adequacy of lecture halls, availability of reading materials, interest in course of study and reading habits; were considered. A sample of 100 students from the department of statistics was selected purposively and data was obtained through a structured questionnaire with a response value of 90 students. Multiple regression analysis revealed a model which proved to be significant at 0.05 level of significance by Analysis of variance and a multiple correlation value of 0.551 which indicates a strong positive relationship between CGPA and the predictors. The coefficient of determination posited that 30.4% of the variation in academic performance was explained by the predictor variables. The result of the analysis indicated that availability of reading materials, interest in course of study and reading habits contribute to students’ academic performance (CGPA).
Summary
Source-checkedPlain-language reading of the full paper, prepared with AI and checked against the text. Each point links to the authors' own words.
Why it matters
- Student academic performance is influenced by a wide variety of factors, ranging from teaching facilities and socio-economic status to personal habits and living conditions. View evidence ↗
- Researching these factors is useful because it helps identify necessary corrective measures to improve the academic performance of students. View evidence ↗
- Socioeconomic status is one of the most heavily debated and researched factors contributing to student academic success. View evidence ↗
The question
- The study aims to identify and analyze specific factors that determine academic performance within tertiary institutions. View evidence ↗
What they did
- The researchers used the Department of Statistics at Ahmadu Bello University (ABU), Zaria, as a case study. View evidence ↗
- Data was collected via structured questionnaires from a purposively selected sample of 100 students, resulting in 90 responses. View evidence ↗
- The study measured Cumulative Grade Point Average (CGPA) as the dependent variable against five independent variables: family income, lecture hall adequacy, reading material availability, interest in the course, and reading habits. View evidence ↗
- A multiple linear regression model was employed to analyze the relationship between the predictors and academic performance. View evidence ↗
What they found
- There is a strong positive relationship (R = 0.551) between the combined predictor variables and the students' CGPA. View evidence ↗
- The overall regression model was found to be statistically significant (p = 0.000). View evidence ↗
- Family income showed a weak positive association with CGPA (0.059) that was not statistically significant (p = 0.578). View evidence ↗
- The adequacy of lecture halls had a very weak correlation with CGPA (0.087) and was not statistically significant (p = 0.416). View evidence ↗
What it means
- The authors conclude that interest in the course of study and reading habits are the primary factors with significant effects on academic performance. View evidence ↗
- The authors note that approximately 70% of the changes in CGPA are caused by factors other than the five variables examined in this study. View evidence ↗
Visual summary
1 visualsIllustrations explain the paper; they do not show study data.

Predictors of Academic Performance
AI-generated conceptual illustration (University students in a classroom setting). It explains the idea and does not show study data.
View source evidence ↗Figures & tables
From the original paper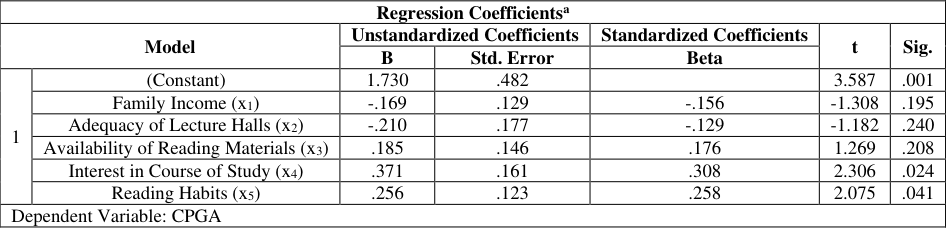 Table 1
 Table 2
 Table 3
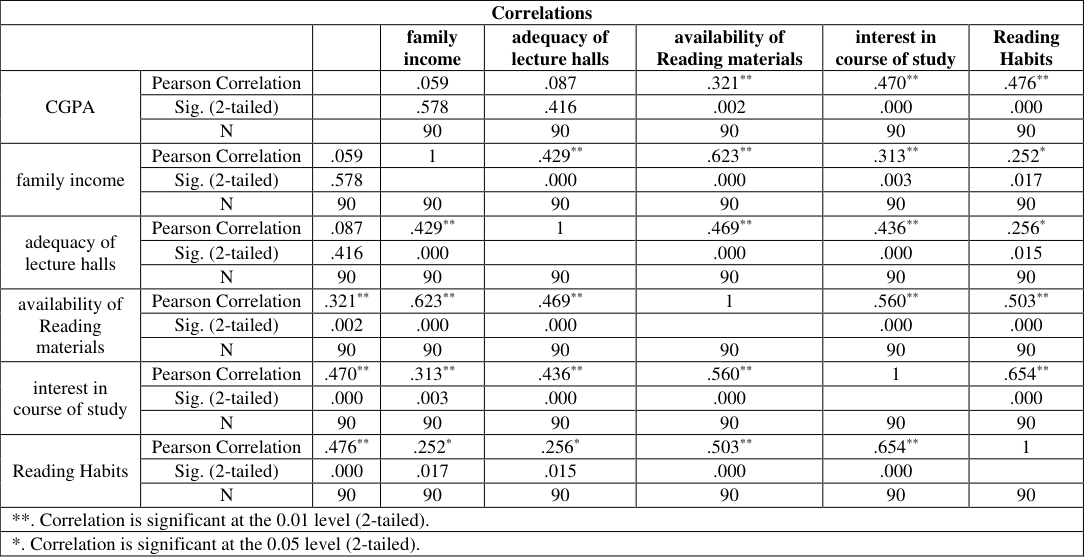 Table 4
Introduction
Students' academic gain and learning performance is affected by numerous factors including age, teaching facilities, students' schooling, parent/guardian socio economic status, residential area of students, medium of instructions in schools, tuition trend, daily study hour and accommodation as hostels (Shoukat et al. 2013) [9] .
Academic Performance CGPA
Academic performance refers to the level of performance in school, accomplishment or success in school. However, academic performance is the core of educational growth (Aremu and Oluwole, 2001) [3] .
Statement of the Problem
The most prevalent argument is that the socioeconomic status of learners affects the quality of their academic performance. Student academic performance measurement has been a challenging issue in social, educational, psychological, environmental and personal factors. The utility of these studies lies in the need to undertake corrective measures that improve the academic performance of graduate students. Among all factors, socioeconomic status is one of the most researched and debated factor among educational professionals that contribute towards the academic performance of students. These factors strongly influence students' academic pursuit though they vary from person to person. This study, therefore aims to identify and analyse some determinant factors of academic performance in tertiary institutions. This research will therefore consider family socio-economic status, adequacy of lecture halls, availability of reading materials, interest in course of study and reading habits as factors that determine the academic performance of students.
Relationship between Reading Habits, Family Income and CGPA
Okewole (2012) [7] pointed out that students reading habit and mothers' educational qualification have significant relationship with students' academic performance and concluded that regular tests and assignments and proper monitoring of students' reading habits will be enough to have positive influence on their academic performance. Considine and Zappala (2002) [4] also noticed that parent's income or social status positively affects the student test score in examination.
Relationship between Interest in Course of study and CGPA
Akey (2006) [2] cited that students' beliefs about their competence and their expectations for success in school have been directly linked to their levels of engagement, as well as to emotional states that promote or interfere with their ability to be academically successful.
Relationship between Adequacy of lecture halls, Availability of Reading Materials and CGPA
The availability, provision and the use of teaching and learning materials go a long way to improve quality of teaching which enhances academic performance. Earthman (2002) [5] and Adeogun (1999) [1] in their separate researched explained how adequacy of school facilities affect the morale of students. Opare (1999) [8] also asserted that the provision of the needed human and material resources goes a long way to enhance academic performance.
Methodology 2.1 Source and Data Collection Procedure
Data were sourced primarily through structured questionnaire. A sample of 100 students was considered using purposive sampling and a response value of 90 respondents was obtained. Students of the department of Statistics, Ahmadu Bello University were considered to be the sampling space.
Model Specification
The model used in this study is multiple linear regression model. Regression analysis is the study of the nature and extent of relationship between two or more variables with a view of predicting the value of one variable from the other. It is used when the focus is on the relationship between a dependent variable and one or more independent variables. More specifically, regression analysis helps us to understand how the typical value of the dependent variable changes when one of the independent variables varies, while the other independent variables are held fixed (Montgomery, 2005) [6] . In this case, it attempted to look at the effects or the relationship between a dependent (responsible) variable and number independent (explanatory) variables. With regard to this study, the dependent variable is Cumulative Grade Point Average (CGPA) and the independent or explanatory variables are family income (FI), adequacy of lecture halls (ALH), availability of reading materials (ARM), interest in course of study (ICS), and reading habits (RH). The model is therefore specified as: Y = β 0 + β 1 X 1 + β 2 X 2 + β 3 X 3 + β 4 X 4 + β 5 X 5 + eij. Letting CGPA = Y, X 1 = family income (FI), X 2 = adequacy of lecture halls (ALH), X 3 = availability of reading materials (ARM), X 4 = interest in course of study (ICS), X 5 = reading habits (RH). The model is re-specified as: CGPA = β 0 + β 1 (FI) + β 2 (ALH) + β 3 (ARM) + β 4 (ICS) + β 5 (RH) = eij, where β 0 , β 1 , β 2 , β 3 , β 4 and β 5 are the regression coefficients which are estimated from the sample data. The eij is the random error term.
Method of Data Analysis
All data collected were sorted out, edited and collated using simple tables in order to ease developing of classical insights on the data. Tables enable quicker interpretations and drawing help in meaningful conclusions. Statistical Package for Social Scientists (SPSS) software was used to conduct the inferential statistical analysis.
Model Adequacy Checking
This is done first by testing for individual regression coefficients. The dependence of Y and Xj can be assessed by testing the significance of βj. The hypothesis is H 0 : βj = 0 and H 1 : βj ≠ 0 If the hypothesis is true, none of the independent variables X 1 , X 2 , …, X k . is linearly related to Y otherwise they are linearly related.
Results and Discussions 3.1 Model Formulation
The linear regression model is developed as follows using the output results (coefficients) below: given that all the predictors are zero, all other factors held constant. On the other hand the coefficients of x 1 (family income) and x2 (adequacy of lecture halls) of -0.169 and -2.10 implies the magnitude by which CGPA would decrease per unit change in both x 1 and x 2 . Likewise, the coefficients of X 3 (availability of reading materials), X 4 (interest in course of study) and X 5 (reading habits) of 0.185, 0.371 and 0.256 respectively indicate how much the CGPA would increase per unit change in x 1 , x 2 and x 3 . The R value of 0.551 shows that there exist a strong positive relationship between Academic Performance (CGPA) as dependent variable and family income, adequacy of lecture halls, availability of reading materials, interest in course of study and reading habits as independent variable. This implies that the behavioural patterns of the predictors did affect the CGPA. While the R 2 value of 0.304 indicates that 30.4% of the variations in academic performance of the students is explained by the predictor variables (family income, adequacy of lecture halls, availability of reading materials, interest in course of study and reading habits). Hypothesis: H0: β1 = β2 = … = βk (The model is not significant), H1: βk ≠ 0, for at least one j (The model is significant) Level of significance is (α = 0.05). The test statistic is F-test and the Decision Criteria is Reject H 0 if p-value < 0.05 level of significance.
Model Summary of Other Regression Coefficients
Model Summary of Other Regression Coefficients
Analysis of Variance (ANOVA)
Analysis of Variance (ANOVA)
Conclusion
Since P-value (0.000) < 0.05 level of significance. We therefore reject H 0 and conclude that the model is significant. Table 4 above shows that there is a weak positive association between Academic Performance (CGPA) of the students under study with their family income with a correlation value of (0.059) which is not statistically significant with p-value 0.578>0.05 level of significance. Furthermore, the association between adequacy of lecture halls and academic performance (CGPA) is quite very weak, with a correlation of 0.087 which indicates it is statistically not significant with p-value 0.416 at 0.05 level of significance. Likewise the association between Academic Performance with availability of reading materials, Interest in course of study and Reading habits indicates a positive association with correlation values of 0.32, 0.47 and 0.48 respectively. This also shows a statistical significance with p-values 0.02, 0.000 and 0.000 < 0.05 respectively at 5% level of significance.
| Correlations | — | — | — | — | — | — | — |
|---|---|---|---|---|---|---|---|
| family income | adequacy of lecture halls | availability of Reading materials | interest in course of study | Reading Habits | |||
| CGPA | Pearson Correlation | .059 | .087 | .321** | .470** | .476** | |
| Sig. (2-tailed) | .578 | .416 | .002 | .000 | .000 | ||
| N | 90 | 90 | 90 | 90 | 90 | ||
| family income | Pearson Correlation | .059 | 1 | .429** | .623** | .313** | .252* |
| Sig. (2-tailed) | .578 | .000 | .000 | .003 | .017 | ||
| N | 90 | 90 | 90 | 90 | 90 | 90 | |
| adequacy of lecture halls | Pearson Correlation | .087 | .429** | 1 | .469** | .436** | .256* |
| Sig. (2-tailed) | .416 | .000 | .000 | .000 | .015 | ||
| N | 90 | 90 | 90 | 90 | 90 | 90 | |
| availability of Reading materials | Pearson Correlation | .321** | .623** | .469** | 1 | .560** | .503** |
| Sig. (2-tailed) | .002 | .000 | .000 | .000 | .000 | ||
| N | 90 | 90 | 90 | 90 | 90 | 90 | |
| interest in course of study | Pearson Correlation | .470** | .313** | .436** | .560** | 1 | .654** |
| Sig. (2-tailed) | .000 | .003 | .000 | .000 | .000 | ||
| N | 90 | 90 | 90 | 90 | 90 | 90 | |
| Reading Habits | Pearson Correlation | .476** | .252* | .256* | .503** | .654** | 1 |
| Sig. (2-tailed) | .000 | .017 | .015 | .000 | .000 | ||
| N | 90 | 90 | 90 | 90 | 90 | 90 | |
| **. Correlation is significant at the 0.01 level (2-tailed). | |||||||
| *. Correlation is significant at the 0.05 level (2-tailed). |
Table text extracted from the original PDF; superscript letters are shown inline. The original table image is below.
View original table image
Results of Correlation Analysis
Results of Correlation Analysis
Conclusion
The study revealed that interest in course of study and readings habits have significant effects on students' academic performance since their individual p-values are both less than 0.05. The study also indicated that there exist a positive correlation (relationship) of 0.551 between CGPA, family income, adequacy of lecture halls, availability of reading materials, interest in course of study and reading habits. This therefore implies that the behavioural patterns of family income, adequacy of lecture halls, availability of reading materials, interest in course of study and reading habits had some influence on the CGPA. In addition, the study revealed an R 2 value of 0.34 (30.3%), this implies that approximately 30% of the variations in CGPA are explained by family income, adequacy of lecture halls, availability of reading materials, interest in course of study and reading habits. Therefore, there are about 70% of the changes in CGPA that are not accounted for by family income, adequacy of lecture halls, availability of reading materials, interest in course of study and reading habits. It can also be concluded from the findings that indeed there exist some relationship between CGPA, family income, adequacy of lecture halls, availability of reading materials, interest in course of study and reading habits as already established and this is given by the linear regression model: Y = 1.730 -0.169 (FI) -0.210 (ALH) + 0.185 (ARM) + 0.371 (ICS) + 0.256 (RH) where FI, ALH, ARM, ICS and RH denote their usual meanings.
Recommendations
Since the model revealed that availability of reading materials, interest in course of study and reading habits contribute significantly to the model, the following recommendations are therefore necessary: 1. Teachers should device modern techniques of teaching to arouse students' interest in learning which will improve their academic performance. 2. Students should be motivated and encouraged by their lectures to read different information resources other than their notebooks and handouts so as to be exposed to diverge and broader views to knowledge. 3. Academic institutions should encourage students to have a blueprint of their time schedule for reading. 4. Academic institutions should provide an enabling environment that will encourage students' reading habits and thus enhance academic achievement.
Acknowledgement
The first author wishes to acknowledge the moral and financial support of his parents throughout the duration of the research.
Figures and tables from the paper
| Regression Coefficientsa | — | — | — | — | — | — |
|---|---|---|---|---|---|---|
| Model | Unstandardized Coefficients | Standardized Coefficients | t | Sig. | ||
| B | Std. Error | Beta | ||||
| 1 | (Constant) | 1.730 | .482 | 3.587 | .001 | |
| Family Income (x1) | -.169 | .129 | -.156 | -1.308 | .195 | |
| Adequacy of Lecture Halls (x2) | -.210 | .177 | -.129 | -1.182 | .240 | |
| Availability of Reading Materials (x3) | .185 | .146 | .176 | 1.269 | .208 | |
| Interest in Course of Study (x4) | .371 | .161 | .308 | 2.306 | .024 | |
| Reading Habits (x5) | .256 | .123 | .258 | 2.075 | .041 | |
| Dependent Variable: CPGA |
Table text extracted from the original PDF; superscript letters are shown inline. The original table image is below.
View original table image
| Model Summary | — | — | — | — |
|---|---|---|---|---|
| Model | R | R Square | Adjusted R Square | Std. Error of the Estimate |
| 1 | .551a | .304 | .262 | .63500 |
| a. Predictors: (Constant), Reading Habits, family income, adequacy of lecture halls, interest in course of study, availability of Reading materials |
Table text extracted from the original PDF; superscript letters are shown inline. The original table image is below.
View original table image
| Anovaa | — | — | — | — | — | — |
|---|---|---|---|---|---|---|
| Model | Sum of Squares | Df | Mean Square | F | Sig. | |
| 1 | Regression | 14.777 | 5 | 2.955 | 7.330 | .000 |
| Residual | 33.871 | 84 | .403 | |||
| Total | 48.648 | 89 | ||||
| a. Dependent Variable: CGPA | ||||||
| b. Predictors: (Constant), Reading Habits, family income, adequacy of lecture halls, interest in course of study, availability of Reading materials |
Table text extracted from the original PDF; superscript letters are shown inline. The original table image is below.
View original table image
References
9 in the original paper- Adeogun AA. School plant planning and facilities management. Lagos: Frank Unity limited, 1999.
- Akey TM. School context, student attitudes and behavior, and academic achievement: An exploratory analysis. New York: MDRC, 2006.
- Aremu OA, Oluwole DA. Gender and birth order as predictors of normal pupil's anxiety pattern in examination. Ibadan J. Educ. Studies. 2001; 1(1):1-7.
- Considine G, Zappala G. Influence of social and economic disadvantage in the academic performance of school students in Australia. Journal of Sociology. 2002; 38:129-148.
- Earthman GI. School facilities conditions and students' academic achievement. California: UCLA Institute for Democracy, Education and Access, 2002.
- Montgomery DC. Design and Analysis of experiments: A Supplement for Using JMP (R). SAS Institute Inc., Cary, North Carolina, USA, 2005.
- Okewole DM. A dummy variable regression on students' academic performance. Transnational Journal of Science and Technology. 2012; 2(6).
- Opare JA. Academic achievement in private and public schools: Management makes the different. Journal of Educational Management. 1999; 2:1-12.
- Shoukat A, Zubair H, Hamid K, Awais A. Factors Contributing to the Students' Academic Performance: A Case Study of Islamia University Sub-Campus. American Journal of Educational Research. 2013; 8:283-289. doi: 10.12691/education-1-8-3.
Cited by 1
From OpenAlex, OpenCitations and reference lists read by Scinovex
- Relationship between Emotional Intelligence and Academic Achievement in Algebra of First Year Mathematics and Science Education Students at the Copper belt University in Zambia ↗
International Journal of Humanities Social Sciences and Education · 2021
The aim of this study was to investigate the relationship between emotional intelligence and academic achievement in algebra (mathematics) among first year students in the Department of Mathematics and Science Education (DMSE) at the Copperbelt University in Zambia.Two cohorts (2016/2017 and 2017/2018) students in the DMSE were purposively selected for the study.One hundred and seven (25 females, 82 males) students…
❝ 0PDF