Scinovex

Research article · 2018 · Full text

International Journal of Statistics and Applied Mathematics

Survival analysis of broilers in two poultry farms in Kaloleni Sub County

Ndurya NgoloGeorge MuhuaErick Okuto

Volume 3(5) · Pages 28–32

Research areasLivestock and Poultry Management

↓ Read full-text PDF0 citations

Abstract

Author-written

This research is about a survival analysis on broilers in two poultry farms in Kaloleni sub-county. Chapter one gives an insight into the introduction of the paper, chapter two discusses the methodology used, chapter three gives the results, chapter four discusses the findings briefly and chapter five gives the conclusions arrived at and some recommendations.

Summary

Source-checked

Plain-language reading of the full paper, prepared with AI and checked against the text. Each point links to the authors' own words.

  1. Why it matters

    • Broilers are a type of poultry specifically raised for meat production. View evidence ↗

      Why it matters

      Broilers are a type of poultry specifically raised for meat production.

      In the paper's own words

      “Broilers are birds reared for meat.”

      Page 1

      Found in: Introduction

      Read it in the full textOpen PDF at page 1 ↗
    • Survival analysis is used in this context to determine the expected time until the death of the broilers occurs. View evidence ↗

      Why it matters

      Survival analysis is used in this context to determine the expected time until the death of the broilers occurs.

      In the paper's own words

      “Survival analysis is a branch of statistics which deals with analyzing the expected time until one or more events (in this case, death of broilers) happen.”

      Page 1

      Found in: Introduction

      Read it in the full textOpen PDF at page 1 ↗
    • The authors argue that previous studies focusing only on hazard rates were inadequate for showing bird trends, necessitating a full survival analysis. View evidence ↗

      Why it matters

      The authors argue that previous studies focusing only on hazard rates were inadequate for showing bird trends, necessitating a full survival analysis.

      In the paper's own words

      “Some of them include and many more did a similar task however their studies were based on the hazard rates only which is inadequate to show the trend of the birds whereas this research did a survival analysis of the broilers.”

      Page 1

      Found in: Introduction

      Read it in the full textOpen PDF at page 1 ↗
  2. The question

    • The study aims to perform a survival analysis of broilers across two different poultry farms located in Kaloleni sub-county. View evidence ↗

      The question

      The study aims to perform a survival analysis of broilers across two different poultry farms located in Kaloleni sub-county.

      In the paper's own words

      “This research is about a survival analysis on broilers in two poultry farms in Kaloleni sub-county.”

      Page 1

      Found in: Methodology

      Read it in the full textOpen PDF at page 1 ↗
  3. What they did

    • The researchers tagged samples of 20 broilers from la Nyevu farm and 30 broilers from Detʼeni farm. View evidence ↗

      What they did

      The researchers tagged samples of 20 broilers from la Nyevu farm and 30 broilers from Detʼeni farm.

      In the paper's own words

      “Two samples of 20 and 30 broilers from la Nyevu and Detʼeni poultry farms in Kaloleni sub-county respectively, were tagged.”

      Page 1

      Found in: Methodology

      Read it in the full textOpen PDF at page 1 ↗
    • The observation period for the sampled birds lasted for 28 days. View evidence ↗

      What they did

      The observation period for the sampled birds lasted for 28 days.

      In the paper's own words

      “These sampled broilers were observed for a period of 28 days then the observation stopped.”

      Page 1

      Found in: Methodology

      Read it in the full textOpen PDF at page 1 ↗
    • R software was utilized to determine various survival functions for the data analysis. View evidence ↗

      What they did

      R software was utilized to determine various survival functions for the data analysis.

      In the paper's own words

      “Different survival functions were determined using the R software for analysis.”

      Page 1

      Found in: Methodology

      Read it in the full textOpen PDF at page 1 ↗
    • A log-rank test was employed to compare the survival curves of Farm A (control) and Farm B (treatment). View evidence ↗

      What they did

      A log-rank test was employed to compare the survival curves of Farm A (control) and Farm B (treatment).

      In the paper's own words

      “The research used the log-rank test statistic to test H0: s1 (t) = s2 (t) against H1:s1 (t) ≠ s2 (t), where farm A was assumed to be the control farm, and farm B was the treatment farm.”

      Page 2

      Found in: Testing of Hypothesis of survival curves

      Read it in the full textOpen PDF at page 2 ↗
  4. What they found

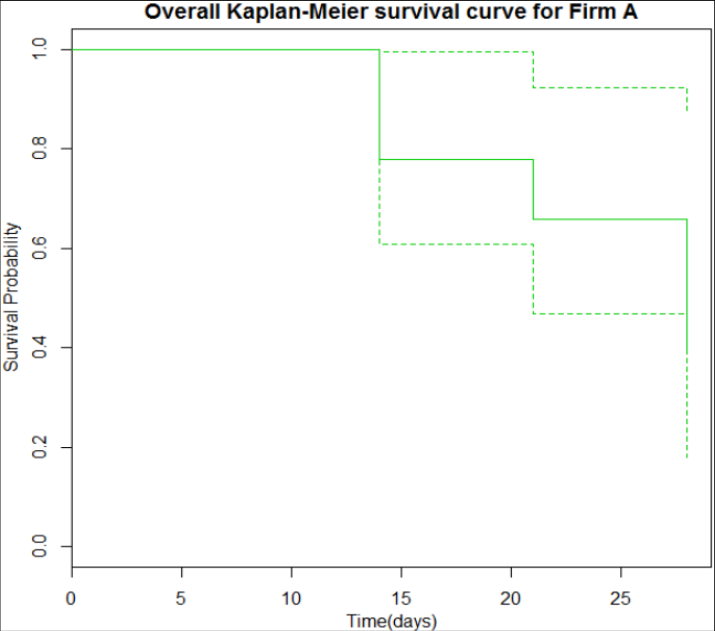
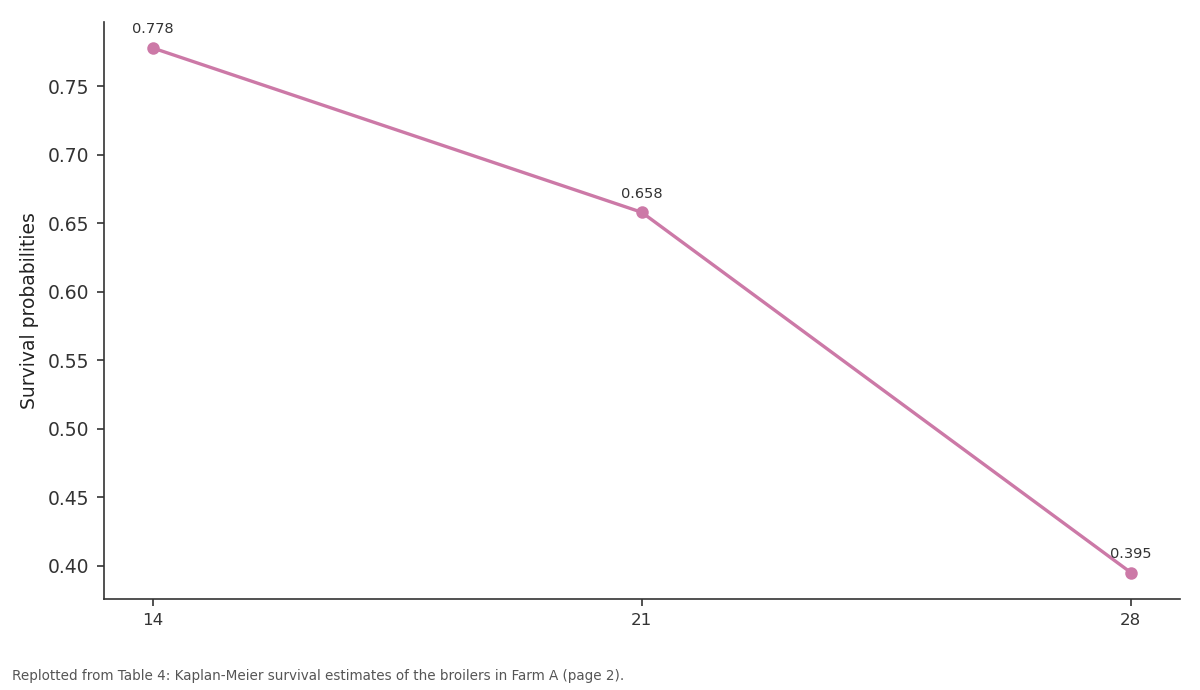
    • In Farm A, survival probabilities decreased from 0.778 at 14 days to 0.395 by 28 days. View evidence ↗

      What they found

      In Farm A, survival probabilities decreased from 0.778 at 14 days to 0.395 by 28 days.

      In the paper's own words

      “14 | 18 | 4 | 0.778”

      Page 2

      “21 | 13 | 2 | 0.658”

      Page 2

      “28 | 5 | 2 | 0.395”

      Page 2

      Found in: Table 4

      Read it in the full textOpen PDF at page 2 ↗
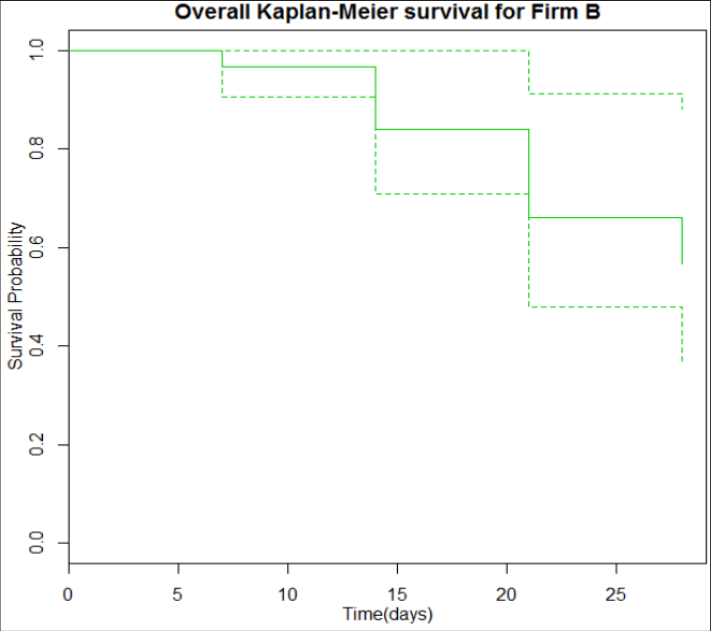
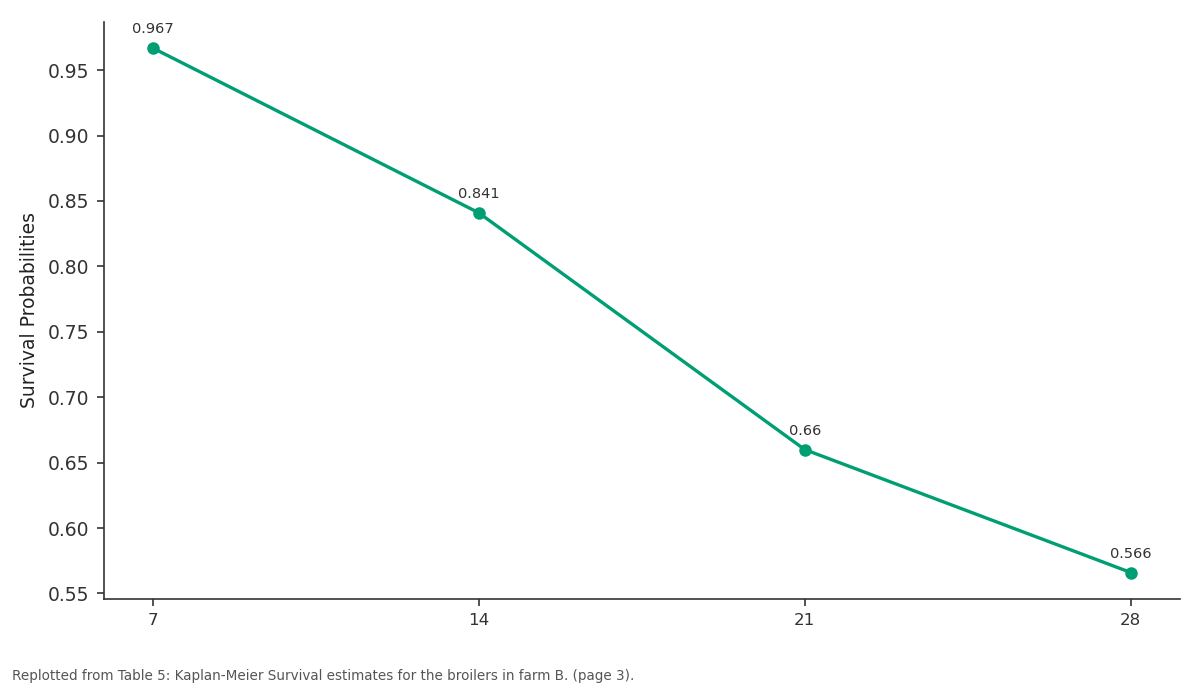
    • In Farm B, survival probabilities were 0.967 at 7 days and dropped to 0.566 by 28 days. View evidence ↗

      What they found

      In Farm B, survival probabilities were 0.967 at 7 days and dropped to 0.566 by 28 days.

      In the paper's own words

      “7 | 30 | 1 | 0.967”

      Page 3

      “14 | 23 | 3 | 0.841”

      Page 3

      “21 | 14 | 3 | 0.660”

      Page 3

      “28 | 7 | 1 | 0.566”

      Page 3

      Found in: Table 5

      Read it in the full textOpen PDF at page 3 ↗
    • The difference in survival rates between Farm A and Farm B was not statistically significant (p = 0.635). View evidence ↗

      What they found

      The difference in survival rates between Farm A and Farm B was not statistically significant (p = 0.635).

      In the paper's own words

      “The difference in the survival rates of the broilers in farms A and B are non-significant at 0.05 level of significance with a p-value of 0.635 which is greater than 0.05.”

      Page 4

      Found in: Results

      Read it in the full textOpen PDF at page 4 ↗
    • The proportional hazards assumption for the Cox model was not violated, as indicated by a p-value of 0.741. View evidence ↗

      What they found

      The proportional hazards assumption for the Cox model was not violated, as indicated by a p-value of 0.741.

      In the paper's own words

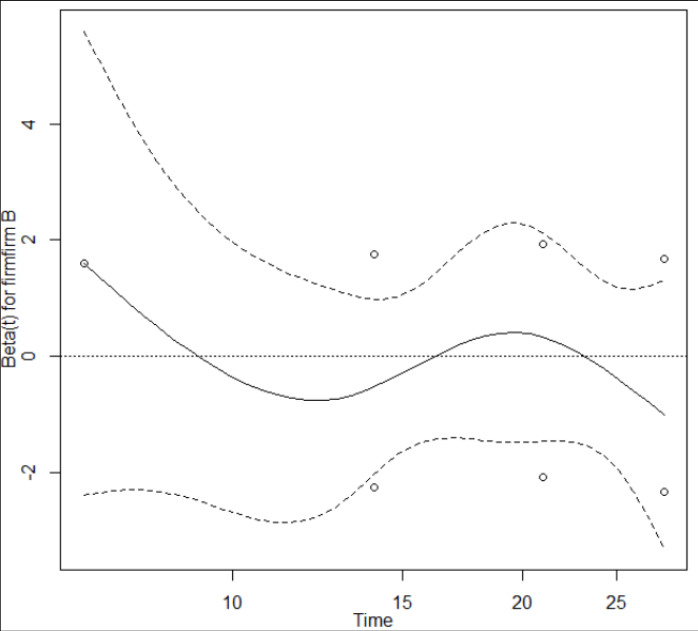
      “These results indicate that the proportional hazards assumption was not violated at 5% level of significance in the entire study period with a p-value of 0.741 which is greater than 0.05.”

      Page 4

      Found in: Results

      Read it in the full textOpen PDF at page 4 ↗
  5. What it means

    • The authors conclude that there is no significant difference in survival rates between the two selected poultry farms. View evidence ↗

      What it means

      The authors conclude that there is no significant difference in survival rates between the two selected poultry farms.

      In the paper's own words

      “It is therefore apparent that there is no significant difference between the survival rates of the broilers in the two select poultry farms.”

      Page 5

      Found in: Discussion

      Read it in the full textOpen PDF at page 5 ↗
    • The authors recommend that agriculturalists increase farmer sensitization on proper farming procedures to reduce losses and increase revenue. View evidence ↗

      What it means

      The authors recommend that agriculturalists increase farmer sensitization on proper farming procedures to reduce losses and increase revenue.

      In the paper's own words

      “Such a scenario borders on the fact that agriculturalists should do even more to sensitize the farmers on proper farming procedures so as to increase revenue and reduce losses”

      Page 5

      Found in: Discussion

      Read it in the full textOpen PDF at page 5 ↗
    • The authors suggest that the government provide more financial and personnel resources at the grassroots level to inform farmers of the best poultry methods. View evidence ↗

      What it means

      The authors suggest that the government provide more financial and personnel resources at the grassroots level to inform farmers of the best poultry methods.

      In the paper's own words

      “The government should put more resources in terms of personnel and money in the grassroots to enable each farmer gets information on the best poultry methods to undertake in order to realize the millennium goals.”

      Page 5

      Found in: Conclusion

      Read it in the full textOpen PDF at page 5 ↗

Visual summary

3 visuals

Illustrations explain the paper; charts are replotted from the paper's own table values.
AI-generated illustration
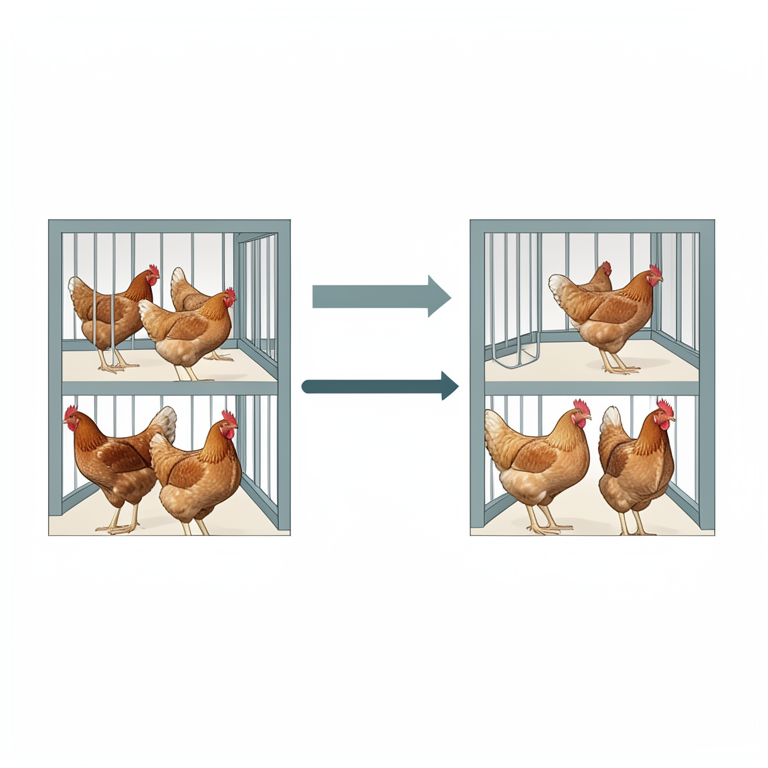
AI-generated conceptual illustration (broiler chickens in poultry farm pens). It explains the idea and does not show study data.↗ Enlarge
Study Design Overview
AI-generated conceptual illustration (broiler chickens in poultry farm pens). It explains the idea and does not show study data.

AI-generated conceptual illustration (broiler chickens in poultry farm pens). It explains the idea and does not show study data.

Open full-size image ↗

Study Design Overview

AI-generated conceptual illustration (broiler chickens in poultry farm pens). It explains the idea and does not show study data.

View source evidence ↗
Replotted from source data
Replotted from Table 4 (page 2) of the original paper. Every bar is the paper's own table value.↗ Enlarge
Survival probabilities: 14 vs 21 vs 28
Replotted from Table 4 (page 2) of the original paper. Every bar is the paper's own table value.

Replotted from Table 4 (page 2) of the original paper. Every bar is the paper's own table value.

Open full-size image ↗

Survival probabilities: 14 vs 21 vs 28

Replotted from Table 4 (page 2) of the original paper. Every bar is the paper's own table value.

View source evidence ↗
Replotted from source data
Replotted from Table 5 (page 3) of the original paper. Every bar is the paper's own table value.↗ Enlarge
Survival Probabilities: 7 vs 14 vs 21 vs 28
Replotted from Table 5 (page 3) of the original paper. Every bar is the paper's own table value.

Replotted from Table 5 (page 3) of the original paper. Every bar is the paper's own table value.

Open full-size image ↗

Survival Probabilities: 7 vs 14 vs 21 vs 28

Replotted from Table 5 (page 3) of the original paper. Every bar is the paper's own table value.

View source evidence ↗

Figures & tables

From the original paper
Survival curve based on the Kaplan-Meier Estimation techniqueTable 1Page 2Survival curve based on Nelson Aalen estimationTable 2Page 2A 2x2 table used to compute value for log rank test for equality of curvesTable 3Page 2Kaplan-Meier survival estimates of the broilers in Farm ATable 4Page 2Kaplan-Meier Survival estimates for the broilers in farm B.Table 5Page 3Kaplan-Meier survival curve for the broilers in farm A.Figure 1Page 3Kaplan-Meier Survival curve for the broilers in farm B.Figure 2Page 3Log-rank test results for comparing the survival rates of broilers in farms A and B.Table 6Page 4Results of fitting the Cox PH model to assess the effect of the covariate firm on theTable 7Page 4Results of evaluating the proportional hazards assumption on the covariate firm using Schoenfeld residuals.Table 8Page 4Survival curves of broilers in farms A and B.Figure 3Page 4The plot of the scaled Schoenfeld residuals of the covariate farm against log time.Figure 4Page 5
FULL TEXT Original article · reflowed for reading

Introduction

Broilers are birds reared for meat. Survival analysis is a branch of statistics which deals with analyzing the expected time until one or more events (in this case, death of broilers) happen. Many different researchers have tried to study this scenario. Some of them include and many more did a similar task however their studies were based on the hazard rates only which is inadequate to show the trend of the birds whereas this research did a survival analysis of the broilers.

Methodology

Two samples of 20 and 30 broilers from la Nyevu and Detʼeni poultry farms in Kaloleni subcounty respectively, were tagged. These sampled broilers were observed for a period of 28 days then the observation stopped. Different survival functions were determined using the R software for analysis.

The Survivor function, s (t)

This is a function that gives the probability that a broiler will survive beyond any given specified time. Let T, be the time to failure. The survivor function at a time t is defined as, s (t) = pr (T>t), which is the probability that a broiler doesn't die within the interval (0, t). s (t) = pr (T>t) = 1-pr (T≤t), But pr (T≤t

The product limit (Kaplan-Meier) estimator of the survivor function

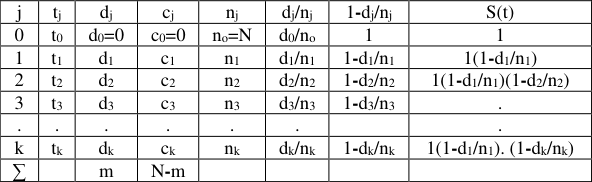
It is a non-parametric statistic used to estimate the survival function from life time data. This research assumed a discrete failure time distribution with probability f j , at the many points, u 0 ≤u 1 ≤u 2 ≤u 3 ≤u 4 ≤u 5 ≤… The K-M estimate is a table called ‛life-tableʼ. Let N = sample size. t j = the time at death for j = 1, 2, 3,….k such that t< 1 t 2< t 3 ……<t k. d j = number of deaths at time t j , d 1 +d 2 +…d k = m. c j = the total number of birds censored = N-m. n j = the number of birds at risk just before time t j . The K-M estimator is given by, S (t) = Π [1-(d j /n j )]. In tabular form it is as given below.

Estimation of the integrated hazard function

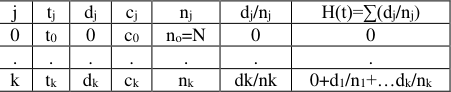
When T is continuous, we have seen previously that, s (t) = e -H(t) , where H(t) is the integrated hazard function. By using logarithms, it gives Log s (t) = -H (t) and now H (t) = -log s (t). For the discrete case, s (t) = ∏ (1-h j ). The K-M estimator, s (t) = ∏ (1-h j ) = ∏ (1-d j /r j ). H (t) = -log s (t) = -∑log (1-d j /r j ). h j = d j /r j , therefore H(t) = -∑log(1-h j ) for the discrete case. If the h j are small then h j ≈ -log (1-h j ) so that H (t) = ∑h j. H (t) ≈ ∑d j /n j, which is the Nelson-Aallen estimator of H (t). In tabular form, it is given as

Testing of Hypothesis of survival curves

The research used the log-rank test statistic to test H 0 : s 1 (t) = s 2 (t) against H 1: s 1 (t) ≠ s 2 (t), where farm A was assumed to be the control farm, and farm B was the treatment farm. Let t 1 <t 2 <…. < t k , be the times to death of broilers that are ordered. If at time t j , for j=1, 2... k. d j = total number of events, n j =broilers at risk, d ij = number of deaths for farm i, i=1,2. n ij = those at risk in farm i=1, 2. This information can be summarized in a 2x2 contingency table as follows. At time t j ]/√(∑vard 1j )] ~ N(0, 1), then Z 2 ~ χ 2 with 1 df. This is the log-rank test statistic. If the Z 2 calculated value is less than χ 2 with 1 df at 95% level of significance then the null hypothesis is rejected, otherwise it is accepted.

Results

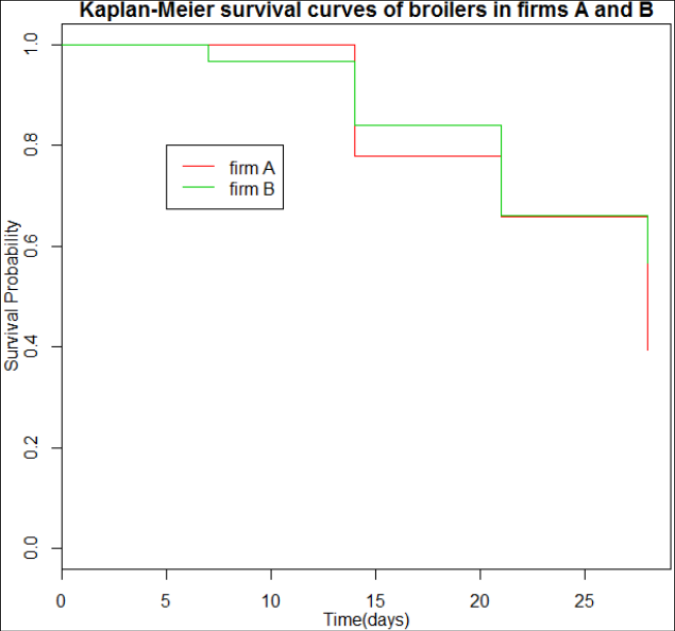
The results were obtained using the R software for data analysis As the K-M curves indicate, broilers in farm A have similar survival rates as compared to broilers in farm B. The difference in the survival rates of the broilers in farms A and B are non-significant at 0.05 level of significance with a p-value of 0.635 which is greater than 0.05. These results indicate that the proportional hazards assumption was not violated at 5% level of significance in the entire study period with a p-value of 0.741 which is greater than 0.05. The proportionality assumption was also assessed graphically by plotting the scaled Schoenfeld residuals of the covariate firm against log-time. There was no trend or pattern with time throughout the study period.

Discussion

It is therefore apparent that there is no significant difference between the survival rates of the broilers in the two select poultry farms. Such a scenario borders on the fact that agriculturalists should do even more to sensitize the farmers on proper farming procedures so as to increase revenue and reduce losses

Conclusion

The government should put more resources in terms of personnel and money in the grassroots to enable each farmer gets information on the best poultry methods to undertake in order to realize the millennium goals.

Acknowledgement

I take this opportunity to thank the Almighty God for guiding me through the entire period of my studies at C.U.E.A. I thank the DVC-Academics, Prof. Kaku Sagary Nokoe for his unwavering support in making sure that the study at C.U.E.A is smooth. I also thank, our H.O.D, Mr. Mbaya, more regards go to our two former deans of faculty, Prof. Karoki and Dr. Bethwel, not forgetting our library staff. May the Almighty God bless all abundantly.

Figures and tables from the paper

Table 1. Survival curve based on the Kaplan-Meier Estimation technique
jtjdjcjnjdj/nj1-dj/njS(t)
0t0d0=0c0=0no=Nd0/no11
1t1d1c1n1d1/n11-d1/n11(1-d1/n1)
2t2d2c2n2d2/n21-d2/n21(1-d1/n1)(1-d2/n2)
3t3d3c3n3d3/n31-d3/n3.
.......
ktkdkcknkdk/nk1-dk/nk1(1-d1/n1). (1-dk/nk)
∑mN-m

Table text extracted from the original PDF; superscript letters are shown inline. The original table image is below.

View original table image
Survival curve based on the Kaplan-Meier Estimation technique↗ Enlarge
Table 1
Survival curve based on the Kaplan-Meier Estimation technique

Survival curve based on the Kaplan-Meier Estimation technique

Open full-size image ↗
Original paper tableSource PDF · page 2 ↗
Table 2. Survival curve based on Nelson Aalen estimation
jtjdjcjnjdj/njH(t)=∑(dj/nj)
0t00c0no=N00
.......
ktkdkcknkdk/nk0+d1/n1+…dk/nk

Table text extracted from the original PDF; superscript letters are shown inline. The original table image is below.

View original table image
Survival curve based on Nelson Aalen estimation↗ Enlarge
Table 2
Survival curve based on Nelson Aalen estimation

Survival curve based on Nelson Aalen estimation

Open full-size image ↗
Original paper tableSource PDF · page 2 ↗
Table 3. A 2x2 table used to compute value for log rank test for equality of curves
—Number deadNumber aliveNumber at risk
Farm Ad1jnij-d1jn1j
Farm Bd2jn2j-d2jn2j
djnj-djnj

Table text extracted from the original PDF; superscript letters are shown inline. The original table image is below.

View original table image
A 2x2 table used to compute value for log rank test for equality of curves↗ Enlarge
Table 3
A 2x2 table used to compute value for log rank test for equality of curves

A 2x2 table used to compute value for log rank test for equality of curves

Open full-size image ↗
Original paper tableSource PDF · page 2 ↗
Table 4. Kaplan-Meier survival estimates of the broilers in Farm A
Kaplan-Meier survival estimates of the broilers in Farm A↗ Enlarge
Table 4
Kaplan-Meier survival estimates of the broilers in Farm A

Kaplan-Meier survival estimates of the broilers in Farm A

Open full-size image ↗
Original paper figureSource PDF · page 2 ↗
Table 5. Kaplan-Meier Survival estimates for the broilers in farm B.
Kaplan-Meier Survival estimates for the broilers in farm B.↗ Enlarge
Table 5
Kaplan-Meier Survival estimates for the broilers in farm B.

Kaplan-Meier Survival estimates for the broilers in farm B.

Open full-size image ↗
Original paper figureSource PDF · page 3 ↗
Figure 1. Kaplan-Meier survival curve for the broilers in farm A.
Kaplan-Meier survival curve for the broilers in farm A.↗ Enlarge
Figure 1
Kaplan-Meier survival curve for the broilers in farm A.

Kaplan-Meier survival curve for the broilers in farm A.

Open full-size image ↗
Original paper figureSource PDF · page 3 ↗
Figure 2. Kaplan-Meier Survival curve for the broilers in farm B.
Kaplan-Meier Survival curve for the broilers in farm B.↗ Enlarge
Figure 2
Kaplan-Meier Survival curve for the broilers in farm B.

Kaplan-Meier Survival curve for the broilers in farm B.

Open full-size image ↗
Original paper figureSource PDF · page 3 ↗
Table 6. Log-rank test results for comparing the survival rates of broilers in farms A and B.
FirmNumber at Risk of DeathObserved DeathsExpected Deaths(O-E)2/E(O-E)2/V
Farm A2087.130.10600.225
Farm B3088.870.08520.225

Table text extracted from the original PDF; superscript letters are shown inline. The original table image is below.

View original table image
Log-rank test results for comparing the survival rates of broilers in farms A and B.↗ Enlarge
Table 6
Log-rank test results for comparing the survival rates of broilers in farms A and B.

Log-rank test results for comparing the survival rates of broilers in farms A and B.

Open full-size image ↗
Original paper tableSource PDF · page 4 ↗
Table 7. Results of fitting the Cox PH model to assess the effect of the covariate firm on the
—CoefExp (coef)Exp (-coef)Se (coef)zPr (>|z|)Confidence imterval—
Lower 95%Upper 95%
FarmB-0.21880.80341.2450.5007-0.4370.6620.30112.144

Table text extracted from the original PDF; superscript letters are shown inline. The original table image is below.

View original table image
Results of fitting the Cox PH model to assess the effect of the covariate firm on the↗ Enlarge
Table 7
Results of fitting the Cox PH model to assess the effect of the covariate firm on the

Results of fitting the Cox PH model to assess the effect of the covariate firm on the

Open full-size image ↗
Original paper tableSource PDF · page 4 ↗
Table 8. Results of evaluating the proportional hazards assumption on the covariate firm using Schoenfeld residuals.
Results of evaluating the proportional hazards assumption on the covariate firm using Schoenfeld residuals.↗ Enlarge
Table 8
Results of evaluating the proportional hazards assumption on the covariate firm using Schoenfeld residuals.

Results of evaluating the proportional hazards assumption on the covariate firm using Schoenfeld residuals.

Open full-size image ↗
Original paper figureSource PDF · page 4 ↗
Figure 3. Survival curves of broilers in farms A and B.
Survival curves of broilers in farms A and B.↗ Enlarge
Figure 3
Survival curves of broilers in farms A and B.

Survival curves of broilers in farms A and B.

Open full-size image ↗
Original paper figureSource PDF · page 4 ↗
Figure 4. The plot of the scaled Schoenfeld residuals of the covariate farm against log time.
The plot of the scaled Schoenfeld residuals of the covariate farm against log time.↗ Enlarge
Figure 4
The plot of the scaled Schoenfeld residuals of the covariate farm against log time.

The plot of the scaled Schoenfeld residuals of the covariate farm against log time.

Open full-size image ↗
Original paper figureSource PDF · page 5 ↗

References

7 in the original paper
  1. Arikan MS AA. Effects of Transportation, Distance, Slaughter Age, and Seasonal Factors on Total losses in Broiler Chickens. Brazilian Journal of Poultry Science, 2018.
  2. Chauvin CSH. Factors associated with mortality of broilers during transport to slaughter house. Animal, 2010.
  3. HM Timmerman AV. Mortality and Growth Perfomance of Broilers Given Drinking water supplemented with ChickenSpecific Probiostics. Poultry Science, 2006.
  4. Investopedia. Retrieved May 12, from Investopedia, 2018. https://www.investopedia.com/terms/h/hazard-rate.asp
  5. OK Awobajo Y. The mortality rate in two breeds of broilers on brooding stage. World applied sciences, 2018.
  6. Real-Statistics. Retrieved May 14, 2018. From www.real-statistics.co/survival-analysis/cox-regression/baseline-hazard-function. www.realstatistics.com/survival-analysis/cox-regression/baseline-hazard-function
  7. Reporter B. Better Business Better Life, 2016.