
Research article · 2018 · Full text
International Journal of Statistics and Applied MathematicsOptimization of special type double sampling plan using generalized Poisson distribution through minimum angle method
Volume 3(6) · Pages 10–13
Research areasAdvanced Statistical Process MonitoringTransport Systems and TechnologyMaterial Properties and Processing
Abstract
Author-writtenThis paper presents a procedure for designing a Special Type Double Sampling (STDS) plan indexed through Minimum Angle Method along with Operating Characteristic (OC) curve. In sampling plan, whenever there is a declined angle θ, the more nearly the OC curve approach an ideal form and it is achieved for the proposed plan using Generalized Poisson Distribution (GPD). Suitable tables are presented for the selection of the plan through Minimum Angle Method with declination in the OC curve. The designing procedures of the plan for various consumer’s and producer’s quality levels are developed using Minimum Angle Method, making an operating characteristic curve approaching to the ideal form. Theoretical and numerical evaluations are given with suitable illustrations.
Summary
Source-checkedPlain-language reading of the full paper, prepared with AI and checked against the text. Each point links to the authors' own words.
Why it matters
- Quality control serves as a statistical program designed to ensure products are free from defects during and after production. View evidence ↗
- The Poisson distribution is commonly used in acceptance sampling because its mean and variance are equal, a property known as equidispersion. View evidence ↗
- In real-world scenarios, production processes are often unstable, leading to quality variations in lots due to random fluctuations. View evidence ↗
- The Generalized Poisson Distribution (GPD) is better suited for unstable processes because it can handle both over-dispersion (variance > mean) and under-dispersion (variance < mean). View evidence ↗
- Single sampling plans often create conflicting interests between producers and consumers based on the acceptance number; Special Type Double Sampling (STDS) plans can mitigate this limitation. View evidence ↗
The question
- The study aims to determine the optimum parameters for a GPD-based sampling plan across various producer and consumer quality levels using the minimum angle method. View evidence ↗
What they did
- The STDS plan uses a two-phase approach: the first phase has an acceptance number of Ac = 0, and the second phase relaxes this to Ac = 1 for a larger sample size. View evidence ↗
- The operating procedure involves rejecting the lot if the first sample (n1) has one or more defectives; if zero defectives are found, a second sample (n2) is taken, and the lot is accepted only if it has one or fewer defectives. View evidence ↗
- Risk minimization is achieved by using the minimum angle method to make the Operating Characteristic (OC) curve approach an ideal form by minimizing the angle θ between specific quality level points. View evidence ↗
- The authors used a Goal Seek search procedure to find the optimum tangent angle, maintaining producer risk below 1% and consumer risk below 10%. View evidence ↗
What they found
- For a specific example with p1 = 0.0001 and p2 = 0.021, the optimum plan parameters were found to be n = 146 (n1=37, n2=110), λ2 = 0.7, and a minimum angle θ = 1.342. View evidence ↗
- Comparing different parameter sets, the minimum angle of 1.342 was identified as the optimum compared to other calculated angles such as 1.349. View evidence ↗
What it means
- The authors conclude that this optimization method is useful for safety and destructive testing, providing tables that protect both the producer and consumer. View evidence ↗
- The authors state that future research should investigate the economic aspects of the proposed sampling plan. View evidence ↗
Visual summary
2 visualsIllustrations explain the paper; charts are replotted from the paper's own table values.
STDS Decision Flowchart
AI-generated conceptual illustration (industrial manufactured metal components in a quality control setting). It explains the idea and does not show study data.
View source evidence ↗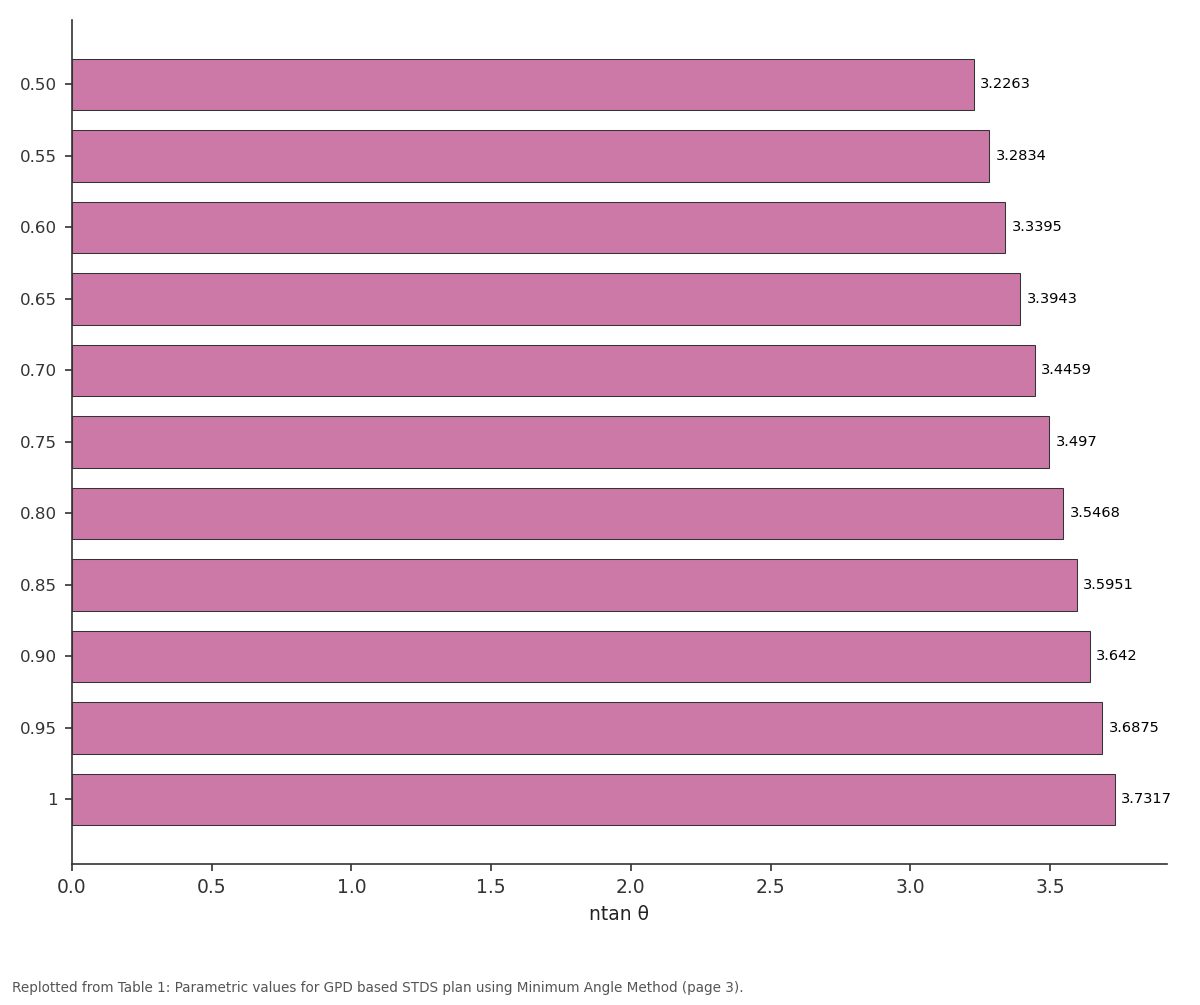
ntan θ: 0.50 vs 0.55 vs 0.60 vs 0.65 vs 0.70
Replotted from Table 1 (page 3) of the original paper. Every bar is the paper's own table value.
View source evidence ↗Figures & tables
From the original paper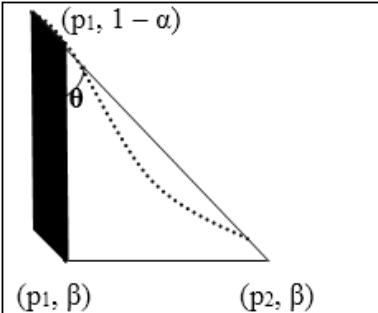 Figure 1
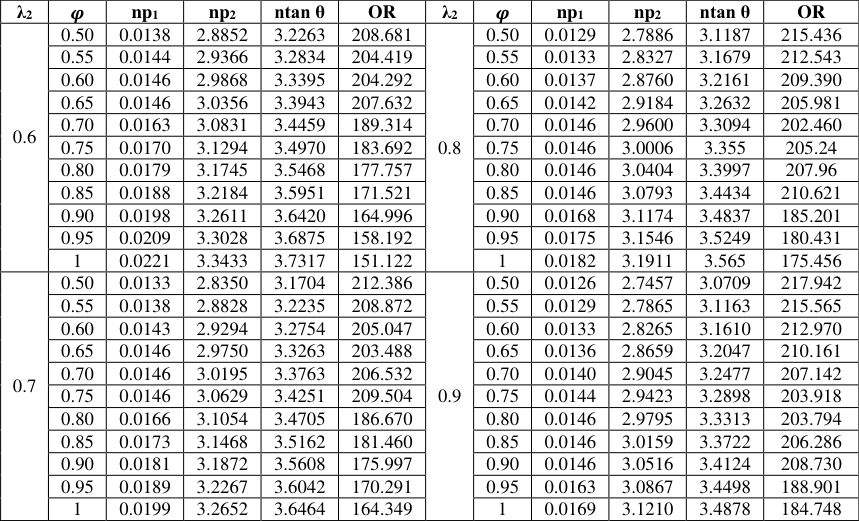 Table 1
Introduction
In the present age of increasing globalization, it is a great challenge for industrialists to fulfill the requirements of consumers on customer related products, reliable lead time and finally customer satisfaction. Today, quality control is a statistical programme to prevent free from defects during and after productions with a complete guarantee for the quality product. Sampling inspection in product control is a statistical methodology which generally works with a basic assumption that the production process from which lots are formed is stable and the lot quality defined in terms of fraction non-conforming is a fixed constant. Generally, Poisson distribution is widely applied in acceptance sampling plans since it has the property that its mean and variance are equal, which is called equidispersion. However, in most of the real life situations, the production processes are not always stable and the lots coming from such processes will have quality variations which may occur due to random fluctuations. The most appropriate probability distribution to handle this kind of situation is the Generalized Poisson Distribution (GPD) developed by Consul and Jain (1973) [1] . This is a strong requirement in real life practice that, when the product quality exhibits a dispersed behaviour, there is a need for a distribution that can handle both over dispersed and under dispersed conditions, such as the aforementioned GPD. It can fulfill the property: the variance is greater than the mean (over-dispersion) or the variance is less than the mean (under-dispersion). The density function of GPD is given as follows:
Where, λ 1 is the scale parameter and λ 2 is the shape parameter which determines the shape of the performance measures. Here we consider, the case λ 2 > 0, for establishing the tables. It ensures the protection for producer and consumer especially, the STDS plan is applicable in the area of safety related testing like medicine, army weapons, chemicals, etc. The single sampling plan under the conditions of GPD developed by Kaviyarasu and Devika (2018) [4] exaggerate the need and importance of GPD based sampling plan in the area of Product control. According to Govindaraju (1984, 1991) [2,3] , the Operating Characteristic (OC) curves of single sampling plan with smaller acceptance numbers results in conflicting interest between the producer and consumer. While single sampling plan with acceptance number Ac=0, which pays more attention towards the consumer but on the other hand acceptance number Ac=1 may favor to producer. This limitation could be overcome to a greater extent when a Special Type Double Sampling (STDS) plan is applied for sentencing the individual lots. For any sampling plan is considered, the OC curve will determine the discriminating power existing between the producer risk and consumer risk. Here, the risk minimization could be achieved through the minimum angle method, making an OC curve approaching to the ideal form. An idealized OC curve has a greater slope; the greater is the discriminating power. Thus it emphasizes the quality manager to take decision making regarding the lot disposition and also make an alarm sense about risk minimization. Both these conditions can be achieved through the minimum angle method. Here an attempt is made to study the GPD through its twin properties of a distribution which strike out the conditions of GPD in acceptance sampling plan since it possesses the characteristics to deal with over-dispersion as well as under-dispersion of data according to λ 2 > 0 or λ 2 < 0 respectively. In this context, this paper is developed to find out its optimum parameters for the sampling plan for various producer's and consumer's quality levels through minimum angle method.
Conditions for Application
1. The production process is reasonably steady, so that results on current and preceding lots are broadly indicative of a continuing process. 2. Samples are taken from lot substantially in the order of production so that observed variations in quality of product reflect process performance. 3. The product comes from a source in which consumer has confidence. 4. Inspection is by attributes, with quality measured in terms of fraction defective p.
Operating Procedure
According to Schilling and Neubauer (2009) [8] , a SSP with zero acceptance number are very useful in the area of compliance and safety related testing. To overcome the pitfalls in SSP with smaller acceptance number, a lot by lot STDS plan is used as an alternative. In the first phase of the sampling inspection the acceptance number are considered as Ac = 0 and in second phase the acceptance number is relaxed for the large sample size which may have Ac = 1. The operating procedure of STDS plan under GPD is very simple as given below:
1. A random sample of size n 1 units are taken from a lot and observe the number of defectives d 1 . If 𝑑 1 ≥ 1, reject the entire lot. 2. If 𝑑 1 = 0, select a second random sample of size n 2 and observe the number of defectives d 2 . If 𝑑 2 ≤ 1, accept the lot. Otherwise reject the lot.
The OC function for the GPD based STDS plan is designed and expressed as follows;
𝑃 𝑎 (𝑝) = 𝑃(𝑑 1 = 0/𝑛 1 ; 𝑝) * 𝑃(𝑑 2 = 1/𝑛 2 ; 𝑝)
Where d 1 is the number of defectives found in the first random sample of size n 1 and d 2 is the number of defectives found in the second random sample of size n 2 for the lot quality p.
Here, 𝑥 = 𝑛𝑝, 𝜑 = 𝑛 2 𝑛 1 + ⁄ 𝑛 2 and λ 2 is the dispersion parameter In the literature, this paper provides a new procedure for designing GPD based STDS plan through Minimum Angle Method. Soundararajan and Christina (1997) [9] developed the single sampling plans by variables based on the minimum angle method. Suresh and Jayalakshmi (2006) [10] deliberate the tightened normal tightened scheme under minimum angle method. Suresh and Sangeetha (2010) [11] have studied one plan suspension system through the minimum angle method. Kaviyarasu and Manikandan (2016) [5] have studied the quick switching multiple deferred sampling systems through minimum angle method.
Selection Procedure Selection procedure for Special Type Double Sampling plan using Minimum Angle method under the condition of Generalized Poisson Distribution
Norman Bush et al. (1953) [6] used different techniques to describe the direction of the operating characteristic (OC) curve through Minimum Angle Method. When producer and consumer are negotiating for designing sampling plans, it is important especially to minimize the consumer risk. Further they have considered two points on the OC curve as (AQL, 1 -α) and (IQL, 0.50) for minimizing the consumer risk. Peach and Littauer (1946) have taken two points on the OC curve as (AQL, 1 -α) and (LQL, β) for making the ideal condition. Hence the optimization approach for ideal condition to minimize the consumers risks is carried through minimizing the angle θ between the lines joining the points [(AQL, 1 -α), (AQL, β)] and [(AQL, 1 -α), (LQL, β)] as given in Figure 1. The formula for tan θ is,
Fig 1: Tangent Angle Minimization
Hence, for two given points on the OC curve, the minimum values of angle, θ can be calculated and tabulated as in Table 1 for the proposed plan using θ = tan -1 {(ntanθ/n)}.
| λ2 | 𝝋 | np1 | np2 | ntan θ | OR | λ2 | 𝝋 | np1 | np2 | ntan θ | OR |
|---|---|---|---|---|---|---|---|---|---|---|---|
| 0.6 | 0.50 | 0.0138 | 2.8852 | 3.2263 | 208.681 | 0.8 | 0.50 | 0.0129 | 2.7886 | 3.1187 | 215.436 |
| 0.55 | 0.0144 | 2.9366 | 3.2834 | 204.419 | 0.55 | 0.0133 | 2.8327 | 3.1679 | 212.543 | ||
| 0.60 | 0.0146 | 2.9868 | 3.3395 | 204.292 | 0.60 | 0.0137 | 2.8760 | 3.2161 | 209.390 | ||
| 0.65 | 0.0146 | 3.0356 | 3.3943 | 207.632 | 0.65 | 0.0142 | 2.9184 | 3.2632 | 205.981 | ||
| 0.70 | 0.0163 | 3.0831 | 3.4459 | 189.314 | 0.70 | 0.0146 | 2.9600 | 3.3094 | 202.460 | ||
| 0.75 | 0.0170 | 3.1294 | 3.4970 | 183.692 | 0.75 | 0.0146 | 3.0006 | 3.355 | 205.24 | ||
| 0.80 | 0.0179 | 3.1745 | 3.5468 | 177.757 | 0.80 | 0.0146 | 3.0404 | 3.3997 | 207.96 | ||
| 0.85 | 0.0188 | 3.2184 | 3.5951 | 171.521 | 0.85 | 0.0146 | 3.0793 | 3.4434 | 210.621 | ||
| 0.90 | 0.0198 | 3.2611 | 3.6420 | 164.996 | 0.90 | 0.0168 | 3.1174 | 3.4837 | 185.201 | ||
| 0.95 | 0.0209 | 3.3028 | 3.6875 | 158.192 | 0.95 | 0.0175 | 3.1546 | 3.5249 | 180.431 | ||
| 1 | 0.0221 | 3.3433 | 3.7317 | 151.122 | 1 | 0.0182 | 3.1911 | 3.565 | 175.456 | ||
| 0.7 | 0.50 | 0.0133 | 2.8350 | 3.1704 | 212.386 | 0.9 | 0.50 | 0.0126 | 2.7457 | 3.0709 | 217.942 |
| 0.55 | 0.0138 | 2.8828 | 3.2235 | 208.872 | 0.55 | 0.0129 | 2.7865 | 3.1163 | 215.565 | ||
| 0.60 | 0.0143 | 2.9294 | 3.2754 | 205.047 | 0.60 | 0.0133 | 2.8265 | 3.1610 | 212.970 | ||
| 0.65 | 0.0146 | 2.9750 | 3.3263 | 203.488 | 0.65 | 0.0136 | 2.8659 | 3.2047 | 210.161 | ||
| 0.70 | 0.0146 | 3.0195 | 3.3763 | 206.532 | 0.70 | 0.0140 | 2.9045 | 3.2477 | 207.142 | ||
| 0.75 | 0.0146 | 3.0629 | 3.4251 | 209.504 | 0.75 | 0.0144 | 2.9423 | 3.2898 | 203.918 | ||
| 0.80 | 0.0166 | 3.1054 | 3.4705 | 186.670 | 0.80 | 0.0146 | 2.9795 | 3.3313 | 203.794 | ||
| 0.85 | 0.0173 | 3.1468 | 3.5162 | 181.460 | 0.85 | 0.0146 | 3.0159 | 3.3722 | 206.286 | ||
| 0.90 | 0.0181 | 3.1872 | 3.5608 | 175.997 | 0.90 | 0.0146 | 3.0516 | 3.4124 | 208.730 | ||
| 0.95 | 0.0189 | 3.2267 | 3.6042 | 170.291 | 0.95 | 0.0163 | 3.0867 | 3.4498 | 188.901 | ||
| 1 | 0.0199 | 3.2652 | 3.6464 | 164.349 | 1 | 0.0169 | 3.1210 | 3.4878 | 184.748 |
Table text extracted from the original PDF; superscript letters are shown inline. The original table image is below.
View original table image
Example
Given p 1 =0.0001 and p2=0.021 Then OR=210
The associated sets of values corresponding to the computed OR form Table 1are: λ 2 = 0.7; φ = 0.75; np 1 = 0.01462; ntanθ = 3.42509 λ 2 = 0.8; φ = 0.85; np 1 = 0.01462; ntanθ = 3.44344 λ 2 = 0.9; φ = 0.65; np 1 = 0.01364; ntanθ = 3.20474.
which implies that, 1. n = np 1 /p 1 = 0.01462/0.0001 = 146 θ = tan -1 {(n tan θ)/n} = tan -1 (0.02343) = 1.342. 2. n = np 1 /p 1 = 0.01462/0.0001 = 146 θ = tan -1 {(n tan θ)/n} = tan -1 (0.02355) = 1.349. 3. n = np 1 /p 1 = 0.01364/0.0001 = 136 θ = tan -1 {(n tan θ)/n} = tan -1 (0.0235) = 1.346.
From the above three choices, the minimum angle is θ = 1.342. Hence the optimum plan parameters for the proposed sampling plan is c = 0,1 with n = 146, p 1 = 0.0001, p 2 = 0.021, α = 0.01, β= 0.10, n 1 =37, n 2 =110 and λ 2 = 0.7 with minimum angle θ = 1.342.
Construction of tables
For STDS plan, the probability of acceptance, p P a for a given lot proportion defective, p, is given by,
Where, 𝑥 = 𝑛𝑝, 𝜑 = 𝑛 2 𝑛 1 + ⁄ 𝑛 2 and λ 2 is the dispersion parameter.
The minimum angle criteria for the proposed plan can be obtained as
Based on the operating ratio value, the optimized plan parameters are obtained through the angle calculated as θ = tan -1 {(ntanθ/n)}. The Goal seek search procedure has been used to obtain the optimum value of the tangent angle for specific values of np 1 and np 2 by keeping the producer's risk below 1% and consumer's risk below 10%.
Conclusion
This paper presents an optimization approach to support the design of Generalized Poisson Distribution (GPD) based Special Type Double Sampling (STDS) plan through Minimum Angle Method. In practice, it is desirable to design a sampling plan with the associated quality levels concerning producer and consumer. This method is useful in the area of testing related to safety and destructive cases. The general framework are studied which makes the OC curve approaching to the ideal form by minimizing the tangent angle joining the points [(AQL, 1 -α), (AQL, β)] and [(AQL, 1 -α), (LQL, β)]. Thus it provides an alarm sense for quality controller towards the lot sentencing and the risks exists under this plan. The work presented in this paper is mainly related to obtain optimum plan parameters for manufacturing industrialists for inspection procedure. Tables are provided to safeguard both producer and consumer simultaneously for obtaining good quality products in inspection. The proposed sampling plan through its economic aspects may be the future research work.
Acknowledgement
AcknowledgementThe authors are happy to acknowledge the unknown referees and parent University for providing necessary facilities in the Department through DST-FIST and UGC-SAP Programmes. We further acknowledge the DST-PURSE (II) for providing funding for the research work.
References
11 in the original paper- Consul PC, Jain GC. A Generalization of the Poisson Distribution, Technometrics. 1973; 15(4):791-799.
- Govindaraju K. Contributions to the Study of Certain Special Purpose Plans, Ph D., Thesis, 1984; Dept. of Statistics, Bharathiar University, Coimbatore.
- Govindaraju K. Fractional acceptance number single sampling plan, Communications in Statistics Simulation and Computation. 1991; 20:173-190.
- Kaviyarasu V, Devika V. Designing Single Sampling Plan using Generalized Poisson Distribution, International Journal of Scientific Research in Mathematical and Statistical Sciences. 2018; 5(4):246252.
- Kaviyarasu V, Manikandan A. Designing of Quick Switching Multiple Deferred Sampling System-3 through Minimum Angle method and Minimum sum of risk, International Journal of Science and Research. 2016; 5(2):2031-2036.
- Norman Bush Evelyne J. Leonard and Marvin Marchant Q.M. A Method of Discrimination for Single and Double OC curves utilizing the tangent of the Point of Inflection, ENSAR Report No. PR-7, 1953; Engineering Agency.
- Peach P, Littauer SB. A Note on Sampling Inspection, Annals of Mathematical Sciences. 1946; 17:81-85.
- Schilling EG, Neubauer DV. Acceptance Sampling in Quality Control, Boca Raton, CRC Press, 2009.
- Soundararajan V, Christina AL. Selection of single sampling variables plans based on the minimum angle, Journal of Applied Statistics. 1997; 24(2):207-218.
- Suresh KK, Jayalakshmi S. Designing of Tightened Normal-Tightened Scheme under Minimum Angle Method, Acta Ciencia Indica. 2006; 33(3):1073.
- Suresh KK, Sangeetha V. Selection of One Plan Suspension System through Minimum Angle Method, Global Journal of Mathematical Sciences: Theory and Practical. 2010; 3:121-128.
Cited by 1
From OpenAlex, OpenCitations and reference lists read by Scinovex
- Optimization of Bayesian Single Sampling Plan for the Zero Inflated Poisson distribution Involving Risk Minimization Using Tangent Angle Method ↗
V. Kaviyarasu, Palanisamy Sivakumar · International Journal of Scientific Research in Mathematical and Statistical Sciences · 2021
The International Scientific Research Organization for Science, Engineering and Technology (ISROSET) is a Non-Profit Organization; The ISROSET is dedicated to improvement in academic sectors of Science (Chemistry, Bio-chemistry, Zoology, Botany, Biotechnology, Pharmaceutical Science, Bioscience, Bioinformatics, Biometrics, Biostatistics, Microbiology, Environmental Management, Medical Science, Forensic Science, Home Science, Library Science, Material Science Military Science, Physical Science, Physical Education Science, Educational Science, Fisheries,…
❝ 1PDF