
Research article · 2018 · Full text
International Journal of Statistics and Applied MathematicsStudy on some determinants of infant mortality in Uttar Pradesh, India
Volume 3(4) · Pages 155–165
Research areasGlobal Health and EpidemiologyChild Nutrition and Water AccessCOVID-19 epidemiological studies
Abstract
Author-writtenInfant mortality is an important aspect of population, to study the infant mortality it is important to know it’s determinants. This paper is an attempt to study about some socio-demographic variables which might affect the infant mortality. For the study we use the Uttar Pradesh state of India, which is highly considered state for any demographic phenomenon. National Family Health Survey-IV (2015-16) data is being considered for study on determinants of infant mortality.
Summary
Source-checkedPlain-language reading of the full paper, prepared with AI and checked against the text. Each point links to the authors' own words.
Why it matters
- Infant and child mortality are critical population features in India, where approximately 10% of the total population is under five years old. View evidence ↗
- Uttar Pradesh is a key region for studying infant mortality because it is India's most populous state and experiences high rates of infant death. View evidence ↗
- Socio-economic factors and the status of the mother are hypothesized to influence child mortality rates. View evidence ↗
The question
- The study aims to identify which socio-demographic variables affect infant mortality in Uttar Pradesh, India. View evidence ↗
What they did
- The study employed the Cox Proportional Hazard model, a semi-parametric method, to analyze the survival of infants. View evidence ↗
- The analysis used simple models to identify significant individual variables and multiple models to determine the adjusted effects of those variables. View evidence ↗
What they found
- Breastfeeding was strongly associated with survival, with infants who were breastfed having a 93% lower risk of death compared to those who were not. View evidence ↗
- Infants in rural areas faced a significantly higher risk of death (1.34 times) compared to those in urban areas in the simple model. View evidence ↗
- Wealth was a significant factor, with the richest class showing a 41% lower risk of infant mortality compared to the poorest class. View evidence ↗
- Birth weight significantly impacted survival; overweight infants had a 2.714 times higher risk of death than those with normal weight. View evidence ↗
- Comparing two multiple models using -2 log likelihood (19935.496 for Model 1 vs 21392.019 for Model 2) indicated that including breastfeeding provided a better interpretation of infant survival. View evidence ↗
What it means
- The authors conclude that the most critical determinants of infant mortality are birth order, child sex, maternal education, breastfeeding, birth weight, and wealth index. View evidence ↗
Visual summary
2 visualsIllustrations explain the paper; charts are replotted from the paper's own table values.
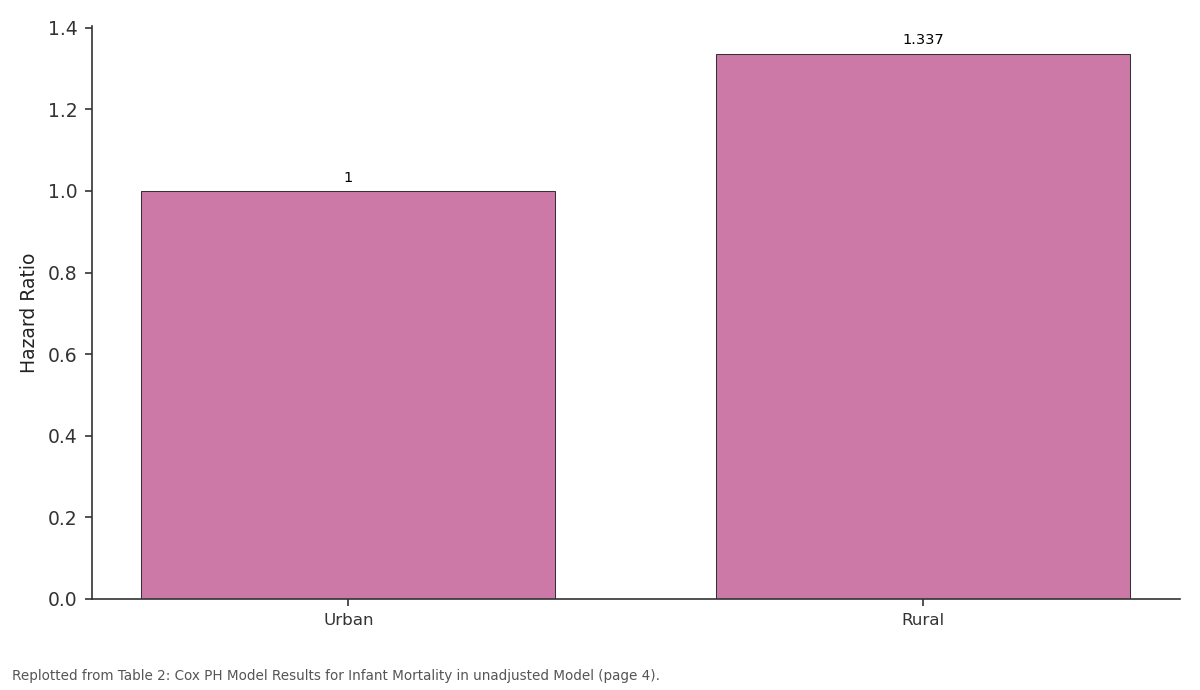
Hazard Ratio: Urban vs Rural
Replotted from Table 2 (page 4) of the original paper. Every bar is the paper's own table value.
View source evidence ↗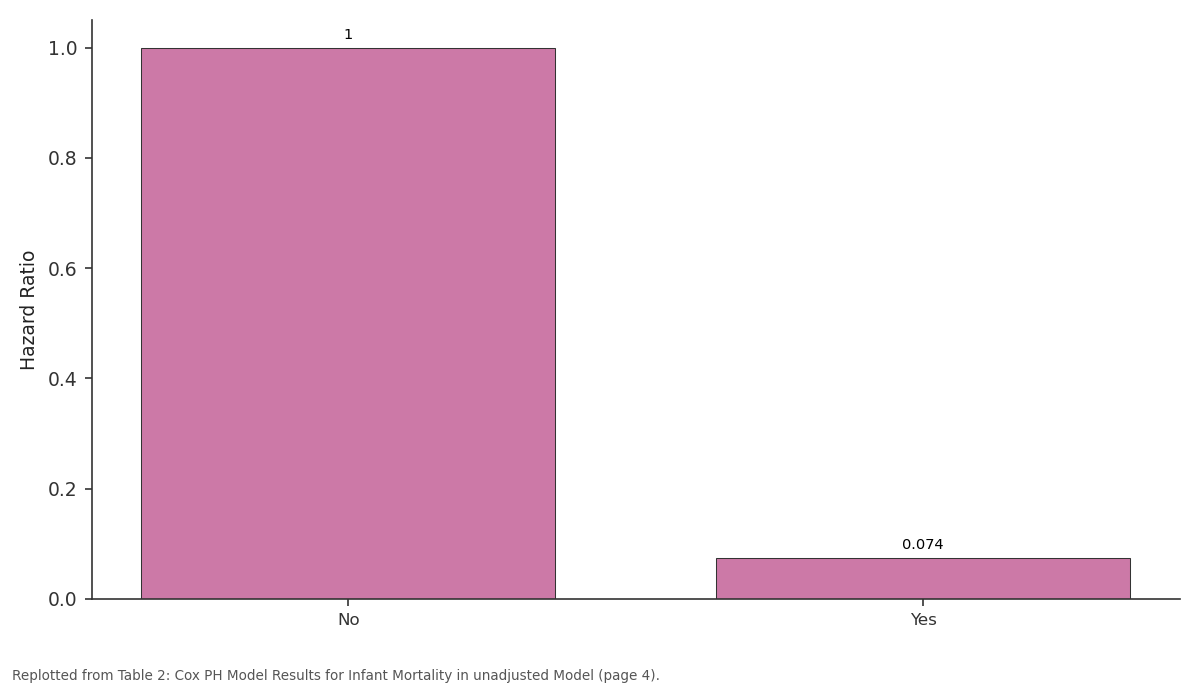
Hazard Ratio: No vs Yes
Replotted from Table 2 (page 4) of the original paper. Every bar is the paper's own table value.
View source evidence ↗Figures & tables
From the original paper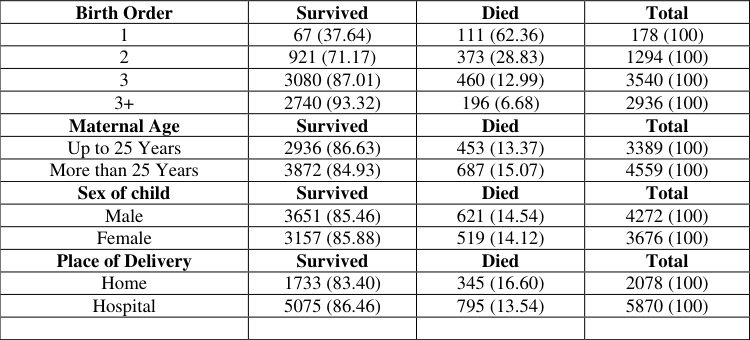 Table 1
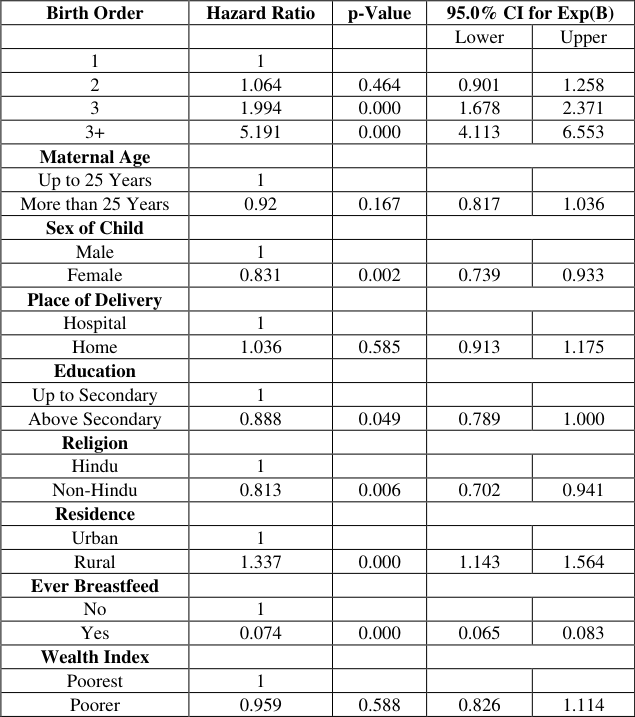 Table 2
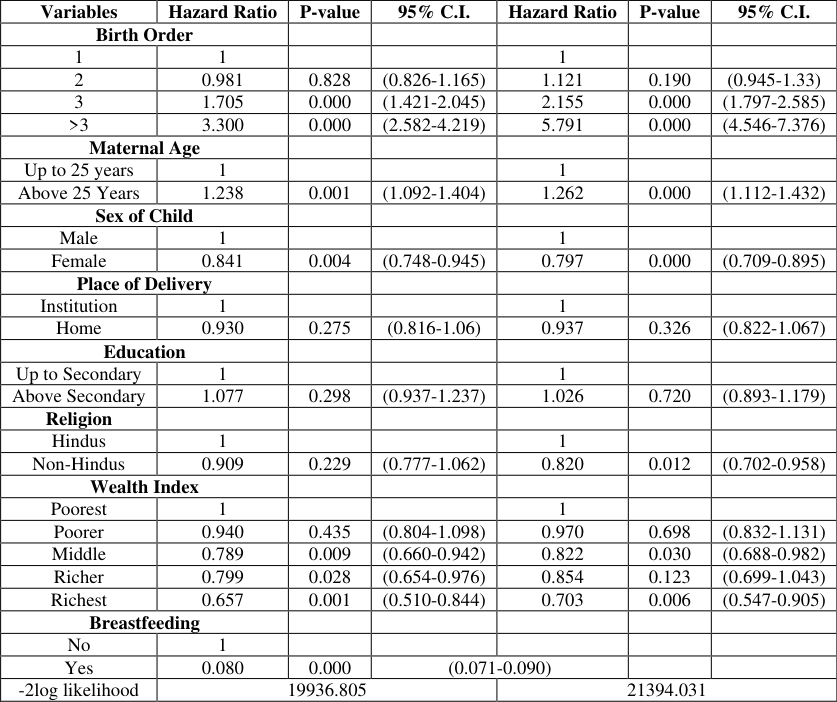 Table 3
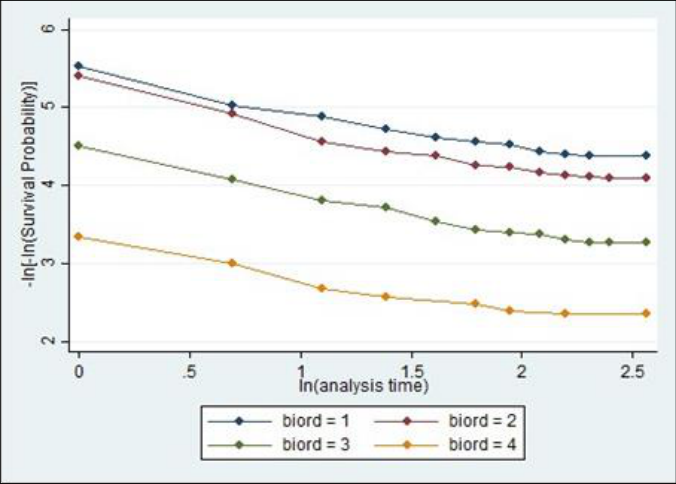 Figure 1
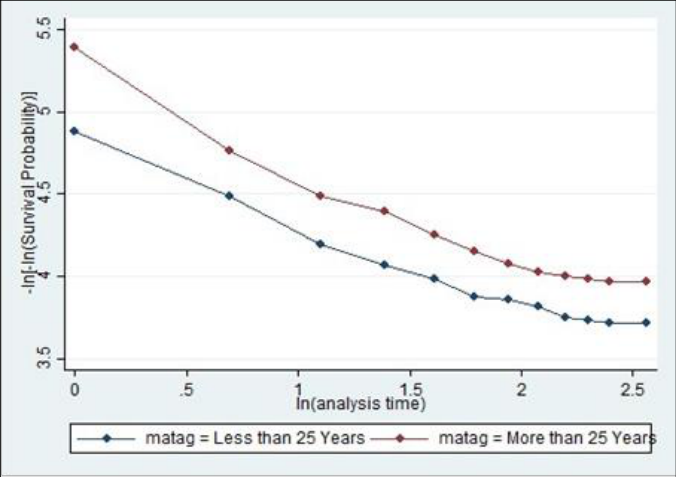 Figure 2
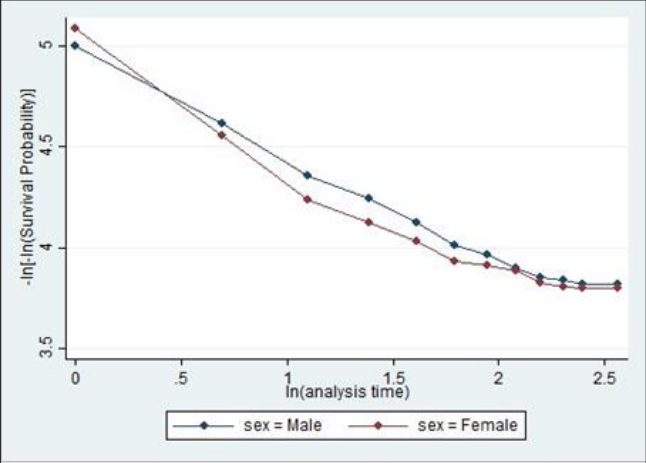 Figure 3
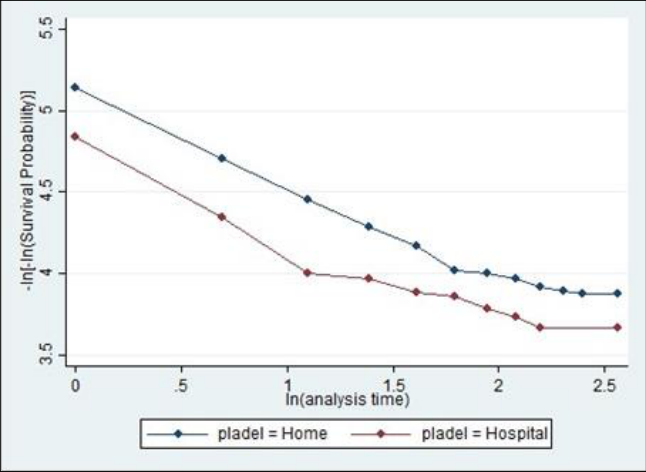 Figure 4
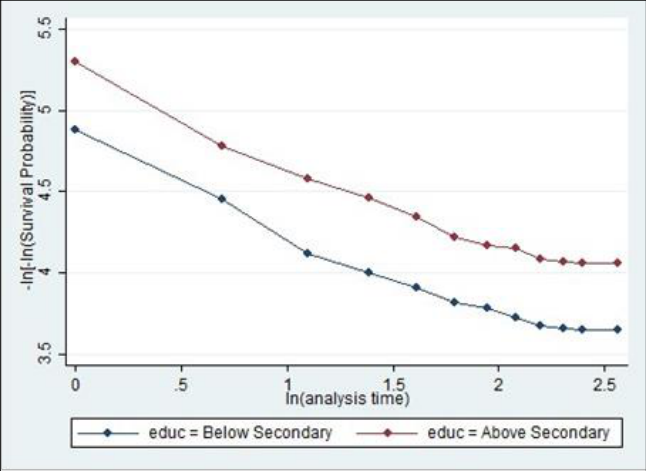 Figure 5
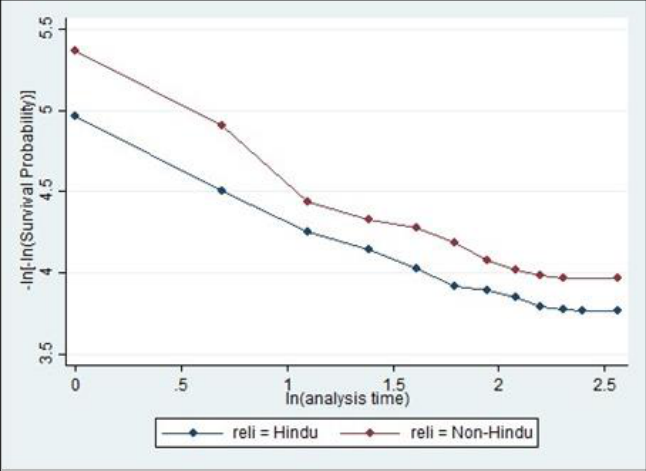 Figure 6
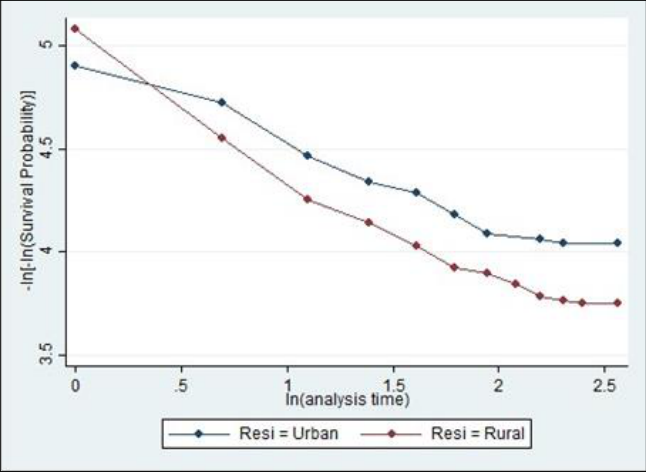 Figure 7
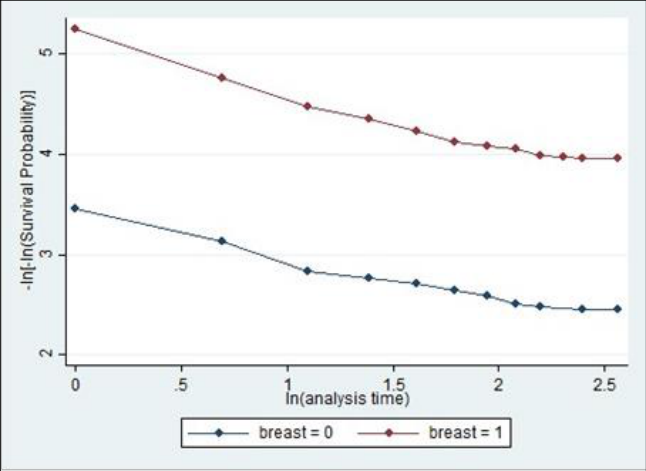 Figure 8
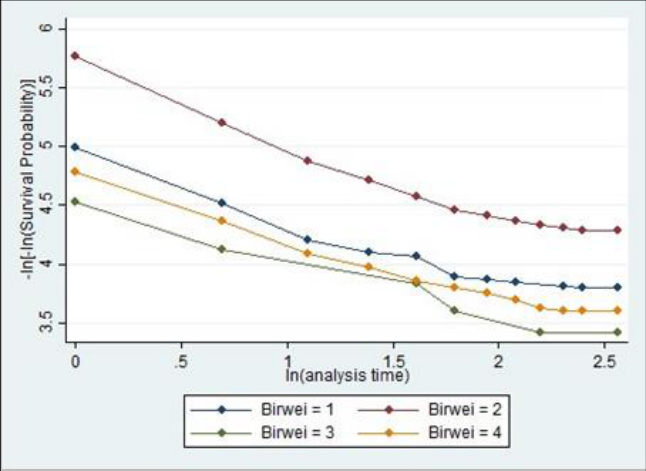 Figure 9
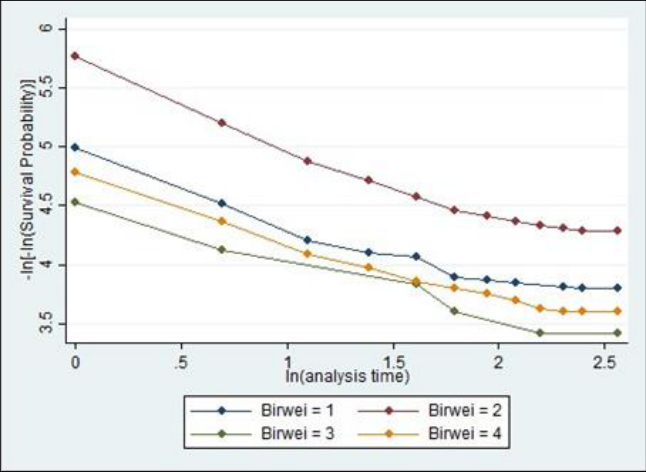 Figure 9
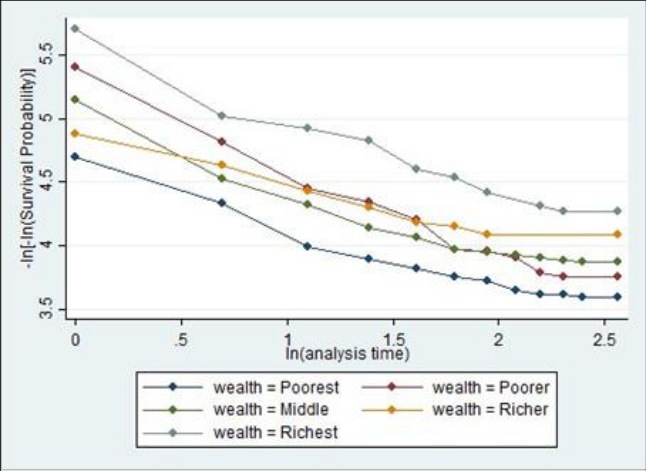 Figure 10
Introduction
India is a country in which about its 50% population lies under 25 year age and 10% of total are under 5 year age group. That scenario makes infant and child mortality an important feature of population. Maternal status and Socio-economic factors might affect child mortality. In this study we consider simple and multiple hazard model for analysis and justification of effect of Maternal and Socio-economic status on infant mortality. The data which will consider for that study is taken from National Family Health Survey-IV collected during 2015-16, which use 7948 units for study. The study of Hob croft, McDonald and Rutstain (1984) [8] based on multivariate analysis data from 16 countries described the relationship between maternal socio-economic status and under 5 year age mortality cannot be demonstrated by only basic reproductive concerns such as maternal age, ranking of births and spacing between births. By implying Cox regression analysis Zerai (1996) [24] implemented a multilevel frame for study influence on infant survival in Zimbabwe based on socio-economic and demographic variables obtained from 1992 Zimbabwe Demo-graphic Health Survey (ZDHS) data, in which one of the most important finding was infant survival in a community is greatly influenced by mother's average educational level. Which seems very much supportable for ascertain that mass education give strong impact on child survival given by Cleland and Ginneken (1988) [6] . In Indian scenario there must arise many social variables who affect the under 5 year age mortality. This paper is about the study of impact of variables related to maternal status on child mortality in Indian context. There are several studies done on child mortality in perspective of many countries for relevance between child mortality and social status, Manda (1999) [11] used DHS data for relation between maternal status and infant and child mortality in case of with or without any explanatory variable. And impact of child mortality by direct and indirect effect of breastfeeding with the help of birth intervals. In Haiti, determining of childhood mortality and estimating it trends Bicego (1990) [4] used proportional hazard regression in three steps mortality, Morbidity and services utilization survey in which shows that age and education of mother have remarkable impact on neonate survival and decrease and health services also having great importance during childhood. Kempo and Ginniken (2009) [10] given study on child mortality and maternal status in terms of maternal, socio-economic and sanitation variables with the help of non-parametric survival procedures for study by using Cox Proportional hazard model, in 3 classes of socio-economic status of models using 1992 DHS data for Zimbabwe one of the main finding was the child mortality highly related to maternal social status as well as water and sanitation facility available in Zimbabwe. Studied the effect of maternal and child health care services on infant mortality using National Family Health Suvey-I (1992-93) data. Studied the infant mortality using hazard models in with some explanatory variables such as 4 states, maternal age, education, outcome of previous birth, sex of child, residence, standard of living index and caste. In her thesis N. Singh (2009) [21] used Poisson regression model for infant mortality by explanatory variables such as maternal age, education, and female autonomy, domestic violence. India is the vast country having so many social and cultural diversities and society divided in many dimensions. This study is concerns about the condition of influence of social, maternal and child perspective in under five year age mortality. Uttar Pradesh, most populous and highly resourceful state of India (Census-2011), are consists with higher rate of infant mortality. Due to its resourcefulness it makes Uttar Pradesh highly concerned region for making these kind of studies. Due to that importance, Uttar Pradesh is being considered to study in this chapter. In non-parametric condition Cox-proportional hazard model is an acceptable method for the study in extensive manner because being a semi parametric model, this go with the flexibility of non-parametric model with pursuing that more powerful and extensive to any non-parametric model. We use this model in study of infant mortality in Indian scenario with the help of NFHS-IV (2015-16) data. We make consideration of several explanatory variables which is supposed to make influence on infant mortality. In which our expectation for understanding the condition of infant mortality and improving them for country like India, And getting condition which might be helpful for keeping hope alive for India, So for extensive study we move on the methodology of study.
Data and Methodology 2.1 Model Specification
Infant mortality can be defined as death between 0-12 months of a child. The risk of occurring death in this age interval for age in year from birth given in calendar year. Independent variables which are used in that study based on child mortality and morbidity framework given by Mosely and Chen (1984) [14] . We consider these variables in this chapter to fit Coxproportional hazard model for variables defined as:
Response variable
Infant mortality taken as Response variable. Our outcome variable consists with 2 different types of models for Infant mortality. First is simple model for variables which are used in study one by one to obtain that which variable effect the infant mortality significantly. Then a Multiple model is being used to find out adjusted effect of significant variables on infant mortality extracted from simple models.
Explanatory variables
Birth Order For child health and survival how much birth had been given by mother is very important, as the frequent births may cause the immature births or anemic condition to women, which may affect the child survival in negative sense. For this study we considered birth order with 4 factors as (1.) Birth order-1, (2). Birth Order-2, (3.) Birth Order-3, (4.) Birth Order as 4+. The data of birth order will move with as per births occur in last one year. Maternal Age Child bearing capacity of a women is also related with her age, as we consider the early age we get that she is not properly fit to giving birth to a child and in later ages the risk of child death may go higher as she comes near of her age of menopause. So considering it may have a significant on infant death, here we consider 2 groups of ages as (1.) up to 25 years, (2.) More than 25 years. Sex of child In Indian scenario Sex of child is an important aspect because India have lot preference to the birth of son and have more possession to health of son, so, we consider sex of child as Male and female for our study to the scenario of infant deaths. Place of Delivery In a birth, place of delivery plays an important role, it leads to hygiene, vaccination, postnatal cares etc. These things become highly prone when delivery occurs in an Institution or by a professionally trained person. That might effect the child survival. Here considered factors of place of delivery are (1.) Institution (2.) Home. Maternal Education As there is common assumption that educated society moves to a healthy life and it extend the life expectancy of child, so we consider that factor for our study to much important. We divide this scale in 3 categories (1.) Illiterate, (2.) Up to secondary (3.) Above secondary. Religious Status In our Indian Society discrimination between different religions is assumed to be a proper cause of child death. So considering it may give a proper relation to child deaths here we had taken religion in 2 stages (1) Hindu (2) Non-Hindus. Since Hindus share largest part of the Population in India so we considered them as main religions and Non-Hindus are Muslims, Sikhs, Buddhist, Christians etc. Which share very less contribution in Indian scenario. Residential Status In Indian context Availability of health facility of such as PHC, CHC etc. is dependent on residential status for example in Uttar Pradesh there are lots of Villages which do not have proper health facility so considering residential status may show big effect on infant mortality. Here Taken Residential status are (1) Urban and (2) Rural for the study. Breastfeeding Breast milk is considered as the best food for infant and also think as the carrier of several nutritional elements. Government often makes plans to make women aware for breastfeeding. So it might me considered as important factor to effect infant mortality. For this we considered ever breastfed to infant. They are (1.) No (2.) Yes. Birth Weight Birth weight is an important aspect to study about the phenomenon of child mortality as weight of babies are commonly related to the child immunity and child health in common assumption so we might consider its effect on infant mortality. Birth weight had taken in 3 forms (1) less than 2.5 kg or underweight (2) Normal weight or 2.5 kg-4 kg (3) overweight or more than 4 kg. And for those infants Birth weight Information is not available they are not considered in the models. Wealth Index this is one of the important factors to consider in our society related to health. As the common assumption about wealth status is that if you have as more money than you have better accessibility to health services. In that scenario considering wealth status becomes more prominent figure to consider for the phenomenon of infant mortality. Here we consider the 5 status of society as (1) Poorest ( 2) Poorer (3) Middle class (4) Richer (5) Richest in this context. Caldwell (1989) [5] shows education of mother is highly influencing factor of child health because an educated mother is able to adjust in any traditional and social custom and she have higher ability to make extensive use of health care resources which may increase the autonomy for her child in and outside of house. In similar manner wealth status play an i=1 important role in infant mortality it shows the availability of nutritional resources specially when a child needs to have special care. Indian scenario is very different from the world because it contains lot of differences in social status such as region, religion, caste, creed etc. Each and every factor gives greater influence on infant mortality, occupation of females also play a crucial role in infant mortality. In some cases there have been observed that mortality of infant whose delivery occurred in modern facilities is higher than other deliveries, because that facilities are used under the condition of pregnancy complication become high. Household status taken as other important influencing factors of infant mortality. Largest no. of people lives in rural areas where most of the people doesn't have a proper house to live, and they live in kachha houses and they do not have proper water and sanitation facilities. These are conditions of having the high incidence rate of infant mortality Household structure is also a case that affects the child mortality as it has been seen that if there is a joint family than care and control of a child is high so it shows the risk of under 5 year age mortality lower than nuclear family. In this paper we study the impact on infant mortality on the basis of variables selected as maternal, socio-economic, household scenario discussed for Uttar Pradesh context and that variables were being tested on the relevance of hazard regarding consideration in 2015-16 NFHS data.
Source of Data
In this study we use the National Family Health Survey-IV (NFHS-2015-16) kids file which is highly reliable in Indian context the data is based on 7948 observation recorded for last years with 1104 deaths of infant for women aged in between 15-49 years which was collected with the collaboration of International Institute of Population Studies (IIPS) and Demographic Health Survey (DHS), Which are the rich source of women and child status data that gives the sufficient number of information in that category to ensure the reliability of data.
Methods
Kids data file is being used constructed from women respondents in 2015-16 national family health survey. Cox Model is used in survival analysis with proportional hazard models. Significance level is being performed over p<0.05 for the hazard models. Since in consideration the measures of survival Cases Cox is considered as the better measure in respect to other methods such as life table in which we can find the survival scenario in case of equally divided constant age intervals, which is being improvised in Kaplan-Meier estimate with varying age interval or variable failure timings. Their are better estimates but there have some problems with that estimators such as they only can evaluate survival chances with respect to only one respective independent variable. And also they all are non-parametric models which are considered week models with respect to any parametric models. Cox Proportional hazard model is preferred over that such as it is a semi parametric model which is more powerful than any nonparametric model in any case. And more it consists the liberty to any non-parametric model to number of variables. Cox proportional model is defined as-: Let Xi = Xi1, • • • Xin be the realized values of the covariates for subject i. The hazard function for Cox proportional Hazard model is defined as:
where h 0 (t) is base line hazard which can be approximated through by any distribution such as exponential or Wei bull distribution but they will provide the similar results for the same data due to that property cox regression is considered as semi parametric model. For the value if relative we did not have to defined the baseline hazard distribution certainly we can go for the results by using the exp (βixi) for given time t to occurring the event.
Proportionality assumption of hazard models are given as. There should be non-informative censoring.
Independent variables must have hazard functions that are proportional over time.
In study we will go for simple models as well as multiple models, where in multiple models we use two models one with considering each variables and one with not considering breastfeeding in the study to know the effectiveness of breastfeeding on duration of death of infants. Both the models will be compared using-2 log likelihood. Keeping that in mind now we approach to Results section.
Results
Considering the independent variable for the model to get the information regarding infant mortality in last years we have Descriptive statistics of variables in study in table 1 and Figures shows the proportionality check for each variables one by one which shows each variable fulfill the proportionality assumption of Cox Proportional Hazard Models.
| Birth Order | Survived | Died | Total |
|---|---|---|---|
| 1 | 67 (37.64) | 111 (62.36) | 178 (100) |
| 2 | 921 (71.17) | 373 (28.83) | 1294 (100) |
| 3 | 3080 (87.01) | 460 (12.99) | 3540 (100) |
| 3+ | 2740 (93.32) | 196 (6.68) | 2936 (100) |
| Maternal Age | Survived | Died | Total |
| Up to 25 Years | 2936 (86.63) | 453 (13.37) | 3389 (100) |
| More than 25 Years | 3872 (84.93) | 687 (15.07) | 4559 (100) |
| Sex of child | Survived | Died | Total |
| Male | 3651 (85.46) | 621 (14.54) | 4272 (100) |
| Female | 3157 (85.88) | 519 (14.12) | 3676 (100) |
| Place of Delivery | Survived | Died | Total |
| Home | 1733 (83.40) | 345 (16.60) | 2078 (100) |
| Hospital | 5075 (86.46) | 795 (13.54) | 5870 (100) |
Table text extracted from the original PDF; superscript letters are shown inline. The original table image is below.
View original table image
Cox Proportional Hazard Model results in case of Simple Models
Cox proportional hazard model is a properly used model for the survival study with consideration of time, here we move with the phenomenon of infant deaths with that explanatory variables which are not changed due to time, after fitting infant deaths for the independent variable of birth order we get from table 2 in simple model with respect to birth order 1 the risk of infant death is 6% higher but on insignificant state with 95% confidence interval from 0.901 to 1.258 for birth order 2. For birth order 3 we get with respect to reference level risk is 1.994 times higher than reference level on significant status with 95% confidence interval from 1.678 to 2.371. For birth order more than 3 with respect to reference level of birth order 1 we get the risk of infant death is 5.19 times higher on significant state with 95% confidence interval from 4.113 to 6.553. It can be seen that birth order has significantly increasing effect on infant mortality. Table shows that for maternal age more than 25 years risk of infant mortality is insignificantly 8% low with respect to reference level of women age up to 25 years with 95% confidence interval from 0.817 to 1.036. For sex of child risk of infant death is with respect to reference level of male children is 17% lower for females with 95% confidence interval from 0.739 to 0.933 at significant state in. Table also shows that for home as place of delivery shows approximately 4% higher risk than any institutional delivery with an insignificant relative risk and 95% confidence interval 0.913 to 1.175. Considering the maternal education to knowing about the risk of infant deaths we consider up to secondary education status as reference level, we get for above secondary educated women, infant death is 12% lower to reference level at significant state with 95% confidence interval from 0.789 to 1.000. Taking Religion level from table we considered Hindus as reference level, on that level we can see that hazard ratio of infant death is 19% lower in Non-Hindus with respect to reference level on significance status with 95% confidence interval 0.702-0.941. We get for residential status risk of infant death is 1.34 times higher in rural areas with respect to reference level of urban areas at significant status with 95% confidence interval from 1.143 to 1.564. For breastfeeding status we get risk of infant death is significantly 93% lower for women who ever breastfeed to there infants with respect to women who never breastfed there child with confidence interval 0.065-0.083. For wealth index we consider where reference level is considered as poorest class we get for poorer class risk of infant deaths is 5% lower than reference level with 95% confidence interval from 0.826 to 1.114 on insignificant status. For middle class risk is 17% lower with significant status and 95% confidence interval 0.700-0.984 on behalf of reference level. For richer classes risk of infant death is significantly lower 0.18 times with 95% confidence interval from 0.685 to 0.994 with respect to reference level. Richest class shows 41% lower risk than reference level with significant status and 95% confidence interval 0.470-0.746. We get for birth weight with reference level of normal weight children we get risk of infant death is 1.768 times for infants of underweight category with significant status and 95% confidence interval 1.457-2.145. For overweight children risk of infant death is 2.714 times higher at significant status with 95% confidence interval of 1.771-4.159 with respect to reference level. From studying tables of simple models thoroughly we get that, the variables which have significant effect on infant mortality are found as Birth Order, Sex of Child, Maternal Education, Religion, Residence, Breastfeed, Birth Weight and Wealth index. Maternal age and place of delivery does not have significant effect on infant mortality. These results will be embrace to use to get the adjusted effect of multiple models. In multiple model we use all those variables of simple models which have same frequency everywhere which does not posses by Birth weight, so Birth weight will not be considered in multiple model.
| Birth Order | Hazard Ratio | p-Value | 95.0% CI for Exp(B) | — |
|---|---|---|---|---|
| Lower | Upper | |||
| 1 | 1 | |||
| 2 | 1.064 | 0.464 | 0.901 | 1.258 |
| 3 | 1.994 | 0.000 | 1.678 | 2.371 |
| 3+ | 5.191 | 0.000 | 4.113 | 6.553 |
| Maternal Age | ||||
| Up to 25 Years | 1 | |||
| More than 25 Years | 0.92 | 0.167 | 0.817 | 1.036 |
| Sex of Child | ||||
| Male | 1 | |||
| Female | 0.831 | 0.002 | 0.739 | 0.933 |
| Place of Delivery | ||||
| Hospital | 1 | |||
| Home | 1.036 | 0.585 | 0.913 | 1.175 |
| Education | ||||
| Up to Secondary | 1 | |||
| Above Secondary | 0.888 | 0.049 | 0.789 | 1.000 |
| Religion | ||||
| Hindu | 1 | |||
| Non-Hindu | 0.813 | 0.006 | 0.702 | 0.941 |
| Residence | ||||
| Urban | 1 | |||
| Rural | 1.337 | 0.000 | 1.143 | 1.564 |
| Ever Breastfeed | ||||
| No | 1 | |||
| Yes | 0.074 | 0.000 | 0.065 | 0.083 |
| Wealth Index | ||||
| Poorest | 1 | |||
| Poorer | 0.959 | 0.588 | 0.826 | 1.114 |
Table text extracted from the original PDF; superscript letters are shown inline. The original table image is below.
View original table image
Cox Proportional Hazard model results for Multiple Models 3.2.1 Model-1
After fitting children deaths we get for the independent variable we get results for multiple model from table 3. When birth order is taken into account we get, with respect to birth order 1 the risk of infant death is 2% lower but on insignificant state with 95% confidence interval from 0.826 to 1.165 for birth order 2. For birth order 3 we get with respect to reference level risk is 1.70 times higher than reference level on significant status with 95% confidence interval from 1.421 to 2.045. For birth order more than 3 with respect to reference level of birth order 1 we get the risk of infant death is 3.300 times higher on significant state with 95% confidence interval from 2.582 to 4.219. It can be seen that birth order has significantly increasing effect on infant mortality. Table shows that for maternal age more than 25 years risk of infant mortality is insignificantly 20% low with respect to reference level of women age up to 25 years with 95% confidence interval from 0.713 to 0.918. For sex of child risk of infant death is with respect to reference level of male children is 16% lower for females with 95% confidence interval from 0.748 to 0.945 at significant state. Table also shows that for home as place of delivery shows approximately 38% higher risk than any institutional delivery with an significant relative risk and 95% confidence interval 1.069 to 1.350. Considering the maternal education to knowing about the risk of infant deaths we consider up to secondary education status as reference level, we get for above secondary educated women, infant death is 12% lower to reference level at significant state with 95% confidence interval from 0.767 to 1.014. Taking Religion level from we considered Hindus as reference level, on that level we can see that hazard ratio of infant death is 10% lower in Non-Hindus with respect to reference level on insignificance status with 95% confidence interval 0.777-1.062. We get for residential status risk of infant death is 1.11 times higher in rural areas with respect to reference level of urban areas at insignificant status with 95% confidence interval from 0.928 to 1.323. For breastfeeding status we get risk of infant death is significantly 92% lower for women who ever breastfeed to there infants with respect to women who never breastfed there child with confidence interval 0.071-0.090. For wealth index reference level is considered as poorest class we get for poorer class risk of infant deaths is 6% lower than reference level with 95% confidence interval from 0.804 to 1.098 on insignificant status. For middle class risk is 21% lower with significant status and 95% confidence interval 0.660-0.942 on behalf of reference level. For richer classes risk of infant death is significantly lower 0.20 times with 95% confidence interval from 0.654 to 0.976 with respect to reference level. Richest class shows 34% lower risk than reference level with significant status and 95% confidence interval 0.510-0.844.
| Variables | Hazard Ratio | P-value | 95% C.I. | Hazard Ratio | P-value | 95% C.I. |
|---|---|---|---|---|---|---|
| Birth Order | ||||||
| 1 | 1 | 1 | ||||
| 2 | 0.981 | 0.828 | (0.826-1.165) | 1.121 | 0.190 | (0.945-1.33) |
| 3 | 1.705 | 0.000 | (1.421-2.045) | 2.155 | 0.000 | (1.797-2.585) |
| >3 | 3.300 | 0.000 | (2.582-4.219) | 5.791 | 0.000 | (4.546-7.376) |
| Maternal Age | ||||||
| Up to 25 years | 1 | 1 | ||||
| Above 25 Years | 1.238 | 0.001 | (1.092-1.404) | 1.262 | 0.000 | (1.112-1.432) |
| Sex of Child | ||||||
| Male | 1 | 1 | ||||
| Female | 0.841 | 0.004 | (0.748-0.945) | 0.797 | 0.000 | (0.709-0.895) |
| Place of Delivery | ||||||
| Institution | 1 | 1 | ||||
| Home | 0.930 | 0.275 | (0.816-1.06) | 0.937 | 0.326 | (0.822-1.067) |
| Education | ||||||
| Up to Secondary | 1 | 1 | ||||
| Above Secondary | 1.077 | 0.298 | (0.937-1.237) | 1.026 | 0.720 | (0.893-1.179) |
| Religion | ||||||
| Hindus | 1 | 1 | ||||
| Non-Hindus | 0.909 | 0.229 | (0.777-1.062) | 0.820 | 0.012 | (0.702-0.958) |
| Wealth Index | ||||||
| Poorest | 1 | 1 | ||||
| Poorer | 0.940 | 0.435 | (0.804-1.098) | 0.970 | 0.698 | (0.832-1.131) |
| Middle | 0.789 | 0.009 | (0.660-0.942) | 0.822 | 0.030 | (0.688-0.982) |
| Richer | 0.799 | 0.028 | (0.654-0.976) | 0.854 | 0.123 | (0.699-1.043) |
| Richest | 0.657 | 0.001 | (0.510-0.844) | 0.703 | 0.006 | (0.547-0.905) |
| Breastfeeding | ||||||
| No | 1 | |||||
| Yes | 0.080 | 0.000 | (0.071-0.090) | |||
| -2log likelihood | 19936.805 | 21394.031 |
Table text extracted from the original PDF; superscript letters are shown inline. The original table image is below.
View original table image
Model-2
After fitting children deaths we get for the independent variable we get results for multiple model from table 3. When birth order is taken into account we get, with respect to birth order 1 the risk of infant death is 12% higher but on insignificant state with 95% confidence interval from 0.945 to 1.330 for birth order 2. For birth order 3 we get with respect to reference level risk is 2.16 times higher than reference level on significant status with 95% confidence interval from 1.797 to 2.585. For birth order more than 3 with respect to reference level of birth order 1 we get the risk of infant death is 5.79 times higher on significant state with 95% confidence interval from 4.546 to 7.376. It can be seen that birth order has significantly increasing effect on infant mortality. Table shows that for maternal age more than 25 years risk of infant mortality is significantly 21% low with respect to reference level of women age up to 25 years with 95% confidence interval from 0.697 to 0.898. For sex of child risk of infant death is with respect to reference level of male children is 20% lower for females with 95% confidence interval from 0.709 to 0.895 at significant state. Table also shows that for home as place of delivery shows approximately 58% higher risk than any institutional delivery with an significant relative risk and 95% confidence interval 1.375 to 1.836. Considering the maternal education to knowing about the risk of infant deaths we consider up to secondary education status as reference level, we get for above secondary educated women, infant death is 4% lower to reference Taking Religion level from we considered Hindus as reference level, on that level we can see that hazard ratio of infant death is 18% lower in Non-Hindus with respect to reference level on insignificance status with 95% confidence interval 0.702-0.958. We get for residential status risk of infant death is 1.13 times higher in rural areas with respect to reference level of urban areas at insignificant status with 95% confidence interval from 0.951 to 1.357. For wealth index reference level is considered as poorest class we get for poorer class risk of infant deaths is 3% lower than reference level with 95% confidence interval from 0.832 to 1.131 on insignificant status. For middle class risk is 18% lower with significant status and 95% confidence interval 0.688-0.982 on behalf of reference level. For richer classes risk of infant death is insignificantly lower 0.15 times with 95% confidence interval from 0.699 to 1.043 with respect to reference level. Richest class shows 30% lower risk than reference level with significant status and 95% confidence interval 0.547-0.905. When comparison of -2 log likelihoods of Model 1 and 2 are made we found that from results that for model-1, -2 log likelihood is 19935.496. For model-2 we get the value of -2 log likelihood is 21392.019. Which interprets that model-1 shows better effect on infant mortality, by which it also can be interprets breastfeeding plays an important role in duration of infant survival. When thorough study of multiple model is considered results shows that at last from simple and multiple model the variables which make significant effect on infant mortality are Birth Order, Sex of Child, Maternal education, Breastfeeding, Birth weight. Wealth index, Residence and religion shows insignificant effect on infant mortality. By the results we can say that for infant mortality, Birth Order, Maternal age, Sex of Child, Maternal education, Breastfeeding, Birth weight can be mainly considered to study.
Discussion and Conclusion
Results we get from the Cox Proportional hazard model for infant mortality separately for simple and multiple models for different independent variables for study to know about their risk on different level with respect to reference level. Starting with simple models we get increasingly significant effect of birth order on infant mortality. For maternal age we get insignificantly decreasing effect on infant mortality. Sex of Child shows the significantly decreasing effect on infant mortality. Place of delivery shows insignificant effect on infant mortality. Educational status shows as the educational level increase risk of infant mortality decrease significantly. Non-Hindus shown significantly less effect on infant mortality. Increasing effect on corresponding residence can be seen from results. Breastfeeding suggest that significant risk on infant mortality. Birth weight shows significant effect of increasing the weight in infant. In case of Wealth index shows that significantly decreasing effect on infant mortality. Multiple model which made without Variable birth weight cause it wasn't had similar unit size to other, provides for model-1, that increasing risk of death as birth order increases significantly. For maternal age increasing risk as per age. For sex of child significantly lower risk in females than males. For place of delivery higher risk in delivering at home. Similar pattern can be seen for education level. Religion shows insignificant risk of death of infants. Residential status shows insignificantly higher risk of infant mortality in rural areas. Breastfeeding suggest that significant risk on infant mortality. In case of birth weight, risk of death significantly changes as birth weight changes. Wealth index shows the same results as simple models. After results of both the models it can be suggested that Birth order, Sex of Child, Education, Breastfeeding, Birth weight and wealth index are most important factors to effect the infant mortality. When Model-2 considered we found similar results than Model-1. But we also get that as breastfeeding included in the model the results art end to more better interpretation for infant mortality. Study indicates that demographic, maternal, economical, social, household and child related factors can be very helpful to understanding infant mortality. Condition of infant mortality can be improved by proper implementation of
Figures and tables from the paper
References
24 in the original paper- Behrman JR. Nutrition, health, birth order and seasonality: Intrahousehold allocation in rural India. Journal of Development Economics. 1988; 28(1):43-62.
- Govindsamy P, Malhotra A. Womens position and family planning in Egypt. Studies in family planning. 1996; 27(3):328-340.
- Kishor S. May god gives sons to all: child mortality in India, American sociological review. 1993; 58(2):247265.
- Bicego G. Trends, age patterns and determinants of childhood mortality in Haiti, Baltimore: The Johns Hopkins University, 1990.
- Caldwell JC. Mass education as a determinant of mortality decline, In: Caldwell JC, Santow G. (Eds.). Selected readings in the cultural, social and behavioural determinants of health, Canberra: The Australian National University, 1989, 101-109.
- Cleland JG, Van Ginneken JK. Maternal education and child survival in developing countries: The search for pathways of influence. Social Science and Medicine. 1988; 27(12):1357-1368.
- Cox DR. Regression models and life-tables, Journal of the Royal Statistical Society Series B (Method-ological). 1972; 34(2):187-220.
- Hobcraft JN, McDonald JW, Rutstein SO. Socioeconomic factors in infant and child mortality: A cross national comparison. Population Studies. 1984; 38(2):193-223.
- International institute of population studies, National family health survey of India Report, Mumbai, India, IIPS, 2015-16.
- Kembo J, Ginneken JKV. Determinants of infant and child mortality in Zimbabwe: Results of multivariate hazard analysis, demographic research. 2009; 21(13):367-384.
- Manda SOM. Birth intervals, breastfeeding and determinants of childhood mortality in Malawi, Social Science and Medicine. 1999; 48(3):301-312.
- Miller RG, Jr Gong G, Munoz A. Survival analysis, john wiley and sons, Inc, USA, 1998.
- Montgomery DC, Peck EA, Vinning GG. Introduction to linear regression Analysis, Third Edition, john wiley and sons (Asia) pte ltd. Singapoore, 2003.
- Mosley WH, Chen LC. An analytical framework for the study of child survival in developing countries, Population and Development Review. 1984; 10:25-45.
- Park CB, Nam-Hoon C. Consequences of son preference in low-fertility countries in East Asia: Rising imbalance of sex ratio at birth, Population and Development Review. 1995; 21:59-84.
- Pebley AR, Sajeda A. The impact of a public-health intervention on sex differentials in childhood mortality in rural Punjab, India, Health Transition Review. 1991; 1:143-169.
- Renshaw AE. Actuarial graduation practice and generalized linear and nonlinear models. J Inst. Act. 1991; 118:295-312.
- Robinson WS. Ecological correlations and the behavior of individuals, American Sociological Re-view. 1950; 15:351-357.
- Salker E, Feinlieb M, MacMahon B. The duration of postpartum amenorrhea, American Journal of Epidemiology. 1965; 82:347-358.
- Singh KK, Pandey N, Gautam A. Socio-Demographic Correlates of Neonatal and Infant Mortality: A Hazard Model Based Analysis Journal of Empirical Research in Social Science. 2008; 3(1-2):60-76.
- Singh N. Study on Child Mortality: A Mathematical Model Approach, 2009.
- United Nations Millennium Project, Investing in Development: A Practical Plan to Achieve the Millennium Development Goals (Main Report), United Nations: New York, 2005.
- Williamson NE. Sons or Daughters: A Cross-Cultural Survey of Parental Preferences. Beverly Hills: Sage, 1976.
- Zerai A. Preventive health strategies and infant survival in Zimbabwe, African Population Studies. 1996; 11(1):29-62.